
High Frequency Steady-State Visual Evoked Potentials:
An Empirical Study on Re-test Stability for Brain-Computer
Interface Usage
Jan Ehlers
1 a
, Thorsten Lueth
2
and Axel Graeser
2
1
Institute of Media Informatics, Bauhaus University Weimar, Bauhausstr 11, 99423 Weimar, Germany
2
Institute of Automation, University of Bremen, Otto-Hahn-Alle 1, 28359 Bremen, Germany
Keywords: Brain-Computer Interfaces, SSVEP, EEG.
Abstract: Steady-State Visual Evoked Potentials (SSVEP) constitute an established approach to operate a Brain-
Computer Interface (BCI). In contrast to stimulation between 13 and 17 Hz, stimulation above 30 Hz is
considered less annoying and diminishes the risk of epileptic seizures. However, high-frequency BCIs usually
feature slow processing speed and accuracy rates which reduces user satisfaction. We investigate the re-test
stability of resonance frequencies between 30 and 50 Hz in 18 participants over a period of 40 days, including
seven consecutive runs. Aim is to determine individual resonance profiles for recurring BCI usage that make
time-consuming calibration phases no longer necessary. Preliminary findings of a clinical sample are reported
as well. Results indicate that seven of nine frequencies fail to repeatedly induce stable responses. However,
stimulation with 32 and 40 Hz induced strong and recurring SSVEP in the vast majorities of trials.
Consequently, high-frequency based BCI usage will continue to presuppose individual calibration. Apart from
this, since 40 Hz oscillations are suggested to play a key role in various brain functions, it is reasonable to
assume pronounced cortical reactions to 32 Hz to also constitute a neuronal oscillator that is functional active
during cognitive processing.
1 INTRODUCTION
Intermittent photic stimulation (IPS) of frequencies at
a rate of 4 Hz or higher evokes a synchronized cortical
response of rhythmic activity linked to the triggering
frequency (Herrmann, 2001). Oscillatory EEG
activity that arises from repetitive stimulation is
referred to as Steady-State Visual Evoked Potentials
(SSVEP) and constitutes an important clinical test to
detect photoparoxysmal responses. Recorded
primarily over early visual processing areas of the
brain, it is assumed to occur due to neuronal
oscillators that selectively respond to predetermined
frequencies, so-called resonance frequencies (Makeig
et al., 2002). Amplitudes of SSVEP activity seem to
peak at 15 Hz (Pastor et al., 2003) but are also
reported to be correlated with the EEG alpha-range
(8-12 Hz), indicating strongest responses near a
dominant resting frequency (Jin et al., 2000; Ehlers et
al., 2012). A previous study (Herrmann, 2001)
demonstrates the origin of SSVEP activity up to 100
a
https://orcid.org/0000-0002-4475-2349
Hz and reports pronounced cortical reactions to
flickering stimuli in the 10, 20, 40 and 80 Hz range
compared to adjacent frequencies.
In the recent past, SSVEP activity has been
applied successfully to operate a Brain-Computer
Interface (BCI) (Stawicki et al., 2016; Chabuda et al.,
2018). A BCI is a non-muscular communication
system that classifies EEG activity patterns and
translates them in real time into commands for
various applications. As indicated above, SSVEP-
based BCIs require overt attentional shifts between
constant flickering sources whereas each stimulation
frequency is associated with a certain command.
Usually, SSVEP frameworks apply stimulation
between 13 and 17 Hz since this range is known to
produce prominent and easy to detect SSVEP
(Allison et al., 2010; Ehlers et al., 2012; Stawicki et
al., 2016). However, visual annoyance and
photosensitivity pose a problem, especially in this
particular spectrum. As a consequence, recent
research focuses IPS above 30 Hz. Higher frequency
164
Ehlers, J., Lueth, T. and Graeser, A.
High Frequency Steady-State Visual Evoked Potentials: An Empirical Study on Re-test Stability for Brain-Computer Interface Usage.
DOI: 10.5220/0008348401640170
In Proceedings of the 3rd International Conference on Computer-Human Interaction Research and Applications (CHIRA 2019), pages 164-170
ISBN: 978-989-758-376-6
Copyright
c
2019 by SCITEPRESS – Science and Technology Publications, Lda. All rights reserved
stimulation has proven to reduce the risk of epileptic
seizures and is usually considered less annoying
during long-term usage (Molina, 2009; Müller et al.,
2015; Chabuda et al., 2018). Due to poor signal-to-
noise ratios (SNR), however, processing speed of a
high frequency SSVEP framework is comparably
slow and associated with considerably lower
accuracy rates (Molina, 2009; Ehlers et al., 2012).
Similar to SSVEP activity during low frequency
stimulation, induced cortical reactions between 30
and 46 Hz seem to occur selectively and feature inter-
individual differences (Ehlers et al., 2012; Stawicki et
al., 2016; Chabuda et al., 2018). Current SSVEP-
based frameworks above 30Hz (e.g. Chabuda et al.,
2018) apply time-consuming calibration phases prior
to BCI usage to detect prominent resonance
frequencies. However, it’s not clear whether a once-
identified individual frequency set will provide the
same resonance performance during repeated usage.
To our knowledge, the re-test stability of resonance
frequencies above 30 Hz over a longer period has not
been investigated yet. Repeated stimulation carried
out over several test days should enable to detect
temporally stable oscillators that produce distinct and
recurring SSVEP and make time-consuming
calibration no longer necessary. For this purpose, the
current study applies four consecutive sessions with
varying time intervals in-between. In controlled
settings, nine stimulation frequencies between 30 and
46 Hz are inspected for SNRs and re-test stability
over a period of 40 days. Furthermore, initial results
with regard to a clinical pilot study are provided to
give an impression of cortical reactions to flickering
stimuli in potential target users.
2 METHODS
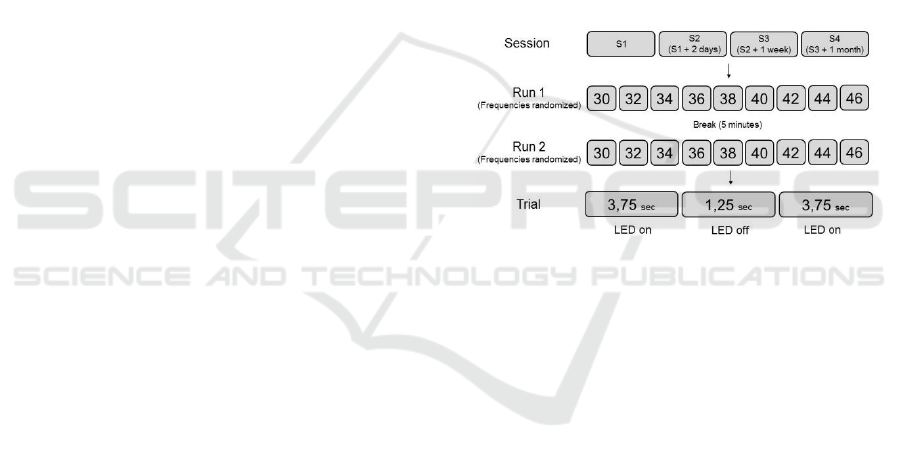
2.1 Design and Procedure
To test the stability of induced driving responses,
SSVEP screenings were arranged in four sessions,
including two runs of nine randomized trials in two
LED-on phases each (figure 1). Intervals between
sessions were controlled as follows: 1st session / 2nd
session: 1st session + 2 days / 3rd session: 2nd session
+ 1 week / 4th session: 3rd session + 1 month. Due to
the availability of our participants, daytimes could not
be controlled and varied between 10:00 am and 16:00
pm. Lab environment exhibited a common level of
background noise, lighting conditions were kept
constant at 780 lux.
Participants were seated in a comfortable chair,
40 cm in front of an LED array. LEDs had an edge
length of 20x14 mm and were marked in ascending
order with numbers from 1 to 4; vertical angle of
vision was 0.3°. The experimenter indicated a
specific number before start and participants were
instructed to focus the given LED during a complete
trial of 8,75 seconds. Nine frequencies between 30
and 46 Hz (in a step of 2 Hz: 30, 32, 34, 36, 38, 40,
42, 44, 46) were assigned in randomized order at
varying positions on the array. Since IPS of just under
four seconds is sufficient to selectively induce
resonance properties (Molina, 2009), each frequency
was tested in two successive LED-on segments of
3.75 seconds with an LED-off segment of 1.25
seconds in between. After a five-minute rest,
screening procedure was repeated. The fourth session
consisted of only one run. Accordingly, each
volunteer participated in seven screenings. Flickering
frequencies were controlled by a microcontroller
(PIC16F877, Microchip, Chandler, Arizona, USA).
Figure 1: Overall testing procedure.
Additionally, a pilot study on high frequency
SSVEP activity in potential BCI target users was
carried out in a usual working area. Moreover, except
for stimulation frequencies and trial duration,
experimental setup and testing equipment differed
strongly from the current specifications. Frequencies
were randomly assigned to four square shaped LEDs
(edge length: 7x7 cm) arranged around a computer
monitor. Viewing distance and environmental
conditions could not be controlled. Also, due to state
of health, patients performed only a single session
including two runs. For more details on the SSVEP
framework see (Ware et al., 2010).
2.2 Participants
18 volunteers (16 females; mean age: 24 years, SD:
4) were included in the current study. Participants had
normal or corrected-to-normal vision and no prior
experiences with BCIs. They reported no history of
head injury and no neurological or psychiatric
disorder. Participants were informed that repetitive
stimulation might lead to epileptic seizures and
High Frequency Steady-State Visual Evoked Potentials: An Empirical Study on Re-test Stability for Brain-Computer Interface Usage
165

confirmed that they never suffered from epilepsy or
any photosensitive reactions. Information on regular
medication was not collected. Participants received
course credits, written informed consent was obtained
prior to the start.
The clinical sample consisted of 16 potential BCI
target users (three females; mean age 40 years, SD:
11) that were tested on basis of a differing SSVEP
setup. These volunteers were recruited from the
Cedar Foundation (Belfast, Northern Ireland), a non-
profit organization that supports people with various
disabilities. The sample included patients that suffer
from severe handicaps due to brain/spine injuries,
stroke or cerebral palsy.
All measurements were performed in accordance
with the Declaration of Helsinki and approved by the
ethical board of the associated EU-project “BRAIN”
(No. 224156).
2.3 Data Collection
EEG data was recorded from the surface of the scalp
via six water-based electrodes (Twente Medical
System International (TMSI), Oldenzaal,
Netherlands). Electrodes were mounted according to
the extended 10-20 system of electrode placement
[19] at PZ, PO3, PO4, O1, OZ, O2, O9, O10 and
grounded at AFZ. Shielded cables connected
electrodes and the high-impedance amplifier system
(Porti32, TMSI). Sampling frequency was set to 2048
Hz with a high-pass filter at 0.1 Hz. BCI2000
software (Schalk et al., 2004) was applied for data
acquisition and storage. The signal processing
module was implemented in the BCI2000 framework.
2.4 Signal Processing
During stimulation with a specific frequency, the
power of all (eight) others is estimated
simultaneously. Successful stimulation will induce a
considerable power increase within the associated
frequency. Assuming stimulation with a flickering
frequency of f Hz, SSVEP activity measured at
electrode number i can be estimated as:
TSttbkftay
h
Nk
k
kikii
0,2sin
1
,,
(1)
where b(t) describes the noise, TS the time segment
and N
h
the number of harmonics (Friman et al., 2007).
Each sinusoid on each electrode has its own
amplitude and phase. The nuisance signals b(t) can
have several origins, e.g. concurrent brain activity,
breathing artefacts or environmental disturbances. To
improve target frequency detection, nuisance signals
have to be decreased and the envisaged SSVEP signal
to be magnified. This is achieved by a linear
combination of signals determined by the N
y
electrodes into new channels s (Mandel et al., 2009).
With N
s
as the number of channels, a single channel
s
l
is defined by:
S
N
i
ilil
Nltywts
y
0,
1
,
(2)
Weighting factors w
i,l
of the spatial filtering are
determined on basis of the Minimum Energy
Combination (MEC) that has proven good
performance in former applications (Allison et al.,
2010; Volosyak et al., 2010). The MEC allows the
combination of an arbitrary number of electrodes.
The combination matrix is constantly adapted in real
time to react to electrodes that may lose contact or
transmit poor signals. These electrodes receive a low
weighting or might even be ignored to provide a
proper signal quality over time. A sliding window of
two seconds ensures sufficient EEG data for the
analysis.
Total power of the SSVEP frequency is estimated
slightly different to the squared Discrete Fourier
Transform (DFT) magnitude (Friman et al., 2007;
Mandel et al., 2009). With X
k
as the SSVEP model
containing the sine and cosine pairs with the
harmonic frequencies, the power in the kth SSVEP
harmonic frequency in the lth channel signal s
l
, is
estimated to:
(3)
Last step of signal processing is the normalization
of the absolute SSVEP activity for each stimulation
frequency (which is the average of the power over all
N
s
spatially filtered components and all N
h
SSVEP
harmonic frequencies) into relative values in order to
yield comparability (Volosyak et al., 2010):
f
N
j
j
i
i
P
P
p
1
ˆ
ˆ
(4)
f
N
i
i
p
1
1
(5)
SNR is calculated for each frequency f. The
normalized and averaged SSVEP signal of a
frequency during stimulation is divided by the noise
signal. Here, the normalized (4) and averaged signal
of a target frequency obtained during the LED-off
phase is considered as noise.
offf
onf
f
p
p
SNR
,
,
(6)
2
,
ˆ
l
T
klk
sXP
CHIRA 2019 - 3rd International Conference on Computer-Human Interaction Research and Applications
166
The higher the SNR for a frequency, the higher
the difference between SSVEP activity during the
LED-on phase compared to the LED-off phase.
2.5 Statistical Analysis
A Kolmogorov-Smirnov test revealed that the data is
not well modeled by a normal distribution. We
applied an analysis of variance by ranks for
dependent measures according to Friedman to
compute differences of SNRs between all
frequencies. During signed-rank tests, alpha level
accumulates and Bonferroni method was applied for
correction (adjusted alpha level: 0.0014). To
determine effect sizes, we used the Pearson
correlation (r) on basis of z-values of the Wilcoxon
tests (r= z/square root(n)), (n= 126 observations).
3 RESULTS
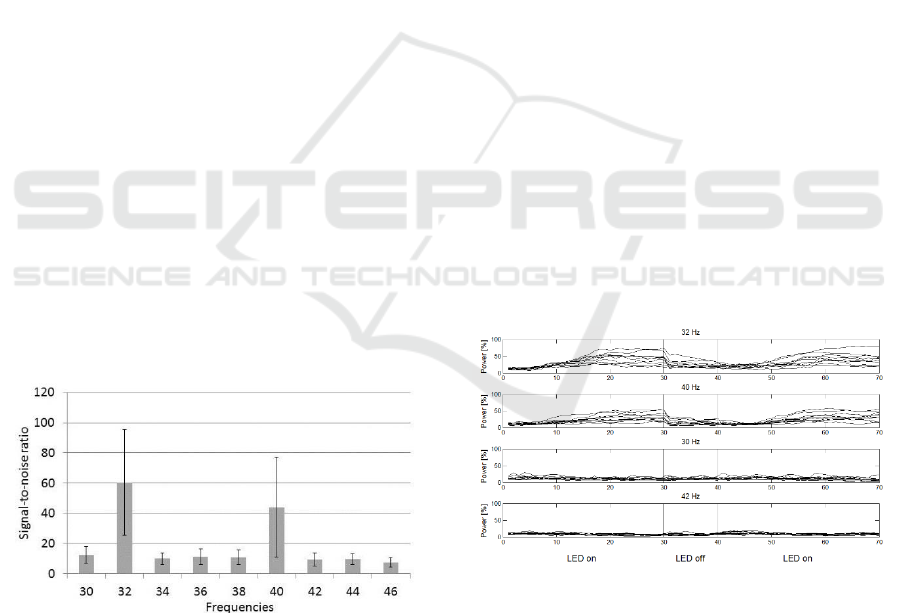
The non-parametric Friedman test revealed
considerable differences among SNRs elicited by all
nine stimulation frequencies (χ
2
=434,76; p< .001).
Averaged across sessions, IPS on basis of 32 and 40
Hz induced significant higher SNRs compared to all
other frequencies (p< .001). Also, IPS with 32 Hz
elicited stronger SSVEP compared to stimulation
with 40 Hz (z= -4,40; p< .001) (figure 2). Differences
between 32 Hz and all other frequencies (except 40
Hz) amount to r=0.86, indicating large effects with
regard to Cohen’s benchmark. Between 40 Hz and
adjacent frequencies (except 32 Hz), effect sizes
amount to r=0.83.
Figure 2: Averaged signal-to-noise ratios across all IPS
trials.
In 92% of all cases (four LED-on periods per
session for each frequency), 32 Hz proved to induce
strongest or at least second strongest cortical
reactions. 40 Hz turned out to be the dominant or
second dominant resonance frequency during 68% of
all cases. The remaining frequencies only
sporadically provoked stronger responses compared
to all others. Stable SSVEPs beyond 32 and 40 HZ
could not be observed across the testing sessions
Figure 3 depicts the SSVEP power across time for
IPS with 32 and 40 Hz as well as for two adjacent
frequencies (30 and 42 Hz). For reasons of clarity,
results of only ten participants are depicted (averaged
across all sessions). Power was calculated
simultaneously for all nine frequencies, proportional
values of the four given frequencies are illustrated for
LED-on segments (3.75 seconds, data points 0 to 30
and 40 to 70) and the in-between LED-off segment
(1.25 seconds, data points 30 to 40). The spatial filter
combines all signals of the electrode placement.
On average, IPS on basis of 32 and 40 Hz evokes
a distinct physiological response. SSVEP activity
occurs approx. one second after stimulus-onset as a
linear increase in power. Peak amplitudes are
observed after approx. 2.5 seconds. Subsequent to
stimulus-offset, SSVEP power rapidly declines and
falls back to pre-stimulus level. Relative power of a
stimulation frequency may theoretically amount to
100%, given that power of all others is zero.
Assuming all nine frequencies to contribute the same
would result in 11.11% each. During IPS with 32 Hz,
its specific share increases to approx. 65% of the
overall activity; IPS on basis of 40 Hz reaches approx.
40% of the total power. In contrast, stimulation with
adjacent frequencies (here: 30 and 42 Hz) induces no
considerable SSVEP; on average, their respective
share in the overall signal remains the same as during
LED-off phases.
Figure 3: SSVEP power characteristics during IPS with 30,
32, 40 and 42 Hz. Individual averages of ten participants
across seven runs. Abscissa: data points.
Due to differences in methods, procedure and
equipment, findings from the clinical pilot study are
not directly comparable to the above-mentioned
results. However, cortical reactions to IPS with 32
and 40 Hz are still depicted to provide an impression
on their resonance properties also in neurological
patients and less controlled environments (figure 4).
High Frequency Steady-State Visual Evoked Potentials: An Empirical Study on Re-test Stability for Brain-Computer Interface Usage
167

Averaged across all four LED-on periods, we observe
a linear increase in 32 Hz power for over three
quarters of all participants; again, SSVEP activity
during stimulation with 40 Hz occurs comparably less
pronounced. Latencies to stimulus-onset are similar
to the sample of heathy participants. However, due to
the lack of comparability and the low amount of data,
we refrain from general statements or inferential
statistical analysis.
Figure 4: SSVEP power characteristics during IPS with 32
and 40 Hz for the clinical sample. Individual averages of
ten participants across two runs. Abscissa: data points.
4 CONCLUSIONS
IPS above 30 Hz largely diminishes the risk of
photosensitivity and reduces visual annoyance.
However, BCIs that apply high frequency stimulation
usually lack adequate accuracy rates and processing
speed due to low signal-to-noise ratios and random
subsets of frequencies (Ehlers et al., 2012). In a recent
study, Chabuda et al (2018) utilize IPS between 30
and 39 Hz and observe strong SSVEP in eight out of
ten frequencies for more than half of their
participants. However, no specific resonance
frequency emerged particularly common, indicating
high interindividual differences with regard to
cortical resonance above 30 Hz. Presupposing this, it
would be necessary to apply time-consuming
calibration phases for each individual prior to BCI
use. Also, it’s not clear whether a once-identified
individual frequency set will provide the same
resonance performance during repeated usage. The
current study aims to determine resonance
frequencies above 30 Hz that produce stable and
recurring SSVEP. Similar to findings during IPS
featuring low (Jin et al., 2000; Ehlers et al., 2012) and
high frequency stimulation (Chabuda et al., 2018), we
assume cortical responses to occur selectively and to
exhibit interindividual differences.
The current findings indicate that except for 32
and 40 Hz, none of the considered stimulation
frequencies (30, 34, 36, 38, 42, 44, 46 Hz) repeatedly
induce stable cortical responses. Though all of them
occasionally produce strong SSVEP compared to
adjacent frequencies, individual resonance profiles
for regular BCI usage could not be defined. IPS on
basis of 32 and 40 Hz, however, induced pronounced
and recurring SSVEP in all participants and in the
vast majorities of trials. Also, although not validated
yet, results seem to be transferable to participants
featuring various neurological diseases. For these
users it is of particular importance to be equipped
with reliable and high-performing systems. Further
research on clinical users need to be carried out to
evaluate whether the effects prevail in longer-term
studies and may ensure adequate usage in future
scenarios, for example in the area of smart homes or
rehabilitation robotics.
Considering neurophysiological research over the
recent past, strong reactions to flickering stimuli of 40
Hz are hardly surprising. 40 Hz oscillations are
assumed to play a significant role in cognitive
functions, including (but not limited to) visual feature
binding (Busch et al., 2004; Basar et al., 2016) or
attention processing (Herrmann et al., 1999). The
disposition to external stimulation could therefore be
considered as an indication that a particular frequency
plays a decisive role in cognitive processing. Similar
correlations have been reported for oscillations near a
dominant resonance frequency in the alpha range
(Pastor et al., 2003; Ehlers et al., 2012). Given that
IPS identifies neuronal oscillators, synchronized
responses to stimulation with 32 Hz may also suggest
functional relevance of this particular frequency.
While adjacent frequencies display no or only few
distinct physiological responses, 32 Hz exhibits even
stronger resonance properties compared to
stimulation with 40 Hz. Re-test stability across
various sessions at different times of day suggests that
factors like vigilance, biorhythm or any kind of
psychological state have little or no effect on the
resonance properties. However, at this point, we
cannot make any assumptions of a certain role of 32
Hz oscillations in cognitive processing.
High frequency SSVEP-based BCIs of the recent
past suggest a four- or five-way command interface,
allocating each stimulation frequency to a different
command, e.g. “up”, “down”, “left”, “right” and
“select” for screen-based spelling applications
(Ehlers et al., 2012; Chabuda et al., 2018). As
indicated above, these systems entail considerably
lower accuracy rates/information transfer rates
compared to BCIs that apply the same number of
CHIRA 2019 - 3rd International Conference on Computer-Human Interaction Research and Applications
168

stimulation frequencies (or even more) in the range
between 13 and 17 Hz (Allison et al., 2010; Ehlers et
al., 2012; Stawicki et al., 2018). Individual frequency
sets that may improve processing accuracy of high
frequency SSVEP BCIs could not be established
during this study. However, it is to be noted that we
excluded numerous frequencies from our screening
(31, 33, 35, 37, 39, 41, 43, 45 Hz) due to the overall
duration of a session. Considering the selectivity of
cortical responses to IPS, it cannot be ruled out to
identify further resonance frequencies above 30 Hz.
Due to only two stable and recurring resonance
frequencies so far (32 & 40 Hz), high frequency based
BCI usage will continue to presuppose individual
calibration beforehand. However, for multimodal
interaction concepts that include various
physiological input options (e.g. eye movements), the
application of 32 and 40 Hz stimulation may provide
a further promising communication channel.
ACKNOWLEDGEMENTS
The current research has received funding from the
European Community's Seventh Framework
Programme under grant agreement No 224156. The
authors express their gratitude to all volunteers,
especially the tenants of the Cedar Foundation. We
sincerely thank Melanie Ware and Alexander
McRoberts from the University of Ulster for the
smooth cooperation during the patient testing.
REFERENCES
Allison, B., Luth, T., Valbuena, D., Teymourian, A.,
Volosyak, I. and Graser, A. (2010). BCI Demographics:
How Many (and What Kinds of) People Can Use an
SSVEP BCI? IEEE Transactions on Neural Systems
and Rehabilitation Engineering, 18(2), pp.107-116.
Başar, E., Emek-Savaş, D., Güntekin, B. and Yener, G.
(2016). Delay of cognitive gamma responses in
Alzheimer's disease. NeuroImage: Clinical, 11, pp.106-
115.
Busch, N., Debener, S., Kranczioch, C., Engel, A. and
Herrmann, C. (2004). Size matters: effects of stimulus
size, duration and eccentricity on the visual gamma-
band response. Clinical Neurophysiology, 115(8),
pp.1810-1820.
Chabuda, A., Durka, P. and Zygierewicz, J. (2018). High
Frequency SSVEP-BCI With Hardware Stimuli
Control and Phase-Synchronized Comb Filter. IEEE
Transactions on Neural Systems and Rehabilitation
Engineering, 26(2), pp.344-352.
Chatrian, G., Lettich, E. and Nelson, P. (1985). Ten Percent
Electrode System for Topographic Studies of
Spontaneous and Evoked EEG Activities. American
Journal of EEG Technology, 25(2), pp.83-92.
Ehlers, J., Valbuena, D., Stiller, A. and Gräser, A. (2012).
Age-Specific Mechanisms in an SSVEP-Based BCI
Scenario: Evidences from Spontaneous Rhythms and
Neuronal Oscillators. Computational Intelligence and
Neuroscience, pp.1-9.
Friman, O., Luth, T., Volosyak, I. and Gräser, A. (2007).
Spelling with steady-state visual evoked potentials. In
Neural Engineering, 2007. CNE'07. 3rd International
IEEE/EMBS Conference on IEEE, pp.354-357.
Herrmann, C. (2001). Human EEG responses to 1-100 Hz
flicker: resonance phenomena in visual cortex and their
potential correlation to cognitive phenomena.
Experimental Brain Research, 137(3-4), pp.346-353.
Herrmann, C., Mecklinger, A. and Pfeifer, E. (1999).
Gamma responses and ERPs in a visual classification
task. Clinical Neurophysiology, 110(4), pp.636-642.
Jin, Y., Castellanos, A., Solis, E. and Potkin, S. (2000).
EEG Resonant Responses in Schizophrenia: a Photic
Driving Study with Improved Harmonic Resolution.
Schizophrenia Research, 44(3), pp.213-220.
Mandel, C., Lüth, T., Laue, T., Röfer, T., Gräser, A. and
Krieg-Brückner, B. (2009). Navigating a smart
wheelchair with a brain-computer interface interpreting
steady-state visual evoked potentials. Intelligent Robots
and Systems, 2009. IROS 2009. IEEE/RSJ International
Conference on IEEE, pp. 1118-1125.
Makeig, S. (2002). Dynamic Brain Sources of Visual
Evoked Responses. Science, 295(5555), pp.690-694.
Molina, G. G., Ibanez, D., Mihajlović, V. and Chestakov,
D. (2009). Detection of high frequency steady state
visual evoked potentials for brain-computer interfaces.
17th European Signal Processing Conference. IEEE,
pp. 646-650.
Müller, S. M. T., Diez, P. F., Bastos-Filho, T. F., Sarcinelli-
Filho, M., Mut, V., Laciar, E. and Avila, E. (2015).
Robotic wheelchair commanded by people with
disabilities using low/high-frequency ssvep-based BCI.
World Congress on Medical Physics and Biomedical
Engineering, pp. 1177-1180.
Pastor, M., Artieda, J., Arbizu, J., Valencia, M. and
Masdeu, J. (2003). Human Cerebral Activation during
Steady-State Visual-Evoked Responses. The Journal of
Neuroscience, 23(37), pp.11621-11627.
Schalk, G., McFarland, D., Hinterberger, T., Birbaumer, N.
and Wolpaw, J. (2004). BCI2000: A General-Purpose
Brain-Computer Interface (BCI) System. IEEE
Transactions on Biomedical Engineering, 51(6),
pp.1034-1043.
Stawicki, P., Gembler, F. and Volosyak, I. (2016). Driving
a Semiautonomous Mobile Robotic Car Controlled by
an SSVEP-Based BCI. Computational Intelligence and
Neuroscience, 2016, pp.1-14.
Volosyak, I., Valbuena, D., Malechka, T., Peuscher, J. and
Gräser, A. (2010). Brain–computer interface using
water-based electrodes. Journal of Neural Engineering,
7(6), p.066007.
High Frequency Steady-State Visual Evoked Potentials: An Empirical Study on Re-test Stability for Brain-Computer Interface Usage
169

Ware, M. P., McCullagh, P. J., McRoberts, A., Lightbody,
G., Nugent, C., McAllister, G. and Martin, S. (2010).
Contrasting levels of accuracy in command interaction
sequences for a domestic brain-computer interface
using SSVEP. Biomedical Engineering Conference
(CIBEC), pp. 150-153.
CHIRA 2019 - 3rd International Conference on Computer-Human Interaction Research and Applications
170
