
The Need for Data-driven Bike Fitting: Data Study of Subjective
Expert Fitting
Jarich Braeckevelt
1,2 a
, Jelle De Bock
1
, Joke Schuermans
3
, Steven Verstockt
1 b
, Erik Witvrouw
3 c
and Jeroen Dierckx
2
1
IDLab, Ghent University - IMEC, AA Tower, Technologiepark-Zwijnaarde 19, 9052 Ghent, Belgium
2
Bioracer Motion, Industrieweg 114, 3980 Tessenderlo, Belgium
3
REVAKI, Ghent University, De Pintelaan 185, 9000 Ghent, Belgium
jeroen.dierckx@bioracermotion.com
Keywords: Bike Fitting, Data-analysis, Subjectivity Study, Statistics.
Abstract: The number of cyclists is growing rapidly, for commuting but also as a sport. With this growth, there has been
an increasing interest in cycling position. Trainers, athletes and bike vendors acknowledged this and started
to perform bike fits. As these experts have different backgrounds and varying levels of expertise, it was
hypothesised that this could have an influence on the outcome in terms of the advised position. In this research
three cyclists were bike fitted by nine different bike fitting studios. It was hypothesised that, as different bike
fitters use varying techniques and have different experience levels, the cyclist would be advised a different
optimal position by these different bike fitters. The preconceived hypothesis was confirmed as the range of
advised positions in both saddle height and setback was up to 3 cm. Data-driven bike fitting can help bring
down these considerable differences amongst fitters and will be discussed in the last chapter.
1 INTRODUCTION
Bike positioning has always been a controversial
topic, ever since riders could adjust their saddle
height, there has been a debate on the “optimal”
cycling position. Eddy Merckx, one of the greatest
cyclists of all times, sometimes even changed saddle
height within races. Also, as more and more people
started competitive and performance-oriented
cycling, research in the domain of cycling
biomechanics has been on the rise the last decade. Yet
there has been little research regarding cycling
position. There are a lot of theories on bike
positioning and bikefitting, which is the process of
making adjustments to the bike until the optimal
position for a certain individual is reached. However,
the scientific evidence behind these fitting theories is
lacking to date.
Historically, bikefitting has generally been the
end result of following some general rules of thumb.
Later on tools such as a plumb line and goniometers
a
https://orcid.org/0000-0001-8360-3891
b
https://orcid.org/0000-0003-1094-2184
c
https://orcid.org/0000-0003-0236-5436
became available and bikefitters, which usually
mastered the “art of bike fitting” by lots of exercise
and perseverance, were now also able to make some
static measurements. Nowadays, as technology made
a huge leap forward, some great aids like motion or
video analysis found their way in the bikefitting
process (Burt, 2014).
In the motion analysis segment of the market, two
major players exist, being Bioracer Motion
(Tessenderlo, Belgium) and Retül (Boulder,
Colorado, USA). They both use active markers,
which are attached to the body to provide realtime and
high-resolution measurements of body angles and
position during the actual cycling motion. Video
analysis software tries to achieve the same purpose by
measuring certain angles based on video footage in
which the user is requested to mark the reference
points for motion tracking manually. Evidently, this
manual segment identification is less sensitive and
specific for precise kinematic analysis purposes
compared to a marker-based motion tracking system
Braeckevelt, J., De Bock, J., Schuermans, J., Verstockt, S., Witvrouw, E. and Dierckx, J.
The Need for Data-driven Bike Fitting: Data Study of Subjective Expert Fitting.
DOI: 10.5220/0008344701810189
In Proceedings of the 7th International Conference on Sport Sciences Research and Technology Support (icSPORTS 2019), pages 181-189
ISBN: 978-989-758-383-4
Copyright
c
2019 by SCITEPRESS – Science and Technology Publications, Lda. All rights reserved
181

which allows three-dimensional real-time motion
tracking without user intervention. These
technologically more advanced techniques, are
ultimately providing more insight in the actual
cycling biomechanics and might reveal discrete
imbalances or positioning errors, invisible to the
naked eye or absent in static evaluation conditions.
More so, they also often prove to be more accurate.
Especially due to the fact that statically measured
angles may differ from those that are measured
dynamically (Garcia-Lopez & Abal del Blanco,
2017). Thus, it is a fact that modern bikefitters have a
greater range of technology at their disposal
compared to their predecessors in the past.
Unfortunately, having modern technology does not
always lead to benefits for the client. Education
remains important, buying the most advanced system
will not necessarily make you the best bikefitter.
A competent bikefitter will pay attention to its
customer and his/her personal goals. Principally, a
bikefit is a compromise between comfort,
performance and injury-prevention. A professional
rider will pay a lot of attention to his performance
level, because his goal is to ride as fast as possible and
beat the opponents. On the contrary, a rider that just
rides a sunday spin with the local cycling club wants
to do this as comfortable as possible. However, these
two ridertypes have usually one thing in common;
they both do not want to get injured. To achieve their
respective goals, they each need to be placed in an
individualised optimal cycling position. Nonetheless,
when participating in a mass cycling event and taking
a glance at colleague riders, an awful lot of cyclist
could be observed which are not riding in their
optimal position. Consequently; a lot of complaints
about saddle discomforts and painful knees or lower
backs exist within the cycling community, possibly
due to insuffucient bike fit (Alta, et al., 2014). A lot
of experts in biomechanics, sports science or
kinesiology recognized this gap in the market, and are
fitting people to their bikes. With the large choice of
bikefitting technologies and the different
backgrounds of the actual fitters in mind, the
inevitable question arises: “Does bikefitting suffer
from some kind of subjectivity?”. In other words does
a client always get the best position for his/her needs;
and does the fitter’s background or his
methodological approach affect the vision on the
“optimal position”.
2 METHODS
Bike Fitting Procedures and Data Collection:
In general, the bike fitting process can be divided in
two parts. A first stage of the fitting process is mainly
focused on the lower body, mainly altering seat
height, saddle setback and adjusting the rider’s cleat
position. The next stage is the upper body posture,
which is determined by handlebar reach (stem length
and the fixed saddle setback) and the handlebar drop
(number of spacers and the degree of the stem).
For the lower body, two general rules exist in bike
fitting. These are respectively the safe knee angle
range and the Knee Over Pedal Spindle (KOPS)
technique. KOPS is defined as the distance that the
patella comes over the center of the pedal spindle
when the pedal is at the 6 o’clock position. Correct
adoption of these two basics should ideally result in
tight ranges across the different bike fits.
For this research, three different cyclists with
differing performance levels and training ambitions
were sent to nine different bike fitting studios. All of
them giving their consent to participate in the
experiments and to publish the results. One of them
was a highly competitive rider, another one a long
distance rider and the last one concerned an older but
still very active cyclist. This undeniably has an
influence in terms of the opposed limitation for each
test person, a highly competitive rider will most likely
be a lot more flexible which allows for a more
aerodynamic setup. Each of the consulted bike fitting
studios adopted another methodological bike fitting
approach, using their prefered technology based on a
particular bike fitting vision. To analyse the intra and
inter system variability, the studios where chosen in
function of their fitting technology. Three studios
used the Bioracer Motion system, three others used
the Retül system and the last three used other
miscellaneous techniques; i.e. video, saddle pressure,
etc. The consulted bikefitters were located in
Flanders, Belgium. The three participating riders
were asked to take personal notes immediately after
each bikefit to give an idea of how the test person had
actually experienced the bikefit. Particularly,
comments regarding customer-friendliness, the
duration and fluency of the fitting procedure as well
as the participant’s subjective perception of comfort
and content with the resulting cycling position were
registered. In addition to that, our test persons asked
on which parameters the fitter based his decision to
do adjustments. Furthermore, all bikefitters gave the
test subjects a report including the detailed
measurements of their endfit. These collected data
icSPORTS 2019 - 7th International Conference on Sport Sciences Research and Technology Support
182
ultimately made an in-depth comparison of the
different bike fitting studios possible.
Each of the fitters could ask for the same amount
of information, the participants were in no way
restricted to answer any of the fitter’s questions. To
have zero bias in the bike fitting procedures, every
rider started each bikefit with the same configuration
(bike, saddle, crank length, saddle height, setback,
reach, handlebar width). After each bikefit, the bike
was adjusted back to the starting position. If the bike
fitter advised insoles or wedges to improve the
cycling movement, these were also removed after the
bikefit as these can also have an influence on cycling
biomechanics (Yeo & Bonanno, 2014) . All these
precautions were taken to ensure that each bike fitter
started off with the same baseline. To analyze
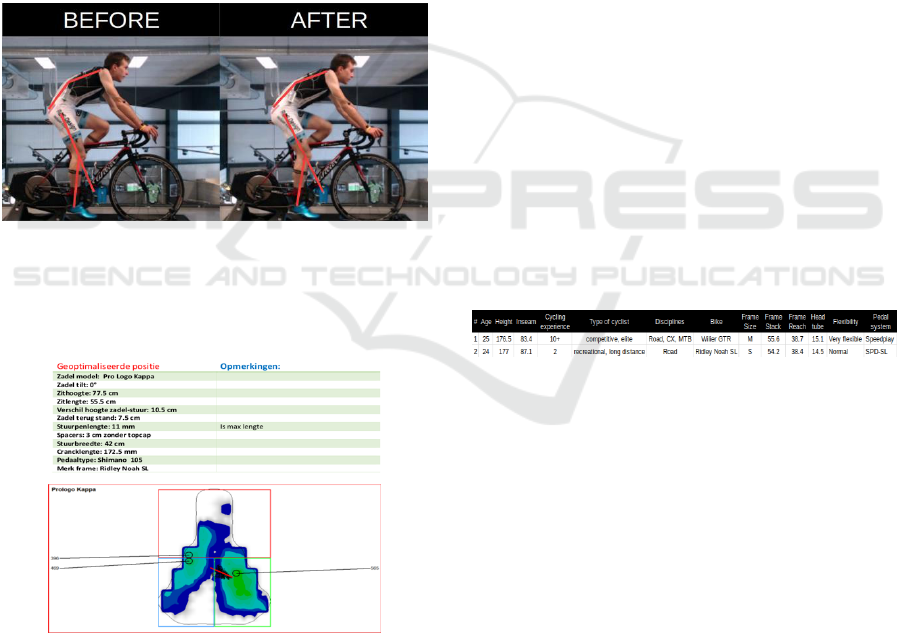
subjectivity, the reports (Figure 1) of all the end fits
of each of the bikefit were collected.
Figure 1: Position before and after the fitting, subject has a
straighter pelvis and smaller knee flexion after fitting.
The fitters relying on motion or video analysis often
provided a quite detailed report (Figure 2).
Figure 2: Extract from a fit report (including saddle
pressure analysis, original fitting instructions - in Dutch).
Other fitters, rather relying on static
measurements and their experience, were generally
providing their measurements on a single sheet of
paper.
In order to compare the different methodologies, the
following measurements were extracted from the fit
report: saddle setback, saddle height, handlebar reach,
handlebar drop and fitted stem length. Advices which
weren’t actually tested during the fit were ignored
during this process.
After the various bike fits, each of the end
positions was thoroughly assessed. This assessment
consisted of the evaluation of the rider’s symmetry
and stability on his bike, as well as his motion quality
via motion analysis. For the evaluation of symmetry
and stability, the Bioracer Motion software (Dierckx,
2019) was used because it is the only tool that allows
for simultaneous bilateral analysis.
Data Analysis:
The fitting data collected in the fitting reports as well
as data on rider’s symmetry, stability and cycling
motion were analyzed in three ways.
Firstly, a comparison between the recreational
rider and the pro rider was made (Table 1), examining
if there were consistent differences in drop, back and
shoulder angle and lower body movement. It was
hypothesized that a pro rider would be bike fitted in a
more aerodynamic position. Mainly because his goal
is to be in the fastest, yet sustainable, position as
possible, but also due to the large training loads, this
type of rider became a lot more flexible and
accustomed to the cycling position.
Table 1: Subject characteristics.
Secondly, the differences in bike fitting
characteristics in between fitting studios were
examined. It could be interesting if one studio is, for
example, striving for other knee angles or has a
completely different approach towards bike fitting.
Lastly, the different fits were compared to one
another for each of the participants. The goal of this
last examination was to provide an insight in how
large the differences are between the different end
fits, first in terms of position measurements, but then
also in regard of the direct biomechanical
consequences of this position, as measured by motion
analysis (i.e. knee angles, KOPS, etc.).
3 RESULTS
The results are presented in two parts. Firstly, the
analysis of the end fits, where only the position of the
The Need for Data-driven Bike Fitting: Data Study of Subjective Expert Fitting
183
bike is considered, is presented. Secondly, the results
regarding cycling position, resulting from the different
fitting procedures, based on assessment of symmetry,
stability and motion in our lab after the bike fits is
demonstrated.
It is remarkable that one of our test persons had to
cancel his last bike fits due to knee inflammation. It is
not known if this was due to the different cycling
positions that were tested by the bike fitter. However,
this certainly might be a possible cause as our other
recreational rider also had similar issues after the same
series of bike fits. This only indicates that a suboptimal
cycling position might put extra stress on the body,
ultimately even causing injuries. Normally it would be
stated that a bikefit can be beneficial and reduces the
stress on the joints. From this research, in contrast, we
evidently have to conclude that a bikefit proves to be a
valuable tool to prevent injuries only if it is performed
properly by an expert.
3.1 Analysis of End Fits
The results of the executed investigation, as already
briefly mentioned, confirmed that different bike fitters
indeed advised a different “optimal” position.
Surprisingly, the differences in end-fit characteristics
between the different fitting approaches were situated
in a centimeter - rather than millimeter range, as
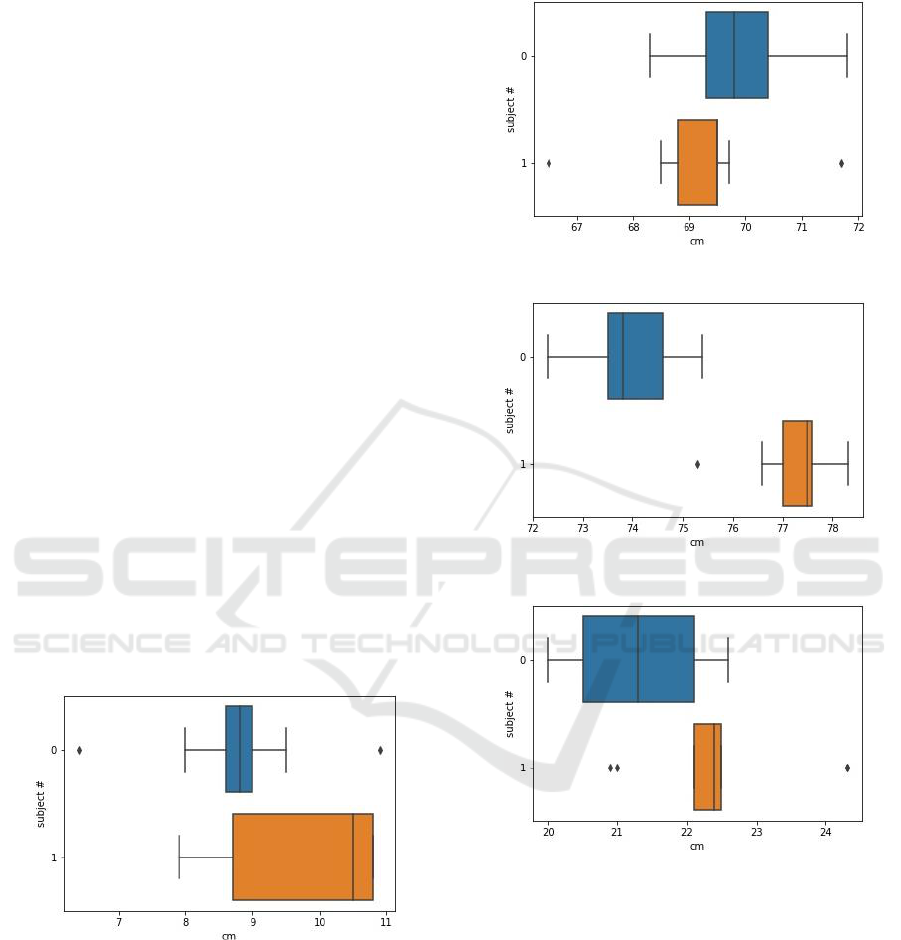
originally expected. Figures 3, 4, 5 and 6 respectively
show the ranges of saddle setback, saddle height,
handlebar reach, and handlebar drop for 2 out of the in
total 3 participating test persons (Table 1).
Figure 3: Handlebar drop for 2 subjects compared.
Another thing that was quite alarming and which
can easily be observed in the seat height boxplots
(Figure 5) was that for the participant with a 4 cm
larger inseam, one bike fitter suggested a seat height
which fell in the exact same range of the other
participant with a significantly smaller inseam.
Unfortunately, the lower body rules, discussed in
the methods section, were clearly not used by every
fitter, which led to higher ranges, as can be seen in the
scatter plot in figure (Figures 7,8 and 9).
Figure 4: Handlebar reach for 2 subjects compared.
Figure 5: Seat height for 2 subjects compared.
Figure 6: Saddle setback for 2 subjects compared.
Seat height was converted to the inseam/seat
height ratio allowing comparison between different
subjects. The colours of the dots represent the used
fitting method. It is remarkable that Retül-assisted
bike fits have the broadest ranges. Additionally, some
fitters even left the initial bike setup unchanged even
if the calculated angles weren’t within the safe ranges.
They deemed that people with lots of hours in the
saddle have a good feeling of which positions suits
them best.
icSPORTS 2019 - 7th International Conference on Sport Sciences Research and Technology Support
184
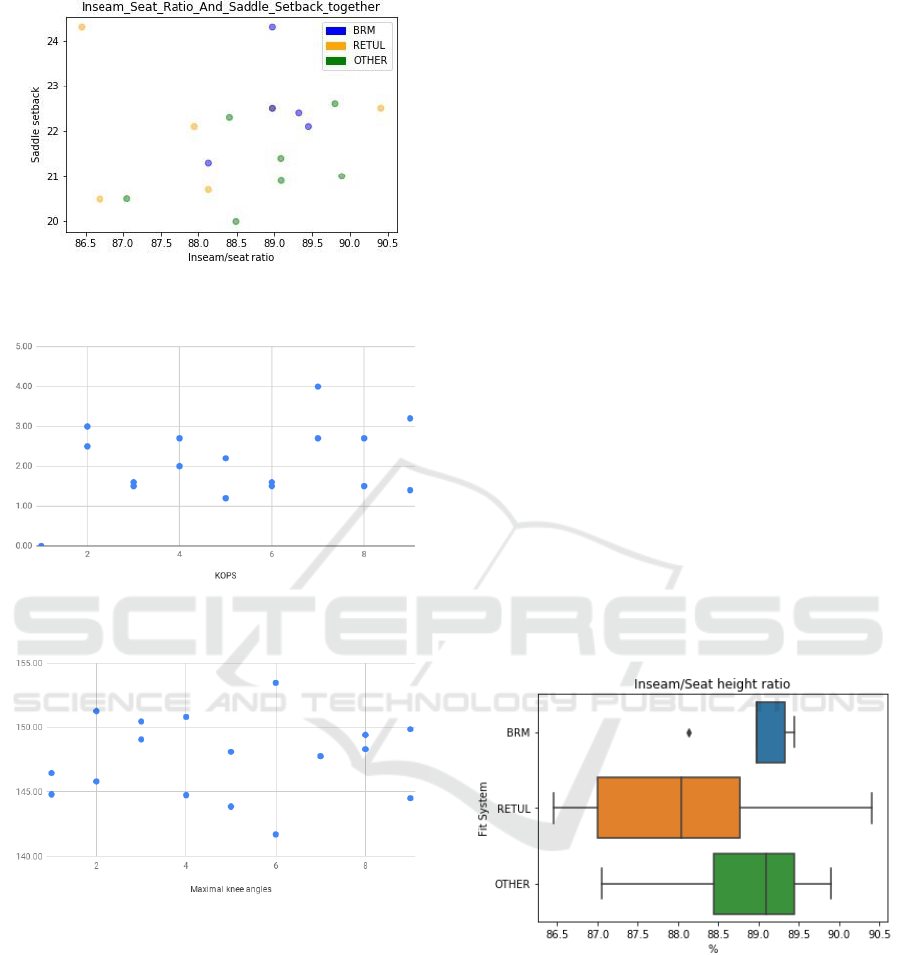
Figure 7: Scatter plot of inseam/seat height ration and
saddle setback.
Figure 8: Scatter plot for different bike fitting studios in
terms of KOPS.
Figure 9: Scatter plot for different bike fitting studios in
terms of maximal knee angles.
The recreational rider, who could maybe benefit
from a more relaxed position, was mostly left in a
somewhat aggressive position. However, this can be
due to the limitations that are posed by the frame, as
this rider was on an aero road bike. Fit bikes can solve
this problem as you can try any possible position. The
competitive rider was lowered down by most of the
fitters but there wasn’t a general consensus on how
low the handlebars should be dropped. In the end,
saddle to handlebar drop became similar for both
participants, which is very remarkable as they clearly
differed in terms of training ambitions and overall
joint mobility and muscle flexibility. It is also notable
that, for the recreational rider, the Retül-driven bike
fits suggested handlebar reaches and drops that were
closer together than those for the competitive rider
(Figures 4 and 5).
Lastly, the inter and intra system variances were
analysed. This might give some interesting insights in
what is needed for a more objective bike fitting
methodology. If the inter system variance is very
small for one system and larger for another system, it
might be that the system is better suited for bike
fitting or is easier to use. If the differences between
fitters who use the same system are large, it might be
an indication that those fitters need additional training
with the system or require additional general bike
fitting education. It is worth noting that more and
reliable data will be necessary to fully confirm this
hypothesis, but initial results of this experiment
definitely show that additional investigation is needed
within the bike fitting community.
As previously mentioned, there are often large
differences in saddle setback between the individual
fitters. However, our data shows that fitters using the
Bioracer Motion system consistently seem to rely on
the software to determine the ideal saddle height,
which was within a range of ± 0.5cm for both test
persons. This in contrast with fitters using Retül or
other systems, where the observed variance was much
larger (Figure 10). Further analysis of this
inseam/seat height ratio was also performed.
Figure 10: Boxplot of intra system inseam seat height ratio
differences.
The results show that the Bioracer Motion (BRM)
measurements were actually in a tight range (apart
from 1 outlier). The end-results of the Retül fits were
varying significantly more than the others. This
somewhat large range might have multiple reasons. A
first indirect reason could be that education of the
people executing Retül bike fits could be further
improved. Better experience and knowledge of the
system will certainly improve the overall quality of
The Need for Data-driven Bike Fitting: Data Study of Subjective Expert Fitting
185
the bike fits, independent of the adopted technology.
Another possible cause is the system’s suggested safe
ranges for knee angles, which influence seat height,
are too broad and should ideally be narrowed down.
Retül systems suggest knee angles between 35 and 40
degrees (Burt, 2014).
A final interesting finding concerning analysis of
end fits was that the rule of thumb of the saddle
height, constructed by Greg LeMond (Burke, 2003),
is actually very close to the average seat height
between the different measurements. This formula
states that the ideal saddle height is 0.883 times the
inseam length, minus 3mm if the cyclist is using
clipless pedals. This number is within a millimeter
from the average of all end fits for both test persons.
Which, once again, states that the rules of thumb from
the past still have a certain value within the modern
bike fitting procedure.
3.2 Motion Analysis
3.2.1 Comparison between Test Persons
Because test person X is a competitive rider, whilst
test person Y is a recreational rider, it is expected that
X will be advised to have a greater drop and reach to
be in a more aerodynamic position. Flexibility is no
issue for rider X, so little limits are imposed on the
configuration of the bike. In contrast, rider Y has
limited flexibility which might for instance have an
influence on the maximal drop.
In contradiction to these assumptions, the
recreational rider was advised a 9.77 cm drop (on
average) as opposed to the pro rider with an average
drop of 8.56 cm (Table 2). However, the handlebar
reach of rider X is on average 1 cm longer than rider
Y. To get a better idea of the influence on the riders’
positions, these configurations were compared to one
another with the Bioracer Motion system. From this
data, we can conclude that the back angle is, on
average, significantly lower for rider Y than rider X,
and the pelvic tilt higher (Figure 11). This means that
rider Y is riding in a more aerodynamic position as he
is lowering his back when cycling. This large
difference in back angle (32.89° in comparison to
38.62°), is very notable, especially as rider X is far
more competitive than rider Y. In other words, rider
X would benefit more from a lower back angle than
rider Y. The shoulder angle is also higher for the
recreational rider with 82.11° in comparison to
79.77°, which makes rider Y stretch more.
Respective end-fit characteristics are in sheer
contrast with the goals of both riders, the recreational
rider’s objectives primarily focusing on comfort and
injury prevention and the professional rider focusing
on performance. It can therefore be concluded that
some fitters might pay (too) little attention to the
specific training goals of their clients.
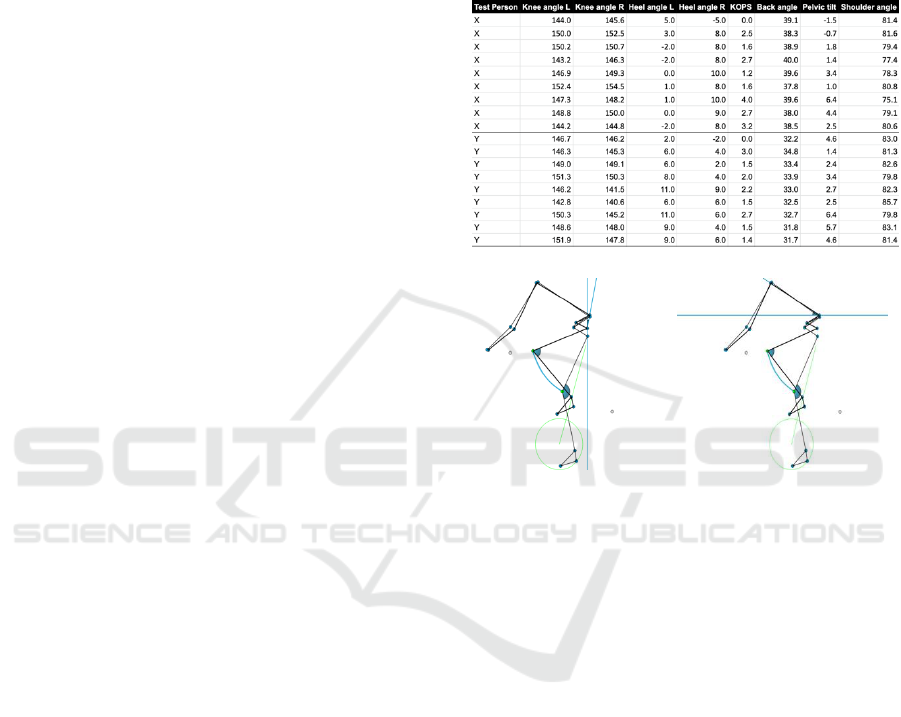
Table 2: Key values from the motion analysis, all values are
in degrees, expect for KOPS [cm].
Figure 11: Left - pelvic tilt angle, right - back angle.
In the lower body there were less notable
differences, rider X has on average 1.2 degrees higher
knee angles (148.27 in regard to 147.06). The heel
angles came out quite a bit lower for rider X (3.78
degrees in regard to 5.94), even though he has limited
flexibility in his right ankle due to an injury in the
past. Generally, 0 degrees heel angle are considered
good, however this is also a personal matter, mainly
depending on the pedaling technique and preference.
3.2.2 Comparison of Different Bike Fitting
Studios
In this comparison the hypothesis is twofold. Firstly,
the different bike fitting studios are compared to one
another to see if the proposed end configurations
result into similar knee, heel, shoulder and back
angles as well as KOPS and pelvic tilt. Secondly, the
end fits advised by the different bike fitting studios
are analyzed to see if they take the customer’s training
goals into account. The hypothesis is that there could
be larger differences in upper body, as the goals of the
cyclists are very different. However, since more
lower body rules-of-thumb exist, there should be
icSPORTS 2019 - 7th International Conference on Sport Sciences Research and Technology Support
186

lesser variability in lower body variables between the
different bike fitting studios.
Upper Body:
For the upper body analysis, shoulder angle, pelvic
tilt and back angle are considered. With regard to
back angle, no consensus could be established
comparing the results of the fits of each of the
consulted studios. The average difference is 6° and as
previously mentioned, it must be noted that the back
angle is lower for the recreational rider, which is
contrast with his athletic profile and training
ambitions. For pelvic tilt and shoulder angle, the
different bike fitting studios seem to have more of a
general approach towards determining the ideal
angle. All but one of the bike fitting studios have one
of these two which are within a 2° range between the
two riders. However, there is no studio which
simultaneously has both of them within the 2° range.
So, there is little consensus within the bike fitting
studios as to what the ideal angles are in upper body,
and even less between them. This was also mentioned
in the hypothesis, however in contradiction to the
hypothesis, the recreational rider is in a more
aggressive position than the professional rider.
Lower Body:
Firstly, when comparing KOPS measurements for the
different cyclists within the same studio, three studios
fall within the acceptable error margin for both
cyclists (1 mm). Secondly, for heel angles not only
the left and right differences are compared but also
the average of left and right maximal heel angles. The
comparison for each side individually shows large
differences between and within studios. This can be
due to reduced flexibility in the right ankle of rider X,
because he broke his ankle in the past and this is still
visible when observing the cycling motion. This
injury background was also observed during field
tests using data of a double-sided power meter
(Shimano Dura-Ace R9100-P). Advanced power
statistics show Left-Right power balances which are
far off (around 55/45) and are reporting higher
pedaling smoothness for the left side. Therefore, left
and right heel angles averages were calculated and
analyzed. This results in five studios which offer a
heel angle within a range of 2° for the different
cyclists. Lastly, with regard to knee angles, three of
the examined studios have a knee angle difference
smaller than 3° between both cyclists for both the left
and right maximal knee angle. And if the average of
maximal left and right knee angle is considered, there
are even four studios within the 2° margin. To
conclude, heel angles and knee angles do not differ
much, when comparing the two cyclists within the
same bike fitting studio for at least four of the nine
studios. But when comparing the studios to one
another, the differences are often quite large.
3.2.3 In-depth Analysis for Each Test Person
In this chapter the different configurations, advised
by the bikefit studios for each cyclist, are compared
to one another.
Test Person X – Pro Cyclist:
For the pro cyclist, the average maximal knee angle
is 148.27°. These are larger angles than expected,
even five studios are above 149° and three out of
those five are above 150°. The difference between
highest and lowest maximal knee angle is 9.7°, so
there is no real consensus for knee angles between
fitting studios for the pro cyclist. The average left heel
angle over the different studios is -0.67° which is to
be expected, although the difference between the
highest and lowest heel angle is 8° so no real
consensus exists. The right heel angle is a much
different story as our test person had a limited
flexibility in his right ankle due to a previous injury.
The average angle was 8.22° with a difference of 5°,
it can be concluded that the limited flexibility does
not allow this person to fully flex his ankle which
results in a higher angle. For KOPS, the average
between the studios was 2.17 cm and the differences
were again quite large between studios with a
maximal difference of 4 cm. The highest KOPS value
is 4 cm which is considered to put a lot of stress on
the knee joint. As previously mentioned, the upper
body positioning is quite personal, the average back
angle is 38.87°, the average pelvic tilt is 2.08° and the
average shoulder angle is 79.30°. Again, there are
quite big differences in these angles, but this is largely
due to one specific outlier. Without this outlier there
still exist differences of 2.2°, 5.9° and 4.2°
respectively. Concerning symmetry and stability,
there were no significant differences between the fits.
This is probably due to the rider’s better ability to
adapt to these changes in configuration in comparison
with the recreational rider. Conclusive for this chapter
it is important to note that there is little to no
consensus between the individual bikefitters. As will
also be confirmed by the analysis of the recreational
cyclist.
Test Person Y – Recreational Cyclist:
For the recreational cyclist, the maximal knee angle
averaged over the different studios is 148.12°. This is
quite large, even four configurations led to knee
angles of over 149°. The difference between the
The Need for Data-driven Bike Fitting: Data Study of Subjective Expert Fitting
187

highest and lowest maximal knee angle is 9.7° and is
a direct consequence of the large difference in saddle
height between these configurations (2.2 cm) and
saddle setback (1.8 cm). For heel angles, differences
of 9° and 11° are present for left and right respectively
between different studios. This is the consequence of
the lower flexibility that is allowed in different
configurations. Also, and in correspondence with our
previous test person, the KOPS measurements show
differences of 3 cm, with an average KOPS of 1.76
cm in the different configurations. The high value for
KOPS can pose problems for the cyclist on the longer
run, as this will put more stress on the patella and can
result to knee overuse injuries. The upper body is, as
mentioned before, a rather personal preference and in
this case a direct result of saddle position adjustments.
This is due to the fact that none of the fitters advised
another stem length for this cyclist. It should be
mentioned that large maximal differences existed
between the fits (3.4 cm in saddle setback and 3 cm
in saddle height). There were some studios which
advised a similar saddle height or saddle setback, but
no studios advised similar saddle height and setback
simultaneously. However, these configurations are
harder to compare as there was also no consensus in
the cleat positioning, in contrast with person X by
whom the cleats were positioned the same by every
bike fitter. This can be due to the different cleat
system; person X uses the Speedplay system which is
hard to adjust as opposed to person X who used
Shimano SPD-SL cleats which are easy adjustable.
Lastly, it is remarkable that this rider’s stability was
highly variable for the different configurations. In
only one particular end fit the rider was very stable on
his bike as opposed to the other fits. This fit is also
suggesting a position with the KOPS at 0 cm and the
advised knee angles of +- 145 degrees, which might
not be a coincidence.
4 CONCLUSIONS
The present study results indicate that the differences
in bike fit end position between fitting studios were
larger than expected. As it is often the case, the ideal
value for a bike fit measurement will be somewhere
in the middle of both extrema of the end fits. A
difference of 2 cm in saddle height or fore-aft position
of the saddle is certainly an adjustment that the rider
will be very aware of. When making these drastic
adjustments, the neuromuscular system will be
addressed and loaded completely different.
As there still are large differences between the
individual fitters, it certainly is important to focus on
a qualitative education. The general rules of thumb,
such as Knee Over Pedal Spindle (KOPS) for
example, should be well known to the fitters.
Additional scientific proof could be a trigger to use
these rules and make them part of the general bike
fitting procedure.
5 FUTURE WORK
Initial results show that there is indeed a broad range
in the advised positions by the different bike fitters.
However, before this research it was not clear that this
range would be this broad. There are various possible
explanations for this (i.e. used technologies,
experience level, education background, …). These
initials tests were done with a small group of subjects,
additional test persons could possibly empower our
findings. Still, even with this limited test group, it can
be concluded that the bike fitting industry is indeed
suffering from subjectivity.
Secondly, to analyze the different end fits, it
would be interesting to make use of other systems
apart from the Myontec Mbody and the Bioracer
Motion system. Firstly, torque analysis could be a
useful tool to analyze the pedaling motion. A perfect
pedaling motion will have a 50/50 right/left
distribution (and was shown to be not the case for our
pro rider), as well as a small dead point in the
revolution. With the use of torque analysis, it can also
be shown during which phase of the pedal revolution
the peak power is produced. Thirdly, in a good
cycling position the saddle pressure will be evenly
spread across the surface of the saddle with a
relatively low peak pressure. Saddle pressure
measurements were also executed by some fitting
studios which used the GeBiomized system.
Unfortunately, most of the saddle pressure results
were not collected in the actual reports, but only told
to the test persons during the fit.
A data-driven approach towards bike fitting has
already proven to be useful (Braeckevelt, et al.,
2018). Preliminary experiments focusing on saddle
height optimization have been conducted and prove
the feasibility of the proposed methodology. Saddle
height is a determining factor in knee injuries (Bini,
et al., 2011) and the outputted power (Peveler &
Green, 2011). However, it is important to mention
that saddle height optimization is only a small step in
the bigger bike fitting process, as there are many other
parameters that should be optimized (Gonzalez &
Hull, 1989).
icSPORTS 2019 - 7th International Conference on Sport Sciences Research and Technology Support
188

The proposed methodology for the saddle height
experiments was to compare three different bike
configurations (i.e., saddle too high, too low and the
'optimal' position) for different pairs of markers. An
example of these spatio-temporal comparisons is
shown in Figure 12. This graph shows the relation
between the crank angle speed and the right knee Z
speed over time. A good feature to track would be the
occurrence of the minimum with regard to the crank
angle. If the saddle is in a position that is too high, for
example, the minimum occurs at a particularly lesser
crank angle. Several similar additional features are
evaluated on the Bioracer Motion dataset to
determine the rate of true positives and false positives
for each of the features. The lesser false positives, the
higher the weight of this feature. In the end, a series
of eight features (focusing on the left/right foot and
knee movement in X/Y direction) are fed into a
weighted feature sum, based on which the saddle
height correction is suggested. This methodology
results in a 100% correct saddle height up to an
accuracy of 5mm for a test set of 40 fits.
Figure 12: Knee speed in function of the crank angle (in
degrees).
Lastly, research to prove or disprove some general
rules of thumb, that have been used for decades,
should be conducted. The rules have had a major
impact on some of the end fits and almost every bike
fitter uses at least one of those rules. When these can
be proven, and data-driven bike fitting is further
developed, a more objective manner of bike fitting
will be made possible. This might have a huge impact
on the current bike fitting landscape.
The final goal of our research is to have a fully
autonomous bike fitting system, which can fit a
cyclist with sufficient accuracy in a short period of
time. This system will have a significant impact on
the cycling world, as less knowledge will be required
to successfully fit cyclists. However, it should be
noted that competent bike fitters still play an
important role fitting the professional cyclists and
very specific clients, as well as to provide feedback
for the data-driven bike fitting system.
REFERENCES
Alta, V. d. W. et al., 2014. Non-traumatic injury profile of
amateur cyclists.. South African Journal of Sports
Medicine., Volume 24, pp. 119-122.
Bini, R., Patria, H. & Croft, J., 2011. Effects of Bicycle
Saddle Height on Knee Injury Risk and Cycling
Performance. Sports Medicine, Volume 41.
Braeckevelt, J., Verstockt, S. & Erik, W., 2018. Data
Driven Bike Fitting. Book of Abstracts - Science and
Engineering Conference on Sports Innovation, pp. 47-
49.
Burke, E. R., 2003. High-Tech Cycling. s.l.:s.n.
Burt, P., 2014. Bike Fit: Optimise Your Bike Position for
High Perforamce and Injury Avoidance. s.l.:
Bloomsbury.
Dierckx, J., 2019. Bioracer Motion (Mac version).
Tessenderlo
Garcia-Lopez, J. & Abal del Blanco, P., 2017. Kinematic
Analysis of Bicycle Pedalling using 2D and 3D Motion
Capture Systems. s.l.:s.n.
Gonzalez, H. & Hull, M., 1989. Multivariable optimization
of cycling biomechanics. Journal of biomechanics,
Volume 22, pp. 1151-1161.
Peveler, W. & Green, J., 2011. Effects of Saddle Height on
Economy and Anaerobic Power in Well-Trained
Cyclists.. Journal of strength and conditioning research.
Yeo, B. K. & Bonanno, D., 2014. The effect of foot orthoses
and in-shoe wedges during cycling: A systematic
review.. Journal of foot and ankle research., Volume 7,
p. 31.
The Need for Data-driven Bike Fitting: Data Study of Subjective Expert Fitting
189
