
Implementing Value-at-Risk and Expected Shortfall for Real Time
Risk Monitoring
Petra Ristau
JRC Capital Management & Research GmbH, Kurfürstendamm 186, 10707 Berlin, Germany
Keywords: Cloud Appliance, Financial Risk Measures, Value-at-Risk, Expected Shortfall, Monte-Carlo Simulations.
Abstract: Regulatory standards require financial service providers and banks to calculate certain risk figures, such as
Value at Risk (VaR) and Expected Shortfall (ES). If properly calculated, their formulas are based on a
Monte-Carlo simulation, which is computationally complex. This paper describes architecture and
development considerations of a use case building a demonstrator for a big data analytics cloud platform
developed in the project CloudDBAppliance (CDBA). The chosen approach will allow for real time risk
monitoring using cloud computing and a fast analytical processing platform and data base.
1 INTRODUCTION
The way Investment Banks monitor Market Risk is
rapidly changing both for complying with regulatory
requirements and for enhancing competitiveness. In
today’s lower return / higher risk business
environment, one of the main challenges in asset
management is to provide detailed risk information
in a timely manner, i.e. in real time. The goal of the
use case described in this paper is to overcome the
current practice of leaving the operational data in
external data bases of data providers and brokers and
downloading copies on a daily basis for off-line
batch evaluations. Instead, it shall support traders,
risk managers and sales who negotiate with the
customers in doing aggregations and calculations on
the fly and let them do what-if analysis over the live
operational data.
Modern risk calculation techniques used by
banking industry operate on different kinds of
simulated scenarios together with complex
mathematical modelling to evaluate the outcome of
those scenarios. In addition to marking-to-market
current trading positions, the vast majority of the
data are pricing simulations that compute the value
and the sensitivities of financial trades to market
changes. Results are being aggregated into measures
such as Value-At-Risk (VaR) and portfolio diversity
based on market correlation. All these evaluations
depend on calculations consisting of large scale
matrix-vector operations. Using traditional
approaches such as e.g. relational databases, these
processes can be very time consuming. Usually,
processing is done once a day, and thus depending
on past data, which obviously reduces its value for
the business and increases overall risk.
In addition, regulations require banks to be able
to do back-testing analysis in a timely manner over
the whole portfolio. This requires the ability to
effectively store, retrieve and aggregate billions of
returns done for each trade historically on a large
time scale. Existing solutions cannot cope with that
without significant delays and usually require a lot
of customization in each case, while regulators
expect banks to have flexible analysis frameworks.
The remainder of the paper is structured as
follows: The next chapter briefly explains the
needed calculation, section 3 deals with
requirements analysis while section 4 introduces the
platform architecture and section 5 presents
conclusions.
2 EXPLANATION OF THE
CALCULATION
Value at risk is a risk measure, that can be calculated
for any type of financial instrument that has a liquid
enough market price. We will focus on the VaR
calculation of a portfolio of capital market products
such as stocks and bonds. VaR is determined by two
parameters, a time interval and a confidence level. A
Ristau, P.
Implementing Value-at-Risk and Expected Shortfall for Real Time Risk Monitoring.
DOI: 10.5220/0008318704590464
In Proceedings of the 8th International Conference on Data Science, Technology and Applications (DATA 2019), pages 459-464
ISBN: 978-989-758-377-3
Copyright
c
2019 by SCITEPRESS – Science and Technology Publications, Lda. All rights reserved
459

t-day, x-per cent VaR figure would be interpreted as
the maximum loss for an x% confidence level that
will not be breached within the next t days.
Translated into regular language that would mean
that
𝑉𝑎𝑅
10𝑑,99.9%
= 72%
would be interpreted such as “I am 99.9% confident
that my portfolio will not drop more that 72% in
value within the next ten days”.
In order to calculate this figure, the risk manager
needs to calculate the multivariate distribution of the
entire portfolio’s daily returns. This is dependent on
(a) the portfolio’s instruments weight (b) their risk-
return profile (expected return and return variance)
and (c) their correlation. According to modern
portfolio theory (Elton et.al., 2014), the cross-
correlations between financial product’s prices have
a big effect on the entire portfolio value. This is why
investment professionals try to diversify risk by
including uncorrelated or even negatively correlated
instruments into their portfolio.
Each statistic is calculated using the standard
formula that can be found in every statistician’s
textbook. Partly represented as a number, partly
represented by a matrix, these figures are put
together so that a joint or multivariate return
distribution can be estimated. This is the return
distribution of the portfolio.
Next, the risk manager needs to proceed with the
Monte-Carlo simulation, which is a simulation of
future returns of the portfolio in this case. Deducted
from the multivariate distribution, the risk manager
randomly generates future return scenarios of length
t. These can be summed up to yield a portfolio return
over the t-day future. Repeating this simulation n-
times yields a distribution of portfolio returns after t-
days. The x% confidence level of the VaR
calculation can be deducted looking for the x% one-
sided quantile of the overall return distribution. This
return figure is the VaR figure (see figure 1). VaR is
technically a percentile of the loss distribution
(Krokhmal, Palmquist, Uryasev, 2001) of an asset.
The ES is the simple average (the expectation
value) of all simulated returns that are below the x%
quantile.
3 REQUIREMENTS ANALYSIS
The Real-time Risk Monitoring for Investment
Banking use case implements a risk assessment and
monitoring application that does, on the one hand,
comply with regulatory requirements of the financial
supervisory authorities, and on the other hand,
speeds up the risk valuation so that it can be used
intraday not only for regularly or ad-hoc queries, but
even for pre-trade analysis of potentially new trades
before the traders actually give the order.
The usage of the system is role based:
Risk Controllers have access to all use cases, i.e. the
calculation of risk measures (VaR and ES) as well as
the corresponding sensitivities. The pre-trade
analysis may be triggered by both, Risk Controllers
and Traders who just detected an investment
opportunity and have to assess portfolio risk as a
what-if scenario, as if the new trade was already
carried out.
Figure 1: VaR as a quantile of return distribution.
3.1 Input and Output Streams
The basis for every risk evaluation is the trade
history, consisting of past closed positions and
currently open positions, in combination with the
history of market price data. The result is a time
series of returns of the portfolio, the return vector (or
PnL vector), that will serve as input for the variance-
covariance matrix and finally, for the correlation
matrix.
What-if-Analysis requires as input a potential
new trade, that a trader may wish to add to the
portfolio. In order to provide also pre-trade analysis,
the trader may enter the position he/she may intend
to enter and the system will evaluate the changes of
risk measures that would be caused by this
additional trade.
On the output side we receive the risk measures
VaR and ES for the current portfolio together with
their sensitivities to a range of parameters.
In case that a pre-trade analysis was triggered,
the output will consist of the newly calculated risk
ADITCA 2019 - Special Session on Appliances for Data-Intensive and Time Critical Applications
460
measures VaR and ES for the expanded portfolio
(what-if-scenario VaR).
The sequence of operations is rather
straightforward. From the login of the risk controller
or trader up to the calculation of the VaR and ES
risk measures as a single figure or as a diagram of
historical values.
4 PLATFORM ARCHITECTURE
In the real-time risk monitoring use case, the aim
was to develop a solution, capable of highly non-
linear financial risk computation on large portfolios
of trades, changing in real-time (new trades coming
in, what-if scenarios, etc.). The goal is to utilize in-
memory capabilities of the solution to avoid
expensive brute-force re-computations and make it
possible to both, compute risk measures much faster
but also to allow marginal computations of risk for
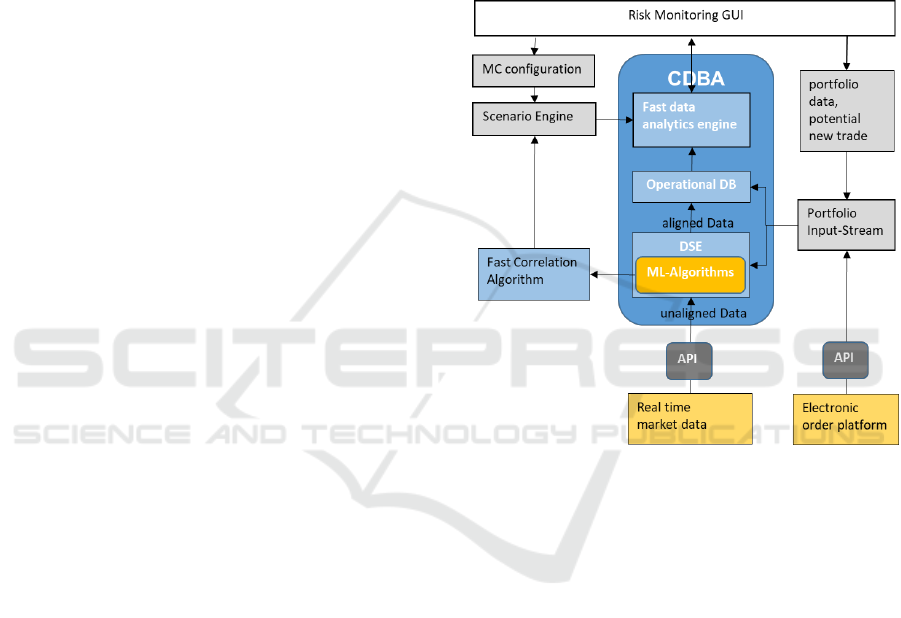
new incoming transactions. The risk monitoring
application is designed to use fast analytical and
streaming processing capabilities of third-party
systems, i.e. the Big Data Analytics Engine, the
Operational DB and the Streaming Analytics Engine
shown in figure 2 below.
Two major streams of input data from external
sources supply the application with data:
Real-time market data, a high frequency data
stream of financial price data for stocks,
bonds, futures, currencies, etc. as offered by
numerous third-party data providers like
Bloomberg, ThomsonReuters, or Metastock.
Portfolio input stream, consisting of trades
list from the electronic order platform,
portfolio data and single new trades for
What-if-analysis.
Concerning the second type of input, the trade
history, we can distinguish between order data and
portfolio data. The order data consists of all trades
and can be derived via an API directly from the
electronic order platform. Each broker offers a
dedicated order platform where traders enter the new
trades that are then instantaneously forwarded to the
accounts held by the broker. The portfolio Data is
entered by the risk manager directly from the GUI
and contains information about the asset allocation
of the portfolio, but also potential new trades entered
for the pre-trade analysis. For creating the Portfolio
Input-Steam, the trades have to be evaluated and the
list of current assets contained in the portfolio is
being created and passed to both, the DSE (where it
serves for filtering only those streams related to the
current portfolio) and the Operational DB where it is
stored.
In contrast to the real-time market data
Application Programming Interface (API), the
interface to the order platform is not time critical
since the frequency with which new orders arrive
depends on the size of the institute, its number of
clients and Assets under Management (AUM).
However, the frequency is by far lower than the
market data update. Therefore, no streaming engine
support is needed here.
Figure 2: Use case architecture and data flow.
The Parameter Input-Stream is fed from the GUI
and contains all parameters for the scenario
generation that usually remain fixed, but might be
subject to change in the case that the risk controller
needs to make adjustments.
The first data source, the real time market data,
connect to the Data Streaming Engine (DSE) via a
dedicated API. The task of the streaming engine is to
filter only those assets that are contained in the
current portfolio and to align all incoming data into
streams with synchronous time stamps (e.g. on 1
second basis). This is a prerequisite for the
calculation of the variance-covariance matrix. The
DSE forwards the (aligned) real-time data (prices
and returns) to the Operational Database (DB) on the
one hand, where it is immediately passed through
into the Fast data Analytics Engine. The return
vectors, on the other hand, are forwarded to one of
the integrated Machine Learning Algorithms, i.e. the
fast correlation detection algorithm. The fast
Implementing Value-at-Risk and Expected Shortfall for Real Time Risk Monitoring
461

Analytics Engine can be configured via a GUI where
also the results are presented to the user.
Finally, the configuration of the scenario engine
and the data analytics engine is done via the GUI,
that also receives outputs for presenting them to the
user.
4.1 Scenario Engine
Scenario analysis is the systematic investigation of
the impact of different sets of model inputs on key
model outputs, where no analytical results are
available. The scenario engine is responsible for the
generation of parameterised simulations where each
set of input parameters defines one scenario. As
input, the scenario engine takes the correlation
matrix generated by the CDBA fast correlation
algorithm and derives from it the distributional
properties. Each scenario represents one possible
future development of market returns. Therefore, the
scenario engine uses randomly generated values for
uncertain variables and runs Monte Carlo
simulations on these values. The outputs of the
scenario engine are a huge number of return vectors,
one for each simulation run. These are loaded into
the analytics platform in order to be further
processed.
5 INTEGRATION WITH THE
CDBA PLATFORM
This section describes the usage of the core
components of the CDBA platform in the real time
risk monitoring use case.
5.1 Integration with the DSE
The usage of the DSE in this use case is threefold.
5.1.1 Data Synchronization
Since one of the main tasks of the fast correlation
detection algorithm is the generation of correlation
matrices, the input data streams of market data have
to be synchronized (aligned). We made the decision
to use a pulsing based on a one second level, but
also larger data compression intervals are possible
and usual (e.g. 1-minute, or 5-minutes). The task of
the streaming engine is to summarize several market
prices of the same time series arriving within the
same second by building an average value on the
one hand and to enter placeholder prices by
repeating the last observed data, in case there are
gaps of more than a second length.
5.1.2 Calculation of Returns
In addition to aligning the price itself, the DSE has
to calculate the returns as well, i.e. the relative
changes of two subsequent price data of the same
instrument. This is the recommended practice in
financial data analysis, i.e. correlation analysis. In
contrast to the raw market price data, return time
series have other, more desired statistical properties.
In particular, they are stationary, meaning that e.g.
their mean and variance do not depend on the
previous time series element. Therefore, the input to
the correlation detection algorithm consists of return
vectors instead of price vectors.
5.1.3 Alarm Generation
The third task of the DSE is to trigger a (complete or
incremental) recalculation of risk measures in the
case of unexpected large market moves. For this
purpose, the DSE monitors incoming market data,
whether predefined ranges are being kept and
generates an alarm in the case of breaches. However,
instead of fixed numeric values, the thresholds have
to be dynamic and they have to adapt to the
fluctuations of market prices and shall only be
triggered, if there are significant peaks or drops.
Therefore, they have to be updated in real time as
well. As a realization, we build a channel around the
market prices by adding/subtracting e.g. 2 standard
deviations.
If a price for a certain symbol arrives, that lies
outside the range, the DSE sends an alarm that is
stored in an extra table in the data base. The alarm
automatically triggers a recalculation of the risk
measures. The configuration of the thresholds in
terms of the factor of standard deviations is done via
the GUI.
In a final step, an API complying with the FIX
protocol is being built to connect a real time data
feed to the streaming engine. FIX stands for
Financial Information eXchange and is an open
standard for the exchange of information between
banks, brokers, stock exchanges and service
providers. In particular, we use the byte oriented
binary coding FAST (FIX Adapted for STreaming)
since it is more appropriate for high frequency data
streams.
ADITCA 2019 - Special Session on Appliances for Data-Intensive and Time Critical Applications
462

5.2 Integration with the Operational
Data Base
The operational data is used for storing the existing
data histories of market prices as well as the newly
incoming market data from the data feed. In
addition, it stores the return values calculated by the
DSE as the percentage change from one price value
to the next. These data are passed directly from the
DSE. Hence, each record of market data consists of
4 attributes:
(symbol_ID, time_stamp, price,
return),
where symbol_ID is the provider specific identifier
for the trading instrument, e.g. 6-letter representation
in the case of currencies (as e.g. EURUSD,
USDJPY, etc.), time_stamp is a numeric value for
Unix time, price and return are both of type double.
On the other hand, trade data are stored in the
data base. These consist of lists of order data,
indicating time stamped buy or sell information:
(symbol_ID, time_stamp, price,
amount|position size, buy|sell)
The final data to be stored are the lists of current
assets, just being the time stamped list of symbol
IDs of the assets contained in the portfolio at a
certain time.
(time_stamp, symbol_ID
1
, …
symbol_ID
n
)
5.3 Integration with ML Algorithms
The correlation discovery algorithm is being used
for building the correlation-matrix. The decisive
requirement for the CDBA project is real-time
computation. For the calculation of VaR one of the
computationally most complex steps is the
calculation of the variance-covariance matrix and/or
the correlation matrix respectively. In this use case
the time series correlation discovery algorithm will
be used to set up the correlation matrix through
pairwise measuring of correlations of all return
vectors corresponding to all assets in the portfolio.
As a precondition for the matrix setup, the time
series have to be synchronised. We agreed to
synchronise all of the time series on a 1-second
basis. This is done by the DSE as described
previously. This means, that in the most frequent
update case this computationally intensive
calculation is repeated every second, over the length
of the time window that is shifted every second by
one. This way, the window always contains the most
recent data. The sliding length is the frequency of
updates (here one second as pseudo real time).
The computational complexity, of course, will
depend on the size of the portfolio, i.e. the number
of different assets contained therein. Therefore, for
large portfolios, the preferred mode of deployment
may be based on the trigger alarm of the DSE and a
re-calculation of the correlation matrix only
performed in case of an alarm, or on user request,
e.g. for a what-if-scenario as pre-trade analysis.
5.4 Fast Analytics Engine
Since the financial sector, i.e. risk management is
one of the main application areas of the fast
analytics engine, there exists already support for this
use case on several levels. In particular, there is an
open source project available for the calculation of
VaR, that was taken and expanded to the needs of
the use case.
The VaR project receives the P&L vectors as
generated by the scenario engine and calculates the
VaR risk measure that is then returned to the GUI.
The analysis has been expanded by the ES
calculation that is based on the same set of
scenarios.
5.5 Usage
The use case application is configured and the risk
assessment run from a central GUI.
The log in dialog offers two roles for users,
distinguishing between trader and risk controller.
While the trader can only enter one or several
(potential) new trades and then push the “VaR-
button”, the risk controller is also able to enter or
change parameters such as confidence level, sliding
window length, number of scenarios to be generated,
training sample length and forecasting period length.
6 CONCLUSION
The presented risk monitoring use case is a data-
intensive application in a critical infrastructure. It
does not require many different functionalities, but
focusses on a central aspect in the daily risk
management procedures of banks and financial
institutes.
The challenge of the application lies in the
computational complexity of the calculation of the
risk measures. This is where it exploits the
Implementing Value-at-Risk and Expected Shortfall for Real Time Risk Monitoring
463

capabilities of the underlying existing big data and
streaming analytics platforms.
The chosen architecture design is kept modular
and will allow for the replacement of single
components, either on the side of data base or
analytical platform, but also with respect to the data
sources like a change of the real time market data
provider or of the electronic order platform by
simply replacing the interface. This will keep the
design sustainable and open for future extensions of
requirements and functionalities.
ACKNOWLEDGEMENTS
This project has received funding from the European
Union’s Horizon 2020 research and innovation
programme under grant agreement No. 732051. The
authors acknowledge consortium members’ support
in the described work and efforts in the
implementation of the platform components.
REFERENCES
Elton, E., Gruber, M., Brown, S., Goetzmann, W.
“Modern Portfolio Theory and Investment Analysis”,
9
th
ed., Wiley, 2014
Krokhmal, P., Palmquist, J., Uryasev, S., “Portfolio
Optimization with conditional Value-at-Risk
Objective and Constraints”, 2001
ADITCA 2019 - Special Session on Appliances for Data-Intensive and Time Critical Applications
464
