
Exercise Testing of Elite Rowers: Comparison of Methods and
Protocols
Kamiliia Mekhdieva
a
, Anna Zakharova
b
and Varvara Timokhina
c
Institute of Physical Education, Sports and Youth Policy, Ural Federal University named after the first President of Russia
B.N. Yeltsin, 19 Mira Street, Yekaterinburg, Russia
Keywords: Exercise Testing, Elite Athletes, Rowers, VO
2max
, Testing Methods and Protocols.
Abstract: The aim of the study was to search for appropriate, informative, accessible and reproducible method for testing
of elite rowers. Six healthy elite rowers (5 male and 1 female) aged 24±7 underwent two types of exercise
testing (ET). Exercise performance of rowers was evaluated by means of: i) standard maximal RAMP cycle
test, which is considered to be the gold standard measurement in sports medicine; ii) ET specific for rowers
with the use of Concept rowing machine. Both protocols of ET were designed according to International
Guidelines for Exercise Testing and Prescription Tests were conducted with simultaneously HR monitoring
(Garmin) and breath-by-breathe gas-exchange analysis with the use of desktop metabolic analyzer Fitmate
PRO (Cosmed, Italy). A range of physiologic parameters were under consideration: VO
2
, HR, attained power,
minute ventilation and anaerobic threshold (AT). Undertaken comparative analysis demonstrated no
significant differences in major analysed physiologic parameters during both tests. The obtained data enabled
us to conclude that cycling ET with the use of maximal ramp incremental protocol is an informative,
accessible, reproducible and appropriate method for testing of elite rowers. Conducting both exercise tests ̶
cycling and rowing ̶ may highlight the limiting factors of specific physical workability in rowers.
1 INTRODUCTION
Exercise testing (ET) in sport, especially in high
performance sports, is an integral part of training
process (Smith, 2003; Saw, 2016; Vilikus, 2012). The
range of ET application is quite broad: from sports
selection and search for potential future champions to
evaluation of dynamics and progress in training.
Data obtained from ET provides with valuable
information on various physiologic changes under
exercise load condition (Maxzzani, 2017). It allows to
assess the integrative exercise responses of
cardiopulmonary, neuropsychological and skeletal
muscle systems (Albouaini, 2007). Methods of ET
depend much on a range of important factors. Among
them: i) sports specifics; ii) athletes age, level and
gender; iii) available laboratory equipment and many
others. Currently, various types of protocols, load
machines and measurement devices are used to assess
aerobic performance in athletes (Foster, 2001). The
preference of method selection is in close connection
a
https://orcid.org/0000-0003-2967-2655
b
https://orcid.org/0000-0002-8170-2316
c
https://orcid.org/0000-0003-3239-5038
to the aim and information request. In particular,
sometimes incremental step protocols are used,
though, in many cases maximal RAMP protocols are
more reliable. As for the choice of load device type
much depends on the cost and laboratory space limit.
Generally, it is recommended to test elite athletes
specifically to get correct and reliable data.
Meanwhile it is essential to always keep in mind the
significant difference in biomechanics of movements
in the real field and modeled laboratory environment
(Nymark, 2005).
The proposed research was focused on search for
informative, accessible, reproductible and
appropriate method for testing of elite rowers.
2 ORGANIZATION AND
METHODS
Subjects: Six healthy elite rowers (5 male and 1 fe-
Mekhdieva, K., Zakharova, A. and Timokhina, V.
Exercise Testing of Elite Rowers: Comparison of Methods and Protocols.
DOI: 10.5220/0008166900970102
In Proceedings of the 7th International Conference on Sport Sciences Research and Technology Support (icSPORTS 2019), pages 97-102
ISBN: 978-989-758-383-4
Copyright
c
2019 by SCITEPRESS – Science and Technology Publications, Lda. All rights reserved
97

male) aged 24±7 were recruited for the study. All
participants of the proposed research had more than
10 years of sports experience. Three of studied rowers
were members of national team, winners of a number
of international competitions. Each athlete gave a
written consent to participate in the study with
following data collection and further publication of
the obtained results before the experimental study
was undertaken. The work conforms to the principles
of WHO Helsinki Declaration.
The proposed study was conducted in the sports
research lab of Ural Federal University
(Yekaterinburg, Russia).
2.1 Anthropometric Measurements
Anthropometric measurements are of high
importance in elite sports. Such parameters as
detailed body composition, height, lean muscle mass
(absolute and relative values), body fat component
and BMI are commonly used both in sports selection,
as well as dynamics evaluation in training practice
and research.
Weight and detailed segment body composition
data were measured with the use of MC-980MA Plus
Multi Frequency Segmental Body Composition
Monitor (TANITA, Japan) based on the advanced
Bioelectric Impedance Analysis (BIA) technology.
The following parameters were analyzed: body mass
(kg), body mass index (BMI, kg/m
2
), muscle mass –
absolute and relative values (kg; %), absolute and
relative fat mass (kg; %), fat free mass (kg),
differentiated muscle mass of the trunk, upper and
lower extremities (kg).
2.2 Exercise Tests
Aerobic performance of rowers was evaluated by
means of ET with the use of two different types of
protocols and load devices. First, we conducted
standard maximal RAMP cycling test, which is
considered to be the gold standard measurement of
integrated cardiopulmonary-muscle oxidative
function (Poole, 2017). Then we applied ET specific
for rowers with the use of Concept rowing machine.
Protocols of ET were designed according to
International Guidelines for Exercise Testing and
Prescription (Pescatello, 2014; Gibbons, 2006;
Wasserman, 2012). Tests were conducted with
simultaneously HR monitoring (Garmin) and gas-
exchange evaluation with the use of desktop
metabolic analyzer Fitmate PRO (Cosmed, Italy).
Both tests were completed within a period of 1
week approximately at the same time of the day in a
controlled laboratory environment (temperature – 20-
22 ͦ C; 50%-60% relative air humidity). These
conditions were kept to minimize the biological
variations on the collected data. As both tests were
performed at maximal protocol to exhaustion, athletes
were recommended to have 24-36 hours of rest from
trainings and competitive activity before the first test
and 24-48 hours of rest between the tests. This
implied sufficient time for recovery and obtaining
accurate and precise data. Additionally, it was
required to avoid any intake of alcohol or caffeine 24
hours before ET and to have meal uptake no later than
4 hours before the test to exclude unexpected
hypoglycemia during ET.
Each tested subject was given comprehensive
instructions on purpose of the experiment, methods
used, registered parameters during ET and safety
regulations before the tests. Athletes were encouraged
to inform laboratory staff about appearance of any
disturbance and such symptoms as acute weakness,
shortness of breath, dizziness etc.
Breath-by-breath oxygen uptake (VO
2
) data were
analyzed throughout both conducted tests. Before
each test started the metabolic analyzer had been
accurately calibrated according to manufacturer’s
guidelines and instructions.
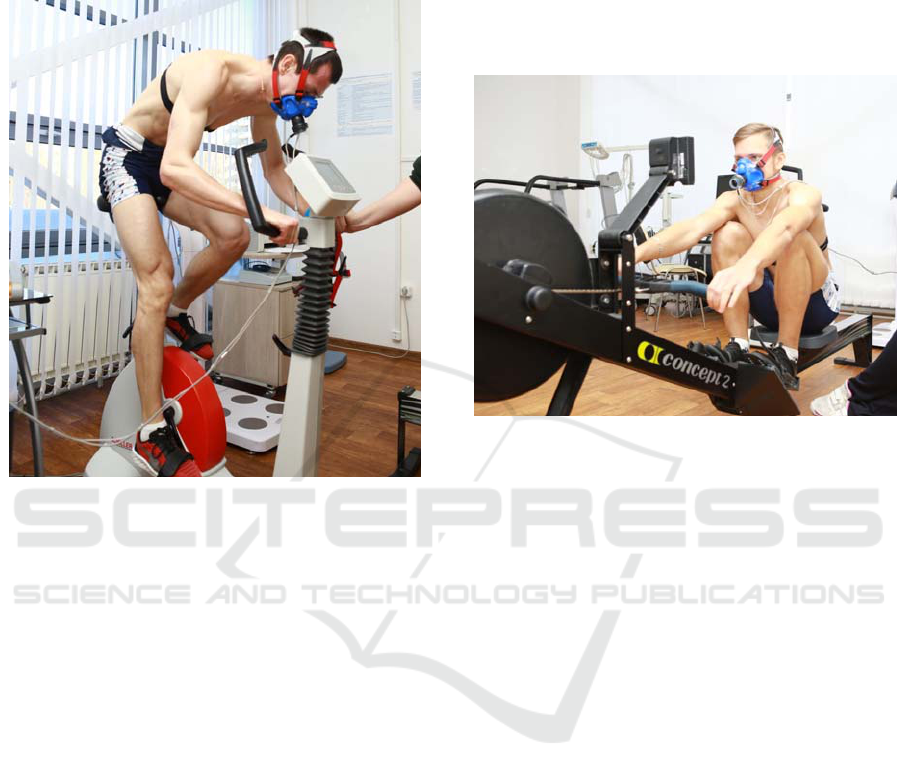
2.2.1 Cycling Exercise Test
Cycling ET (Fig.1) was performed with the use of
cycle ergometer (Schiller, Switzerland) and desktop
metabolograph Fitmate PRO (Cosmed, Italy). The
cycle seat and handle height and position were
adjusted in accordance with the each athlete’s
comfort (height and limbs length).
The following maximal ramp-incremental
protocol was applied: the initial load (warm-up stage)
was set at 0 W for 1 min with further linearly steady
increase by 40 W per minute (approximately 1 W per
each consecutive 1.5 second of the test). Athletes
were instructed to keep the constant cadence of 80
rpm throughout the whole test, including the warm-
up stage and the 1
st
min of recovery.
The test was carried out to exhaustion (inability to
maintain the required cadence due to muscle fatigue
despite verbal inciting) or the appearance of absolute
medical restrictions to continuing exercise (abnormal
HR response, shortness of breath, dizziness, signs of
vegetative dysfunction etc.).
The following parameters were recorded starting
with the first warm-up stage (1 min) and continuously
during exercise testing: oxygen consumption (VO
2
,
ml/kg/min), heart rate (HR, bpm), stated exercise load
(P, W), volume of ventilation (Ve, l/min), and
icSPORTS 2019 - 7th International Conference on Sport Sciences Research and Technology Support
98
respiration rate (Rf, 1/min). Current values of all
measured parameters were displayed on the
metabolic analyzer screen and saved in the device
memory for ongoing analysis.
Figure 1: ET with the use of cycle ergometer.
2.2.2 Rowing Exercise Test
The proposed rowing ET (Fig. 2) was carried out with
the use of Concept rowing machine (model E,
Concept 2, USA) and desktop metabolograph Fitmate
PRO (Cosmed, Italy). We designed step incremental
ET protocol for rowers. The duration of each stage
was 1 min. Initial load was set by the athlete himself
at 100 W. After that it was suggested to increase the
load by 50 W each subsequent minute of the test. Test
proceeded up to attainment of refusal criteria and
inability to keep on at the required power for the
current ET stage.
As described in the previous section (cycling test),
we analysed oxygen consumption (VO
2
, ml/kg/min),
heart rate (HR, bpm), power of exercise load (P, W),
volume of ventilation (Ve, l/min), and respiration rate
(Rf, 1/min).
After completion of both ET trials we recorded the
following parameters: maximum oxygen
consumption (VO
2max
, ml/kg/min), maximum
respiration rate (Rf
max
, 1/min), maximum volume of
ventilation per minute (Ve
max
, l/min), resting heart
rate (HR before the test, bpm), HR at 150 W of work
load (HR
150
, bpm), HR at 200 W of work load (HR
200
,
bpm), HR at 300 W of work load (HR
300
, bpm),
maximum HR at the end of the test (HR
max
, bpm), HR
at anaerobic threshold (HR
AT
, bpm), HR at the 1
st
, 2
nd
and 3
rd
minutes of recovery (HR
recovery 1 min
, HR
recovery
2 min
, HR
recovery 3 min
, bpm), percentage of VO
2
at
anaerobic threshold (% AT), maximum attained
power (P
max
, W) and relative maximum attained
power (P
max
/kg, W/kg).
Figure 2: ET with the use of Concept rowing machine.
2.3 Statistical Analysis
Statistical analysis was performed with the use of
statistic software package “SPSS Statistics 23.0”
(IBM). We used descriptive analysis of the obtained
data in order to estimate basic functional status of
athletes.
Normality of distribution was assessed by the
Shapiro-Wilk test. Mean value (M), standard
deviation (SD), minimum and maximal values of the
measured parameters were calculated.
Paired T-test (Student criterion) was used to
evaluate differences between the measured
parameters in studied group. The level of significance
was set at P < 0.05.
3 RESULTS AND DISCUSSIONS
The obtained anthropometric data of elite male
rowers (Table 1) showed that studied subjects had
adequate body composition in regards to specific
athletic norms for rowers. Although, high mean
values of lean mass and low values of fat component
were found, these parameters varied within a certain
range. These pointed at individual peculiarities of
skeletal muscle compounds of rowers, thus it may
have an impact on ET results.
Exercise Testing of Elite Rowers: Comparison of Methods and Protocols
99
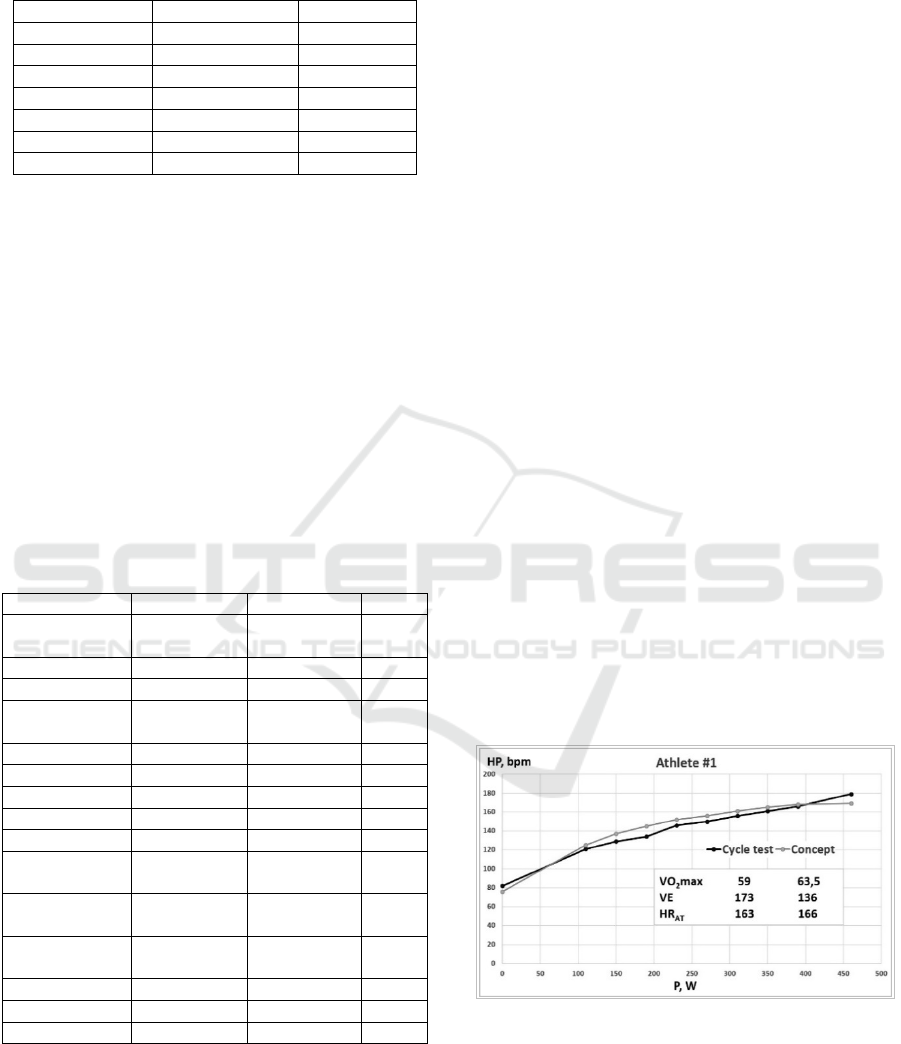
Table 1: Anthropometric and body composition data of male
rowers.
Parameters M±SD (min-max)
Height, c
m
179.6±7.4 171-188
Weight, kg 72.36±5.2 60-74
Muscle mass, k
g
63.86
±
2.85 59-66.5
Muscle mass, % 88.24
±
3.34 83.4-92.6
Fat, k
g
5.2
±
2.3 2.2-8.4
Fat, % 7.2
±
3.24 3-11.8
BMI, kg/
m
2
22.5±1.9 20.3-24.7
Assessment of exercise performance of studied
athletes provided with comprehensive data on both
aerobic performance and cardiopulmonary response to
maximum load, as well as strength endurance of
musculoskeletal system.
Generally, each athlete demonstrated high level of
exercise performance and was well tolerated to aerobic
work in both tests.
As was described above it was assumed that ET in
specific test could have shown better results
considering impact of motivation on performing very
hard exercise work.
However, undertaken further comparative analysis
(Table 2) demonstrated no significant differences in all
analysed parameters from both tests.
Table 2: Comparative analysis of ET data in rowers.
Parameters C
y
cle test Conce
p
t test P
VO
2max
,
ml/kg/min
59.5±11.03 64.8±7.1 0.17
Rf
max
, 1/min 63.24±7.77 56.44±17.97 0.23
Ve
max
, l/min 168.9±23.5 126.78±67.5 0.11
HR before the
test, bp
m
88.6±17.86 72.7±17.9 0.09
HR
150,
bp
m 135.7±17.1 130.83±15.84 0.31
HR
200,
bp
m 143±17.27 146±16.35 0.38
HR
300,
bp
m 165.2±10 168.3±10.9 0.32
HR
max,
b
p
m
181.2±5.42 177.5±6.69 0.16
HR
AT,
b
pm 172±7.35 172.8±9.15 0.43
HR
recovery 1 min
,
bp
m
155.3±4.63 133.3±44.15 0.13
HR
recovery 2 min
,
bp
m
127.5±5.5 132.8±10.5 0.16
HR
recovery 3 min
,
b
pm
119.4±5.8 124.5±6.36 0.18
% AT 83±4.05 82.5±3.11 0.42
P
max
, W 40.3±61.64 429.5±76.96 0.28
P
max
/k
g
, W/k
g
5.75±0.5 6.01±0.74 0.19
VO
2max
– maximum oxygen uptake; HR – heart rate; AT –
anaerobic threshold; P
max
– maximum power.
Although the group of rowers was mixed –formed
of male and female athletes, undertaken paired
comparative analysis for statistics was appropriate
and correct in this case.
Values of the majority of the most important
functional indicators which are milestones in training
design (HR
AT
, % AT) were very close.
Further analysis of individual graphs (Fig. 1-6) of
HR dynamics during stress test revealed no
significant differences of heart response to exercise
load irrespective to type of ergometer and protocol
used.
Nevertheless, when analyzing individual HR-
curves we should take into account the following
issues:
1. In rowing ET the movement pattern is specific
for the tested subjects, whereas cycling is not
widely used in severe Urals weather conditions.
2. In cycling test the value of maximal attained P (P
at VO
2max
) in ET was determined as an indicator
of strength of lower extremities. As each athlete
was instructed to maintain the constant cadence
of 80 rpm throughout the test whereas the
external load was raised continuously, so the
moment of volitional fatigue (when leg muscles
were not able to maintain the required cadence)
was considered as the maximal power
(P-VO
2max
). So P
max
in cycling ET was limited by
strength of lower extremities together with an
oxidative potential of muscles.
3. Procedure of specific rowing ET implied the
following: every step with demanding load was
provided by internal strength and rowing rate. In
case of limited strength the rower had an
opportunity to increase the stroke frequency.
These means that higher P
max
in rowing ET could
be provided by the rate of strokes rather than
higher volume of working muscle mass.
Figure 3: Heart rate response during ET of the 1
st
athlete.
Individual HR graph of the 1
st
athlete (Fig. 3) is a
good example of similar heart response to exercise
load irrespective of type of ergometer and protocol
used. One can see that only respiratory system
response (maximal minute ventilation) differed.
icSPORTS 2019 - 7th International Conference on Sport Sciences Research and Technology Support
100
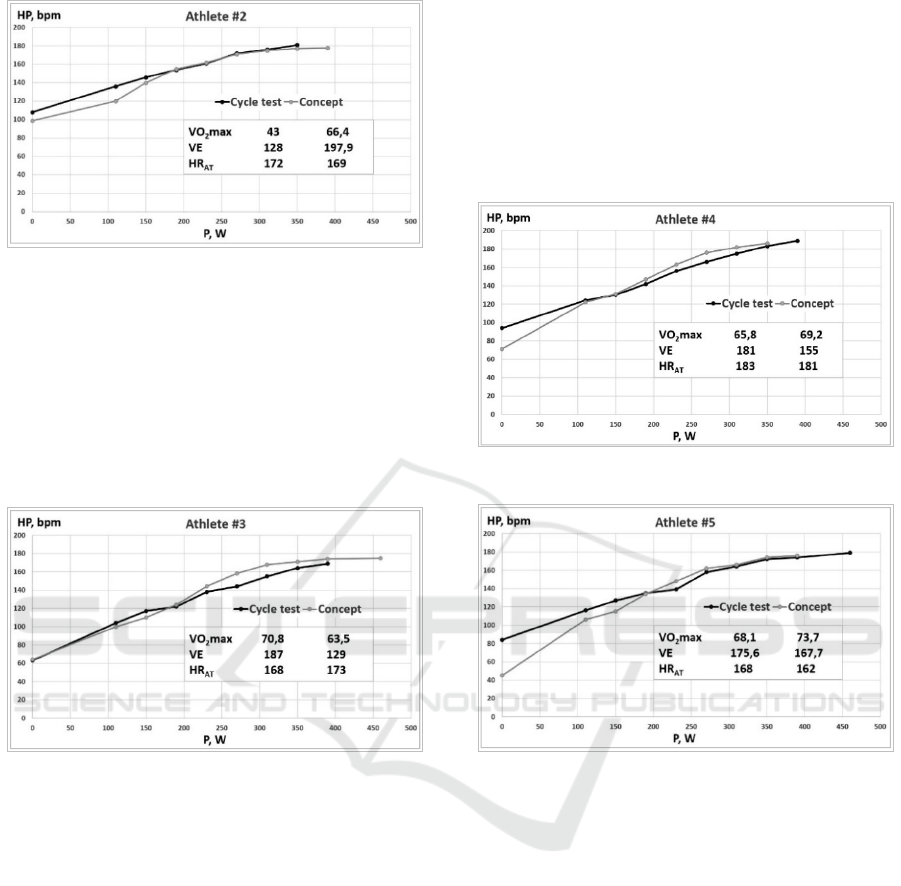
Figure 4: Heart rate response during ET of the 2
nd
athlete.
2
nd
rower (Fig. 4) started both tests at high HR
(HR
resting
> 100 bpm), which points at lowered volume
parameters of heart for endurance athletes and low
aerobic abilities. High values of VO
2max
(66.4
ml/kg/min) in rowing ET and low – in cycle ET (43
ml/kg/min) serve as a proof of essential further work
for both increasing of strength and endurance of
lower extremities muscles.
Figure 5: Heart rate response during ET of the 3
rd
athlete.
3
rd
athlete (Fig. 5) had low resting HR value in the
beginning of both tests (60 bpm) and throughout the
first minutes of ET due to important for successful
rowers sufficient heart volume parameters. The
observed data in cycling ET pointed at good condition
of leg muscles. Meanwhile, difference in VO
2max
value of 7.3 ml/kg/min in tests showed the importance
of additional trainings of upper extremities and back
muscles (increasing the rate of rowing with only arms
and back without legs involvement). Additionally, the
obtained difference in respiration (significant lower
Ve in rowing ET) could have had an impact of
insufficient breathing in rowing test on VO
2max
results.
Data of the 4
th
rower (Fig.6) revealed a
considerable difference in HR in aerobic exercise
zone. Potentially, increased HR during cycling ET
could be a result of agitation or incomplete recovery.
After 100 W of load increase HR curves match, which
does not enable to state insufficient training
condition. Comparison of P
max
in tests demonstrated
higher level of P in cycling, than in rowing ET. The
reasons could be: i) weak muscles of back and upper
extremities; ii) issues with frequency increase in
rowing test due to lowered speed abilities or inability
to increase the rate of single motion (rowing); iii)
rowing technique incompetence.
Figure 6: Heart rate response during ET of the 4
th
athlete.
Figure 7: Heart rate response during ET of the 5
th
athlete.
The curves “load ̶ HR” of the athlete 5 (Fig.7) in
two tests are very similar to the 4
th
rower’s graphs.
This means that rowers 4 and 5 had identic problems
in specific physical readiness. So their training must
be focused on the same aspects (i-iii).
Rower #6 (female) demonstrated satisfactory
levels of fitness competence in both tests and specific
rowing ET was done efficiently. Comparison of two
curves did not reveal problems although physiologic
coping in both tests is lower than in male athletes.
Overall obtained results indicate, that although the
attained load and absolute values of the measured
parameters varied in tests, in most cases
cardiovascular response to exercise load had no
significant differences. This may serve as a proof that
no matter what type of exercise activity, engaging
more than 2/3 of skeletal muscle, is carried out, it does
not impact significantly on cardiopulmonary
physiologic reaction.
Exercise Testing of Elite Rowers: Comparison of Methods and Protocols
101
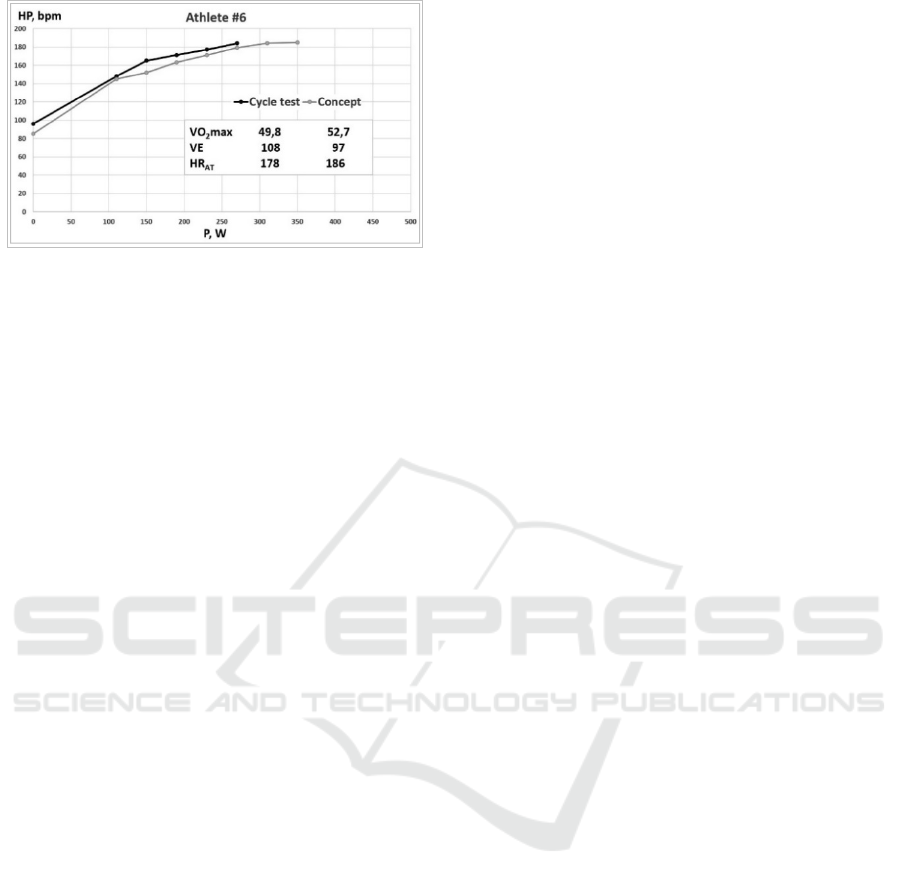
Figure 8: Heart rate response during ET of the 6
th
athlete.
4 CONCLUSIONS
Cycling ET with the use of maximal ramp
incremental protocol is an informative, accessible,
reproducible and appropriate method for testing of
elite rowers. It is safe, cost-effective and has the same
patterns of physiologic response as in specific rowing
test.
Meanwhile conducting both exercise tests ̶
cycling and rowing ̶ provide the researchers with
valuable information highlighting the limiting factors
of specific physical workability in rowers.
ACKNOWLEDGEMENTS
The work was supported by Act 211 Government of
the Russian Federation, contract # 02.A03.21.0006.
REFERENCES
Albouaini, K., Egred, M., Alahmar, A., Wright, D.J., 2007.
Cardiopulmonary exercise testing and its application.
Postgrad Med J, 83, 675-682.
Foster, C., Florhaug, J.A., Franklin, J., Gottschall, L.,
Hrovatin, L.A., Parker, S., Doleshal, P., Dodge, C.,
2001. A new approach to monitoring exercise testing.
Journal of Strength & Conditioning Research, 15, 109–
115.
Gibbons, R.J. et al. 2006. ACC / AHA 2002 guideline
update for exercise testing: summary article: a report of
the American College of Cardiology / American Heart
Association Task Force on Practice Guidelines. Journal
of American College of Cardiology, 48(8), 1731 p.
Mazzani, A., 2017. Cardiopulmonary Exercise Testing:
Basics of Methodology and Measurements. Ann Am
Thorac Soc, 14(1), 3–11.
Nymark, J.R., Balmer, S.J., Melis, E.H., Lemaire, E.D.,
Millar, S., 2005. Electromyographic and kinematic
nondisabled gait differences at extremely slow
overground and treadmill walking speeds. Journal of
Rehabilitation Research and Development, 42(4), 523-
534.
Pescatello, L.S., Arena, R., Riebe, D., Thompson, P.D.,
Kluwer, W., 2014. ACSM’s Guidelines for Exercise
Testing and Prescription. 9th Ed. Lippincott Williams
& Wilkins, Philadelphia, PA. 456.
Poole, D.C., Jones, A.M., 2017. Measurement of the
maximum oxtgen uptake VO
2max
:VO
2peak
is no longer
acceptable. J Appl Physiol, 122, 997-1002.
Saw, A.E., Main, L.C., Gastin, P.B., 2016. Monitoring the
athlete training response: subjective self-reported
measures trump commonly used objective measures: a
systematic review. Br J Sports Med, 50(5), 281-91.
DOI: 10.1136/bjsports-2015-094758.
Smith, D.J., 2003. A framework for understanding the
training process leading to elite performance. Sports
Med, 33(15), 1103-26.
Vilikus, Z., 2012. Functional Diagnostics. College of
Physical Education and Sport, Palestra, 12-15.
Wasserman, K., Hansen, J.E., Sue, D.Y., Stringer, W.W.,
Whipp, B.J. 2012. Measurements during integrative
cardiopulmonary exercise testing. Principles of
exercise testing and interpretation: including
pathophysiology and clinical applications, 5th ed.
Philadelphia, PA: Lippincott Williams & Wilkins, 71–
106.
icSPORTS 2019 - 7th International Conference on Sport Sciences Research and Technology Support
102
