
Apparel Concept Design for Analysing Range of Motion at the Hip to
Prevent Injury
B. Land, C. Morgan and R. S. Gordon
a
Faculty of Computing Engineering and Science, University of South Wales, Treforest, Pontypridd, CF37 1DL, U.K.
Keywords: Gait Analysis, Athletic Performance Apparel, Injury Detection, Real Time Injury Diagnosis, Range of Motion,
Hip Joint, Intra-articular, Extra-articular.
Abstract: Range of Motion (RoM) testing can identify the underlying causes of an athlete’s pain at the hip, be it
muscular (extra-articular) or damage to the joint itself (intra-articular). The purpose of this study was to design
a device which could detect characteristics of hip injuries from the motions and forces applied to the joint.
Hence supplying a coach with a method to analyse and diagnose injuries in real time. A design to measure
the RoM and gait at the hip was developed and later manufactured for testing on recreational athletes. Findings
supported the device in its potential to identify gait events and competitive motion at the hip, despite the
accuracy measuring less than that of the two-degree accuracy of the goniometer, competitive performance
analysis within the study is evidence of a conceptual design. With development, apparel such as ours has the
potential to supplement a coach’s quantitative analysis, identifying responsible motions and performance
metrics at hip responsible for injuries at the joint and the lower limbs using correlative data between motion
and the onset of injuries.
1 INTRODUCTION
The hip joint plays a central role in an athlete’s
performance across many sports, however, its
condition is often overlooked. In a study into
collegiate athlete hip and groin injuries, Kerbel et al.
(2018) found the hip to be a common location of
injury, accounting for 6% of all athletic injuries.
Because the synovial joint at the hip assists in all
movement below the waist, it is subject to some of the
most intensive demands of the body during exercise.
As a result, damage to the hip can risk an athlete’s
performance, or their career.
Mcgurran (2017) depicts how athletes find their
self-worth derived from their performance, and how
they would tend to endure the immediate pain of
injury, ignoring many serious injuries, particularly at
the hip, for substantial periods of time. With a
majority of hip injuries originating during adolecence
Siebenrock et al. (2011) suggests young high-level
athletes increase their risk of injury when subjecting
the hip to repeated high stresses and directional
loading while the skeleton is still developing.
a
https://orcid.org/0000-0003-1419-2771
An athlete’s fear of injury has shaped training
programmes to strengthen and protect the most
vulnerable areas on the body. Consequently attempting
to prevent injuries, fitness evaluations have become
common practice in all sports from a young age, as
coaches seek to identify potential areas of weakness.
Relevent theory is based upon correlations identified
between physical chara-cteristics and performance, for
example, poor flexibility. Noonan and Garrett (1999)
describe how a ‘weak, stiff’ muscle will significantly
inhibit its energy-absorbing capabilities, increasing its
susceptibility to strain injury. These fitness evaluation
tests however are not discipline specific and are not
always reflective of an unpredictable competitive
scenario.
In the event of an injury whilst competing,
evaluation is performed retrospectively, this becomes
an issue when related to the hip and lower limbs.
Misdiagnosis, due to the complex composition of the
hip and lower limbs, has become extremely common.
To better our understanding of the capability/
demands of the body, there has been an increase in
performance monitoring technology, identifying
patterns and trends for a coaches interpretation.
64
Land, B., Morgan, C. and Gordon, R.
Apparel Concept Design for Analysing Range of Motion at the Hip to Prevent Injury.
DOI: 10.5220/0008165600640075
In Proceedings of the 7th International Conference on Sport Sciences Research and Technology Support (icSPORTS 2019), pages 64-75
ISBN: 978-989-758-383-4
Copyright
c
2019 by SCITEPRESS – Science and Technology Publications, Lda. All rights reserved

Although vitals can be measured with relative ease,
the physical demands on the joints, particularly at the
hip, remain in the realm of theory. Consulting with
Williams (2018) for his expertise on lower extremity
injuries, he stated that there was no way to measure
RoM at the hip in a competitive scenario. Such
information would prove insightful for a coach’s
consideration in preparing an athletes training, to best
prepare the athletes body for the demands they face in
competition. Clearly, the analysis of the RoM has the
potential to aid in the diagnosis of intra/extra-articular
injuries and performance analysis of the hip.
Supporting an athlete’s pursuit of greater
performance and reduced absence time due to injury.
2 LITERATURE REVIEW
2.1 Athletes’ Approach to Hip Injuries
After a single week of inactivity an athlete can begin
to experience muscular atrophy, and with an
anticipated 6-8 week break in the event of a serious
hip injury, these are feared amongst athletes due to
the potential career setbacks.
In the analysis of injuries, it is unreliable to use
anecdotal reports to indicate injury patterns, because
of the number of external risk factors which may
influence an injury mechanism. Whilst in more
detailed studies additional independent factors can be
considered, initial consideration begins with the
broader picture of incidence rates, requiring a definite
distinction between competitive and training
scenarios. Although the two at times may overlap,
they require different demands which can influence
the likelihood of injury. Hootman et al. (2007)
investigated over one million young athletes between
1988 and 2004 covering a range of sports. The
findings support the premise that competitive
situations exhibit a greater risk of injury.
There remains no universally adopted definitions
for classifying injuries in competitive scenarios,
typically varying in classification by the depth and
focus of study. For example, in papers such as Cloke
et al. (2010), ‘non-contact’ refers to an athlete’s
injury mechanism when an opponent is not physically
interfering with play.
2.2 Musculoskeletal Analysis of Hip
Injuries
Most hip injuries share overlapping symptoms, often
resulting in a vague diagnoses in the absence of an
experienced professional. As such the design should
be able to assist in supporting a clinical diagnosis of
a hip injury and identification of the onset of
symptoms.
The Kerbel et al. (2018) study into the
epidemiology of hip and groin injuries, reports
muscular injuries as the most common. Whilst this
may be the case, the more severe injuries are intra-
articular, with damage or deformities to the skeletal
system carrying a longer absence. These are the more
feared injuries at the hip. They explain that intra-
articular injuries only become symptomatic after a
significant period, leaving substantial damage in their
wake. Intra-articular injuries often require surgery to
rectify and achieve a timely return to participation.
Thus, research conducted in the early identification of
correlations of intra-articular injuries is becoming
highly valued.
If properly utilized, simple tests such as
identifying the RoM of the hip can narrow the list of
possible injuries. For example, the Siebenrock et al.
(2011) investigation into femoroacetabular
impingement in adolescents, uses the premise that a
decreased internal rotation indicates a ‘structural
abnormality’ as the underlying cause. RoM testing
however not limited to the identification of intra-
articular injuries. Neumann (2010) describes how
reduced motions at the hip might suggest damage to
those muscles responsible however, the composition
of the muscles in the region of the hip make
identifying a single damaged muscle difficult. Byrd
(2007) claims that differencing the onset of pain
between active and passive motion of the hip can
identify the intra/extra-articular nature of the injury.
Should the injury be extra-articular, specific motions
of the hip can be used to further narrow down the
nature of the injury.
2.3 Clinical Measurement of the Hip
Manual handheld goniometry is both a low cost and
simple procedure, making measurements highly
accessible and easy for physiotherapy clinics. Yet, it
is suggested that inaccuracies in the traditional
method of measuring the hip’s RoM remain, making
hip injuries difficult to correlate and compare.
(Yazdifar et al., 2013). Here, repeatability errors in
traditional methods, compared with more
contemporary video tracking methods have been
reported. Still neither method allows for an easy
method of performance comparison between athletes.
Elson and Aspinall (2008) identify the ‘neutral’
position of the pelvis additionally to be a key issue.
Claiming that when lying prone, the posture of the
Apparel Concept Design for Analysing Range of Motion at the Hip to Prevent Injury
65

pelvis is altered with respect to its position to the
couch plane. Because both the pelvis and femur can
move relative to one another it is imperative that
measurement of the positional relation of both in a
competitive scenario is taken.
2.4 Technology of Performance Data
Acquisition
Fahrenberg (1997) suggests that the use of a
piezoresistive accelerometer could help to distinguish
between the postures and motions of test subjects, and
ultimately, he concludes that such an approach is
viable. However, he notes that the lack of any
universal standardized guidelines for the positioning
of such sensors prevents cross-laboratory
comparisons between athletes.
Analysis of the human walking/running pattern in
phases can directly identify the functional
significance of the different motions generated at the
individual joints. Tao (2012) explains this in the
breakdown of the eight stages in a walking pattern, as
the sequential motion completes three tasks; ‘weight
acceptance, single limb support and limb
advancement’. It is suggested that gait phases may
each be detected by identifying the orientations of the
leg segments at any one time, with the use of angular
rate data derived from a gyroscopic sensor. Meaning
our design should be capable of identifying the stages
and characteristics of the individual’s gait cycle so
that together with the RoM data and force readings
sound conclusions may be drawn as to the motion of
the lower body in high velocity competitive
scenarios. This data then paired with additional
external analysis could help to build a better
understanding of the demands of the lower limbs
performing certain motions.
3 DESIGN
3.1 Femur Movement
The design proposed and discussed herein uses an
accelerometer to measure the RoM at the hip. In the
same way the RoM measures femur rotation away
from a midline designated from an initial stationary
stance, an accelerometer can measure the independent
inclination of each axis away from its initial position.
By attaching an accelerometer to the upper leg, it is
expected that the angle through which the leg turns
and hence the angle through which the femur rotates
within the acetabulum may be measured. This
accelerometer may, thus, measuring flexion,
extension, internal and external rotation as well as
abduction and adduction.
Concerning the selection of a sensor for the
design, an accelerometer was deemed most suitable.
Firstly because of its linear relationship with
changing temperature. The minimal linear
acceleration and zero-g deviation sensitivity of the
sensor when under varying temperatures, suggests a
change in body temperature, due to muscle exertion
or change in environment will minimally impact our
data accuracy in comparison to other sensors.
A smaller power supply would also be beneficial
for the design, reducing unnecessary weight and hence
reducing the likelihood that the design may interfere
with the performance of the athlete. The power
consumption of the accelerometer is significantly
lower than its counterparts, making it the favoured
sensor to minimize the power supply in the design.
Furthermore, noting all sensors are subject to
unwanted influence imbedded in the device’s nature.
The raw accelerometer data is also likely to suffer
from noise due to mechanical vibrations and
calibration errors. However, accelerometer errors do
not diverge with time and can be handled effectively;
a stark contrast to a gyroscope which when subject to
sudden movement will result in large drift errors.
Because of the capability to constructively handle the
errors which may arise from accelerometers, the
design of a sole accelerometer inertial measurement
unit would seem most promising for the design.
Alongside the exact orientation of the
accelerometer, the ability to determine what phase of
the gait cycle the hip is in, such as whether the leg is
planted or free, will aid in our understanding of
motion at the hip. This understanding can be achieved
using the vertical acceleration profile measured by the
accelerometer.
Further important considerations relate the
frequency domain characteristics of the
accelerometer, and associated data collection
hardware and software. It is necessary to tailor the
dynamics of the measurement system to extract
accurate, meaningful data, whilst rejecting sources of
noise and ensuring aliasing is not a factor. Seeing to
at least match the accuracy of a goniometer the
system must be capable of measuring a Minimal
Detectable Change (MDC) of at least 2⁰ . It is noted
that many previous studies such as Turcot et al.
(2008), used sensors with a sampling rate of 100Hz
and this can be deemed the minimum requirement for
the sensor to begin testing.
icSPORTS 2019 - 7th International Conference on Sport Sciences Research and Technology Support
66

3.2 Sensor Location
For the location of the sensor on the upper leg, it was
important to locate the sensor in a position where it
will experience minimal movement because of
muscle contractions during dynamic motion. This is
to be found along the anterior of the upper leg on the
Vastus Lateralis as described by Backhouse (No
date). Tong and Granat (1999) noted that provided the
sensor remains along the line of the landmarks the
sensor reading will be replicable (Figure 1), and
hence independent of the user. Potentially initiating a
standardised methodological approach for cross-
comparison experiments. For ease of positioning, the
sensor will be located at the lower end of the upper
leg towards the knee, and in line with the Lateral
Epicondyle, thus following the clinical positioning of
the goniometer. Similar to that of Turcot’s (2008)
experimental positioning when investigating
Osteoarthritis patients.
Figure 1: Vastus Lateralis in the Sagittal Plane and the
Dotted Line indicating where Tong and Granet (1999)
suggests the same experimental data from the
accelerometer is obtained. (Muscolino 2018).
3.3 Pelvic Movement
In the same way that the femur moves from its datum,
so too will the pelvis from its datum (Elson and
Aspinall, 2008), particularly in vigorous dynamic
motion. The pelvis has a natural inclination known as
pelvic tilt that needs to be measured statically prior to
dynamic measurements, and accounted for in
subsequent processing. However, pelvic tilt in the
sagittal plane can be determined by measuring the
angle between a line intersecting the ASIS and PSIS
landmarks, and the horizontal (Transverse) plane.
Whilst, in the Coronal Plane, a line between the two
ASIS landmarks across the pelvis, compared to the
transverse plane indicates the natural pelvic tilt.
Measuring the rotation of the pelvis using the change
in inclination of the gravity vector from its initial
stationary reading will yield the change in pelvic
angle relative to all three-axes, allowing for full 360-
degree monitoring of the pelvis. Because of the
compression shorts ability to secure the sensor close
to the skin, an additional accelerometer located
between the PSIS landmarks on the back will
minimise the adverse effects on performance,
locating the sensor weight close to the centre of
gravity of the human body, least influencing
performance.
3.4 Gait Analysis
Although not the focus of this study, accelerometers
can measure a range of performance metrics. The
likes of gait metrics (e.g. cadence, stride length and
forces through the leg) can complement the RoM
data, indicating the position of the leg and weight
distribution through the stride and across the lower
body, as indicated by research such as Turcot et al.
(2008). In addition, future developments may see the
range of recording metrics expand further with the
growing capabilities to interpret the recorded data.
3.5 Accelerometer
The accelerometer used is the Adafruit MMA8451
breakout. Its relatively small size facilitates the
sensors’ positioning for concept evaluation. The
Adafruit supported Arduino software is readily
adaptable to the manipulation of the sensor readings
for exporting in a convenient format. The time-stamp
of each reading will be marked in milliseconds due to
the 9.6kHz sensor refresh rate, later being converted
to a more traditional unit. For concept evaluation, an
SD card was used to record the delimited data and
provide a means of importing the data into Matlab for
processing.
4 METHODOLOGY
4.1 Participants
Prospective athletes were contacted and given an
information letter outlining the investigation’s aims,
testing protocol and hence the requirements of their
participation. Recreational athletes participating in
Football, American Football and Running
participated in the testing, and provided informed
written consent prior to testing and also completed a
brief survey to determine limb dominance and
Apparel Concept Design for Analysing Range of Motion at the Hip to Prevent Injury
67

suitability screening. Screening criteria for
participants included:
No previous serious hip injury or defect
known within the last 12 weeks so not to
indicate significant injury
Injury-free status at the time of testing
(Absence from training for no more than
the preceding three weeks, currently full
participation in training and/or not
recovering from participation in vigorous
exercise performed prior to testing.)
Remained injury free for the duration of the
testing
Screening criteria was performed to ensure healthy
participants in order to capture data under conditions
of full uninhibited performance. All participants met
these criteria. Participants were asked to supply their
own sportswear to wear over the shorts to create a
traditional environment for regular performance
analysis. The footwear of each participant were also
recorded because of their capacity to affect the
elasticity of the forefoot region, changing contact
time and propulsive force with intensity.
4.2 Study Overview
RoM testing was performed in accordance with the
clinical specifications after participants performed a
warm up of their choosing with which they are
familiar and comfortable. Participants were
individually examined over a period of three days and
underwent dynamic testing individually. A total of
three participants were selected (3 Male) (age = 24.3
± 3.39 years, stature = 181.19 ± 7.62 cm, mass =
78.167 ± 6.8 kg, Body Mass Index (BMI): 24.45 ± 2.3
kg/m
2
) as this was deemed a suitable sample size for
proof of concept.
4.3 Testing Protocol
Participants wore instrumented compression shorts in
a size which they personally deemed comfortable,
and were adjusted so the midline of the elasticated
waist band aligned with the ASIS and PSIS
landmarks. These landmarks, as well as the greater
trochanter and lateral epicondyle midline, were also
scribed with a marker pen on the outside of the
compression shorts for reference. The shorts were
then returned for amending and stitching of the
accelerometers in line with the reference markings.
The accelerometers were stitched securely in position
and the control unit (Arduino) was secured between
the PSIS landmarks for dynamic testing by securing
the unit to an adjustable GoPro strap.
4.4 Procedure
The same pair of running shoes were worn by each
participant for all tests, preventing changes in limb
kinematic data during running and running economy.
All participants wore low rise running shorts to avoid
interference with the sensors above the compression
shorts. Tests were conducted indoors so that the
environmental conditions varied minimally. Running
surface conditions were dry and clear of interfering
debris. Accelerometers were calibrated prior to fitting
on the participants.
4.5 Anthropometric Data
Factors such as body composition, anatomy and
injury history can all predispose an athlete to risk of
injury, consequently, basic anthropometric data was
acquired prior to testing. Anthropometric data were
taken in an isolated first aid room, preceding the RoM
tests to correlate any plausible phenomena that may
compromise the results. A wall mounted tape
measure (GIMA 27335) and electronic scales
(Etekcity 4074s) were used to measure stature and
mass (±0.1cm and ±0.1kg respectively). The upper
leg circumference was measured using a fabric tape
measure around the point the accelerometer is
attached ±1mm. The anthropometric data gathered
here, was interpreted in excel to obtain averages and
bounds for the participants.
4.6 Clinical RoM Testing
As discussed in section 2, the static RoM at the hip
was measured using a goniometer (IDASS 12”
Goniometer) to the nearest degree for the base
reference readings. These were compared to the
sensor readings to verify the accuracy in the design’s
RoM measurements. An examination bench was used
to perform the stationary RoM tests and care was
taken to observe whether any soft tissue around the
hip restricted the motion of the joint below its full
range. Both dynamic and passive measurements were
taken, once without the shorts on, and again with the
shorts on, to provide a baseline the RoM readings.
Participants were constantly spoken to throughout the
tests to clearly define the requirements from the
participant.
icSPORTS 2019 - 7th International Conference on Sport Sciences Research and Technology Support
68
4.7 Treadmill – Gait Analysis
To compare the design’s capability in measuring
basic gait characteristics, treadmill (LifeFitness
9500HR) running at a constant pace was used. A 25 s
run at a comfortable continuous pace was selected to
replicate similar testing methods performed by Turcot
(2008). The participants were given as much time as
necessary to become accustomed to the pace before
testing commenced. They were then required to walk
for 30s before increasing the belt speed to their fastest
comfortable pace. Sensor positions were checked
before and after each repetition to ensure constant
functionality and that they remained in line with the
reference landmarks. The data collected here is used
to analyse the subject’s gait and compare with
published results hence, validating the design’s
performance. This comparison will confirm a
working model prior to the addition of further
programmes of activity allowing the collection of
further data. This validation comes in the form of the
tracing of Y-Axis acceleration in Matlab and
comparing the data to that of experiments conducted
in similar research ventures of gait analysis.
Participants were required to rest for two minutes
between all repetitions.
4.8 Shuttle Runs – Isolated Change in
Direction
As no identifiable research methods look to analyse
the more dynamic performance metrics, testing began
with one of the simpler movements. Performing 10x,
10m shuttle runs at a comfortable pace, looking to
isolate a basic 180-degree turn. The 10m line was
marked using electrical tape to prevent the participant
slipping on any foreign object whilst performing. The
data will be reviewed alongside frame by frame slow-
motion footage for time references (120fps, GoPro
Hero 5). The camera remained stationary throughout
the entirety of the testing, although the participant’s
velocity caused them to occasionally turn outside of
frame.
4.9 Illinois Agility Test – Unpredictable
Hip Movement
This test looks to recreate the RoM in a more
competitive scenario. Being initially unaware of the
kind of data the sensors might capture; this test was
more intended as a scope to the future developments
of the design. The test can be found commonly
performed as part of a fitness evaluation, measuring
agility and so recreates a basic athletic scenario where
the subject is competing against a stopwatch. The data
is predicted to be noisy however, will give us our first
insight into the type of data obtained in a competitive
scenario.
4.10 Data Analysis
All data captured was run through Matlab Software,
identifying the acceleration values for each axis and
the subsequent inclination angles of the sensor and
hence the femur and back orientations. The process of
the Matlab software is as explained in the Design
Section previously.
5 RESULTS
5.1 Gait Characteristics - Treadmill
Due to time restraints any filtering and manipulation
of data was minimal. Only a moving average filter
was applied due to its ease and ability to remove much
of the unwarranted noise.
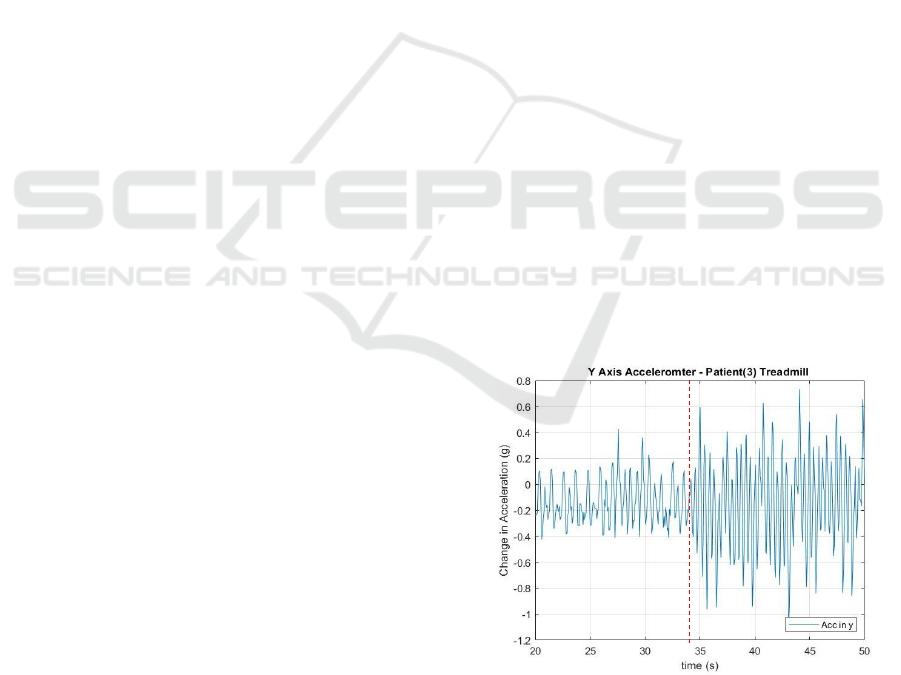
From processing the Y-Axis Acceleration, it is
possible to visualise the gait cycle of each participant
in each test. In the increase in acceleration of the
treadmill, the consequential increase in stride length
and intensity shows a visible increase. This
observation was most noticeable in Participant 3’s Y-
Acceleration graph shown in Figure 2, by the sharp
increase in amplitudes when the pace increased
before and after the red line at 34s.
Figure 2: Participant 3 – Treadmill Leg Accelerometer - Y-
Axis Acceleration Plot (5km/h ->> 9km/h).
The increased acceleration values indicate a
greater force moving through the leg as the
participant looks to increase his stride velocity and
Apparel Concept Design for Analysing Range of Motion at the Hip to Prevent Injury
69
cadence to coincide with the belt’s increased velocity
from 5km/h to 9km/h.
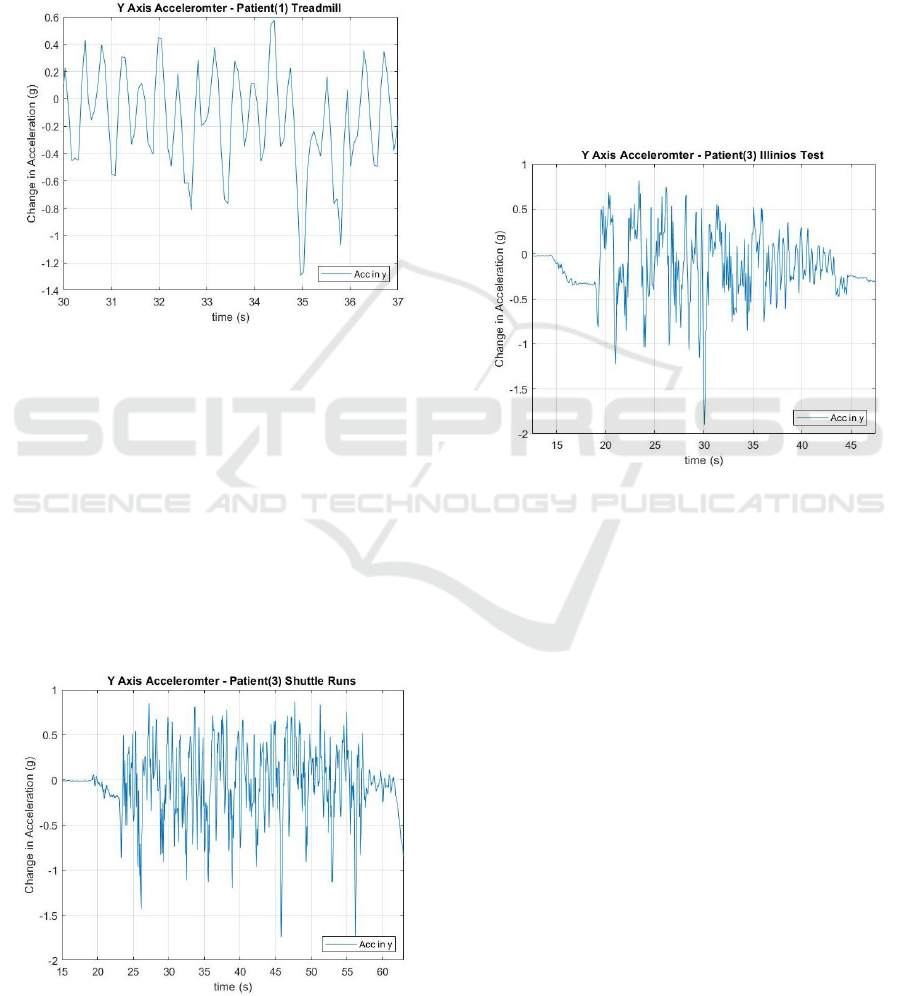
Figure 3 presents a more detailed view of the
participants running strides. Exhibiting the type of
wave that would be expected prior to interpretation
using 3
rd
party software for the analysis of further gait
characteristics i.e. toe off, heel contact and cadence
etc.
Figure 3: Participant 1 – Treadmill Leg Accelerometer - Y-
Axis Acceleration Plot, Showing a zoomed in look at the
stride pattern whilst at 9km/h.
5.2 Gait Characteristics – Shuttle Runs
Like the Treadmill Y-Acceleration graphs, it is
possible to identify a stride pattern and external
events, however the addition of the changing of the
stride has made the interpretation of the data more
difficult. Aligning the video with the data, shows each
of the negative peaks to be the increased force
experienced through the leg whilst changing
direction, each of the 10 times shown in Figure 4.
Figure 4: Participant 3 – Shuttle Run Leg Accelerometer -
Y-Axis Acceleration Plot.
Participant 3 performed the test the fastest and
exhibited more defined peaks when changing
direction suggesting that the increased peak definition
comes because of an increased force through the leg
whilst changing direction, implying Participant 3 to
be more agile than Participant’s 1 and 2.
5.3 Gait Characteristics – Illinois
Agility Test
The added change in direction with the agility test
makes the data harder to interpret. Participant 3
completed the test fastest in 16.77s, and their resultant
data makes for clear reading in Figure 5.
Figure 5: Participant 3 –Agility Test Leg Accelerometer -
Y-Axis Acceleration Plot.
The decrease in stride length between the initial
straights and corners when the participant decelerates,
is signified by the increased frequency and lower
negative acceleration peaks. Whilst the sharp positive
peaks indicate a lengthen in stride as the participant
drives the knee higher to accelerate as quickly as
possible along the straights to gain speed.
5.4 RoM against Goniometer
Flexion and extension data proved promising for
initial testing, carrying differences of 3.9º, -17.8º and
-5.0º for each Participant respectively. The limit of
maximum motion was held for an unspecified amount
of time to allow a plateau to generate in the sensor
data, enabling the angle of the hip to be clearly
identified, as shown in participant 1’s flexion
measurement in figure 6.
icSPORTS 2019 - 7th International Conference on Sport Sciences Research and Technology Support
70
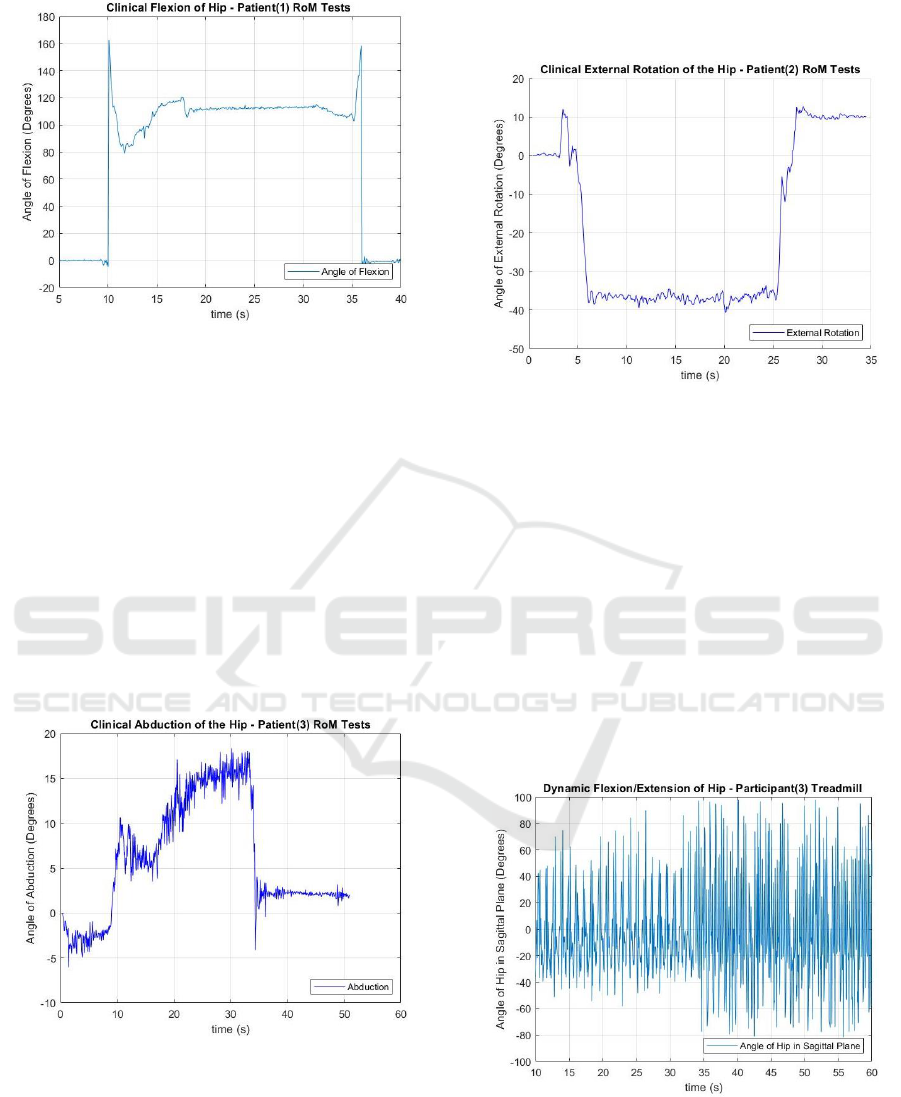
Figure 6: Participant 1 – Static Flexion of the Hip.
Contrastingly sagittal plane motion proved very
poor. Examples of this came in the measurements of
participants 2 and 3 abduction and adduction
measurements (Figure 7).
The adduction measured from participant 3’s data,
exhibited a 33.00% difference from the goniometer
measurement while abduction heralds a higher
percentage difference of -57.00%. A high noise is
also noteworthy in the data, which is believed to
originate from the sensors high operating frequency
when the individual holds an uncomfortable hip
position at the maximum RoM limit resulting in the
recording of minor oscillations as the body tenses so
to hold the unnatural position.
Figure 7: Participant 3 - Static Abduction the hip.
Internal and external rotation for participants 2
and 3 exhibited the same inconsistencies and
inaccuracies. With participant 2’s graphs (Figure 8)
showing the plateau at angles greater than that
measured for internal rotation (+22.86%), whilst
external rotation seemed reasonably accurate
(+15.625%) compared to other internal and external
rotation measurements in comparison.
Figure 8: Participant 2 – Static External Rotation of the Hip.
5.5 Dynamic RoM Analysis
When performing dynamic tests, similar phenomena
to that in the gait and static RoM measurements were
identified. This is expected as the two naturally
coincide. The treadmill elicited a repeating similar
flexion and extension amplitude range for all three
participants in accordance with their personal running
form. The increase in velocity of the belt resulted in
the participants consequently increasing their
cadence and length of their stride to match the new
velocity of the belt. Participant 3’s data showed great
definition on the treadmill as did their Y-Acceleration
graph (Figure 9).
Figure 9: Participant 3 – Dynamic Flexion/Extension of the
Hip - Treadmill (5km/h ->> 9km/h).
Conversely to participants 1 and 3, participant 2
exhibited an inconsistent stride pattern, resulting in
occasional smaller amplitude breaks.
Apparel Concept Design for Analysing Range of Motion at the Hip to Prevent Injury
71

Abduction, adduction, internal and external
rotation also exhibited the same inconsistent and
inaccurate pattern as seen in the stationary
measurements. Evidenced most from cartesian angle
graphs. The data was far greater than that would be
commonly expected for a consistent pattern of
running, often peaking at values greater than 75 and
40 degrees for participants 1 and 2 respectively.
These inaccuracies left the data gathered in these
motions discounted from any further evaluation.
5.6 Dynamic Rom Analysis – Shuttle
Runs & Illinois Agility Test
When concerning the free dynamic testing, flexion
and extension data is very sharp and the peaks very
defined. Instances of changing direction can be
identified in the small periods of low amplitude in
between the large peaks caused because of the athlete
driving the knee forward to accelerate. This is evident
in both the shuttle runs and agility graphs and is
exhibited in Figure 10.
Figure 10: Participant 3 – Dynamic Flexion/Extension of
the Hip – Agility Test. Red dotted circle signifies low hip
angles when decelerating. This shape on the graph can be
used to identify deceleration phases and to evaluate the
actions of participant during testing.
The very sharp peaks and rapid changes in the
angle of the hip are shown even more in the agility
test data for that of participant 3. Again, the changes
in direction can be seen in the smaller amplitude
breaks however these are even smaller and harder to
identify between the greater peaks and angles of the
hip when the participant in driving their leg forward
to accelerate as quickly as possible.
6 DISCUSSION
6.1 Reliability of Results
The sewing and tape holding the sensors in place held
throughout testing, however the wiring to and from
the sensor had the nature to snap when put through
the more dynamic testing and so mid testing repairs
were needed. Leaving it necessary to perform repeats
as the wires would snap during the test. It was also
noticeable that the back sensor stitched into the elastic
waist band, remained stiff and upright, often losing
skin contact when the participant surpassed an angle
of approximately 30 degrees’ flexion at the waist.
Environmental errors came from the Treadmill
used, likely introducing errors between participants,
due to them being open access to the public. Belt
speed was unverified and so is likely not to be the
exact velocity output read off the dashboard due to
friction and wear in the machine. The dynamic tests
also saw occasional slipping which was evident upon
video review. The participants selected footwear, was
not always the most suitable for indoor flooring and
lacked the friction for a dynamic turn, which would
affect sprint performance and the agility test times.
6.2 Gait Characteristics and
Comparisons
The purpose of the treadmill testing phase was to first
initially validate the sensor’s capability to record
basic acceleration data. In doing so, allowing us to
evaluate and identify the stride phase the participant
is in.
Comparing the shape of our graph to that of other
gait analysis papers, a similar trend can be seen in the
vertical acceleration throughout the running strides
performed on the treadmill by the participants. The
acceleration pattern exhibited walking over the initial
30s in Figure 2 is like that of Yang et al (2012) study,
the repetitive similar amplitude peaks (+0.14g, -
0.40g) showing the participant walking at a consistent
pace. Figure 3, zooming in on the acceleration line for
Participant 1, shows a sharp acceleration pattern from
peak to peak (+0.38g, -0.41g), again like Yang’s
study. However, lacking the definition at the peaks to
that of Takeda et al (2008) study. Unlike Takeda’s
data, the accelerations exhibit a single peak
acceleration value, rather than a cluster of data points
around the peak producing a subtle curve around
maximum amplitude. This comes as a result of an
aliasing effect. With the athletes performing
movements at a rate greater than the sensor can
icSPORTS 2019 - 7th International Conference on Sport Sciences Research and Technology Support
72

capture. In increasing the sensor frequency to greater
than 100hz it is believed that such aliasing would be
avoided, in turn improving the resolution of the data.
Less than 100Hz value being more suited to the
slower gait analysis experiments conducted by the
likes of Turcot et al. (2013), designed to analyse
slower motions. Increasing our sampling frequency
would provide us with additional data points at the
peaks once filtered, leaving a more defined
waveform, aiding in the identification gait events and
action detection
Using these peak accelerations however, changes
in running speed are identifiable, one such event is
evident in the increase from 5km/h to 9km/h in Figure
2 for Participant 3, as the peaks increase to a
consistent new amplitude. However, this can be used
to analyse the movement of the athlete for more than
single speed changes alone. Shown in the shuttle run
graph in Figure 12, the smaller amplitude
accelerations between the negative peaks signify the
decrease in stride length, decelerating before
changing direction 180 degrees. The sudden sharp
peaks then signify the greater forces experienced by
the sensor, as the athlete drives their knee forward
after changing direction looking to accelerate into a
sprint, heralding a greater force through the leg and
up through the hip.
Despite the resolution difficulties, the vertical
acceleration has allowed the identification of the gait
phases. This is possible when a relatively consistent
waveform is produced as the stride pattern remains
consistent, like that of our participants running on the
treadmill. However, in more dynamically demanding
competitive scenarios these consistent peaks will not
be observed (Figure 10), One example of such
difficulties are the changes in peaks when participants
performed repetitive dynamic actions like the turns in
the shuttle runs, leading to suspected variations in
participant intensity as they began to fatigue over
time. Participant 3’s shuttle runs shown in Figure 4
show lower peaks for turns eight and nine. It is
suspected that their muscles exhibited a lower force
to decelerate as they were running at a lower speed
towards the end of the 10 shuttle runs. Additional
testing, timing each length of the 10m sprint to
measure intensity may verify this, and if found true
can be used as an additional metric for a coach’s
consideration. However, the possibility remains that
this data could give us an insight not yet achieved into
competitive athletic performance.
6.3 RoM at the Hip
Static RoM at the hip yielded conflicting accuracies
for the different motions at the hip. Flexion and
extension measurements proved promising for an
initial concept, having an average difference of -6.3º
to that measured with the goniometer. A greater
difference than that of the 2° MDC of the goniometer
that design looks to match, showing the measurement
method and interpretation still requires work. The
differences also fluctuated between being greater than
that measured and less than the goniometer, therefore
eliminating a systematic error as the cause. A
variance of -6.3º from the goniometer is far from the
accuracy which is required in the evaluation of
athletic performance. Ideally this would be as small
as possible for accurate measurements to ensure
reliable conclusions can be drawn. Should an athlete
experience hyperextension of the hip joint for
example, then the results must be able to show this,
and to what degree has the hip joint over-extended. A
decrease in error could come with an increase in the
resolution of the data as discussed before.
It is possible that using a gyroscope in tandem
with the accelerometer may allow other motions of
the hip to be measured accurately. Abduction,
adduction, internal and external rotation, having
maximum percentage differences of -57.00% and
+65.11% respectively for each motion pairing. These
percentage differences in abduction, adduction,
internal and external rotation result in the data being
disregarded in any further processing due to their
unreliability.
A gyroscope can be tasked with exclusively
measuring the rotation of the hip in the coronal plane,
measuring abduction and adduction. This is likely
more accurate than the accelerometers single gravity
vector being used to measure all three axis changes in
angles respectively. The addition of an accelerometer
here may also help account for the gyroscopic drift
which may be experienced in the dynamic motions
but will require testing and further development to
evaluate its suitability.
However, it is the case that many papers focus on
the flexion and extension of the hip in gait analysis
alone. Alonge et al. (2014) graphically plots the
flexion of the hip through their gait motions. Once the
pace is increased to 9km/h for participant 3 (Figure 2)
the angles reflect that more of Alonge’s gait flexion
and extension results, peaking consistently around 40
degrees. It is very noticeable however, the peaks
greater than that of 80 degrees despite the use of a
moving average filter. At a comfortable pace ideally,
the stride pattern will remain consistent throughout.
Apparel Concept Design for Analysing Range of Motion at the Hip to Prevent Injury
73

However, as the participant relaxes throughout the
duration of the run, they may move back down the
belt of the treadmill and must move forward again.
This motion requires a larger stride and greater
flexion and extension of the hip reasoning these large
peaks. The participants related this inconsistent pace
to inexperience running on a treadmill.
Peak changes in flexion and extension enable us
to understand the stage of each test the participant was
in when conducting the shuttle and agility drills. The
lower peaks suggest smaller and lighter steps
associated with changing direction and speed in the
shuttle runs, and this is evident in the breaks in the
peak accelerations (Figure 4). This occurred prior to
the larger peak flexion and extensions of the hip
associated with driving the knee forward to accelerate
quickly. This ability to sense a change in direction is
also notable in the agility tests (e.g. figure 14),
suggesting it may be possible to identify actions of
the athlete in a competitive scenario and hence
measure the performance metrics of the hip required
to perform such a movement. Opening the area of
competitive scenario research to identify
performance metrics associated with actions
performed in play, serving as an additional method of
performance evaluation. Such as the likes of the
capability of muscles about the hip to produce
moments when shooting in football, associating
muscular performance to speeds obtained by the ball
in flight. However, this will take a substantial amount
of time and case studies to support this hypothesis. As
well as substantial number of case studies to support
the correlation study of hip RoM and consequential
injures.
7 CONCLUSIONS
It was hypothesised that the measurement of RoM
and gait in a competitive scenario could identify the
position, motion and force through the hips and legs
prior to and at the time of injury. In doing so
supporting the real time injury analysis and the
diagnosis of injuries, by using motions at the hip and
their correlated driving muscles to identify possible
muscle damage and causes of pain and injury.
Both extra and intra articular injuries can be
identified by a change in the RoM at the hip.
However, large differences (-6.3º) in the sensor’s
readings, means that sound conclusions drawn as to
the exact angular position of the hip joint cannot be
made. However, it is possible to visualise the motion
of the upper leg. In cross examining video references
to the captured data, it is possible to identify
characteristics of an athlete’s form which may impact
performance. One such possible identification is from
the force measured through the leg in figure 10.
Showcasing participant 3’s fatigue over time with
lower peaks for turns eight and nine. Suspecting that
their muscles exhibited a lower force to decelerate as
they ran at a lower speed towards the end of the 10
repetitions. Such an example is relatively basic
however, showcases the desired foundations of
analysis of form and hip motion.
In testing on recreational athletes, it was possible
to differentiate form and gait characteristics in a
competitive scenario, unlike motion capture, giving a
closer insight into the demands of the lower limbs.
One such obvious example was the comparison of an
athlete’s acceleration and deceleration patterns.
Increased driving angle (Figure 10), cadence (Figure
5) and the forces exerted through the leg (Figure 5),
build a picture of the competitive performance of the
athletes. Whilst testing in this research is limited, the
findings are encouraging to show that a more detailed
analysis of the hip and the lower limbs is possible
when using our design. The shorts considerable lower
pricing point and ease of use make the design more
accessible to the general athletic market, laying the
foundations to better our understanding of the
competitive demands of the hip and lower limbs.
REFERENCES
Alonge, F. Cucco, E. D’Ippolito, F. Pulizzotto, A. (2014)
‘The Use of Accelerometers and Gyroscopes to
Estimate Hip and Knee Angles on Gait Analysis’,
Sensors (Basel), Vol.14(5), pp.8430-8446, [Online].
Available at: (Accessed: 3 March 2018)
Andersen, T. Larsen, O. Tenga, A. Engebretsen, L. Bahr, R.
(2003) ‘Football Incident Analysis: A New Video
Based Method to Describe Injury Mechanisms in
Professional Football’, British Journal of Sports
Medicine, Vol.37, pp.226-232, BMJ Journals, [Online].
Available at: https://bjsm.bmj.com/content/37/3/226?
ijkey=1228c77d7021287ddbe56a28d919e66d2d71aab
f&keytype2=tf_ipsecsha (Accessed: 16 November
2018)
Byrd, B. (2007) ‘Evaluation of the Hip: History and
Physical Examination’, International Journal of Sports
Physical Therapy, Vol.2, pp231-240, NCBI, [Online].
Available at: https://www.ncbi.nlm.nih.gov/pmc/
articles/PMC2953301/ (Accessed: 10 December 2017).
Elson, R. Aspinall, G. (2008) ‘Measurement of Hip Range
of Flexion-Extension and Straight-Leg Raising’,
Clinical Orthopaedics and Related Research,
Vol.466(2), pp.281,286, [Online] Available at:
https://www.ncbi.nlm.nih.gov/pmc/articles/PMC2505
147/ (Accessed: 17 March 2019).
icSPORTS 2019 - 7th International Conference on Sport Sciences Research and Technology Support
74

Fahrenberg, J. Foerster, F. Smeja, M. Müller, W. (1997)
‘Assessment of Posture and Motion by Multichannel
Piezoresistive Accelerometer Recordings’,
Psychophysiology, Vol.34, pp.607-612, Wiley, [Online]
Available at: https://onlinelibrary-wiley-com.ergo.
southwales.ac.uk/doi/epdf/10.1111/j.1469-
8986.1997.tb01747.x (Accessed: 4 January 2019).
Hootman, J. Dick, R. Agel, J. (2007) Epidemiology of
Collegiate Injuries for 15 Sports: Summary and
Recommendations for Injury Prevention Initiatives’,
Journal of Athletic Training, Vol.4, pp.311-219, NCBI,
[Online]. Available at: https://www.ncbi.nlm.nih.gov/
pmc/articles/PMC1941297/ (Accessed: 16 November
2018).
Kenneth Backhouse (No Date) Quadriceps Control of the
Knee Joint, Available at: https://www.istd.org/courses-
and-training/resources/quadriceps-control-of-the-knee-
joint/ (Accessed: 8 January).
Kerbel, Y. Smith, C. Prodromo, J. Nzeogu, M. Mulcahey.
M. (2018) ‘Epidemiology of Hip and Grion Injuries in
Collegiate Athletes in the United States’, Orthopaedic
Journal of Sports Medicine, Vol.6(5), Sage
Publications [Online]. Available at: https://www.ncbi.
nlm.nih.gov/pmc/articles/PMC5952296/#bibr31-2325
967118771676%20-%2012/10/18 (Accessed: 17
October 2018).
Mcgurran, A. (2017) ‘Why Aaron Lennon and Other
Footballers Suffer from Mental Health Problems’, GQ,
8 May, [Online]. Available at: https://www.gq-
magazine.co.uk/article/aaron-lennon-mental-health
(Accessed: 30 October 2018).
Muscolino, J. (2018) Other Unusual Suspects, Available at:
https://learnmuscles.com/blog/2017/08/13/other-
unusual-suspects/ (Accessed: 19 March 2019).
Neumann, D. (2010). ‘Kinesiology of the Hip: A Focus on
Muscular Actions’. Journal of Orthopaedics & Sports
Physical Therapy. Vol.20. pp.84
Noonan, T., Garrett, W. (1999) ‘Muscles Strain Injury:
Diagnosis and Treatment’, Journal of The American
Academy of Orthopaedic Surgeons, pg262-269,
[Online]. Available at: https://pdfs.semanticscholar.
org/03e1/2b7031fe66f81e79781b97a42a1ce0d1b1e0.p
df (Accessed: 3 November 2018).
Siebenrock, K. Ferner, F. Noble, P. Santore, R. Werlen, S.
Mamisch, T. (2011) ‘The CAM-Type Deformity of the
Proximal Femur Arises in Childhood in Response to
Vigorous Sporting Activity’ Clinical Orthopaedics and
Related Research, Vol.477, pp3229-3240, NCBI,
[Online]. Available at: https://www.ncbi.nlm.nih.gov/
pmc/articles/PMC3183218/ (Accessed: 17 October
2018).
Tao, W. Zheng, R. Feng, H. (2012) ‘Gait Analysis Using
Wearable Sensors’, Sensors MDPI, Vol.12(2),
pp.2255-2283, NCBI, [Online]. Available at:
https://www.ncbi.nlm.nih.gov/pmc/articles/PMC3304
165/ (Accessed: 8 January 2019).
Tong, K. Garanat, M. (1999) ‘A Practical Gait Analysis
System Using Gyroscopes’, Medical Engineering and
Physics, Vol.21(2), pp.87-94, Science Direct [Online].
Available at: https://www.sciencedirect.com/science/
article/pii/S1350453399000302 (Accessed: 8 January
2019)
Turcot, K. Aissaoui, R. Boivin, K. Pelletier, M.
Hagemeister, N. de Guise, J. (2008) ‘New
Accelerometric Method to Discriminate Between
Asymptomatic Subjects and Patients with Medial Knee
Osteoarthritis During 3-D Gait’, IEEE Transactions on
Biomedical Engineering, Vol.55(4), [Online].
Available at:https://ieeexplore-ieee-org.ergo.south
wales.ac.uk/document/4384303 (Accessed: 11
February 2019).
Williams, M. (2018) Personal Meeting with Morgan
Williams, 24
October.
Yazdifar, Ma. Yazdifar, Mo, Mahmud, J. Esat, I. Chizari.
M. (2013) ‘Evaluating the Hip Range of Motion Using
the Goniometer and Video Tracking Methods’,
Procedia Engineering, Vol.68, pp.77-82, Science
Direct [Online]. Available at: https://www.science
direct.com/science/article/pii/S1877705813020043
(Accessed: 23 December 2018).
Apparel Concept Design for Analysing Range of Motion at the Hip to Prevent Injury
75
