
Comparison Method of Long-term Daily Life Considering the Manner of
Spending a Day
Takahiko Shintani, Tadashi Ohmori and Hideyuki Fujita
Graduate School of Informatics and Engineering, The University of Electro-Communications, Tokyo, Japan
Keywords:
Daily Life, Activity Data, Comparison Method, Clustering, Healthcare.
Abstract:
Recently, a large amount of physical activity data has been obtained via wearable sensors collected as lifelogs.
The long-term daily lives of users can be understood using such long-term activity data. In this paper, we
investigate a method for comparing two distinct periods of the daily life of a user to understand the long-term
characteristics of that user’s daily life. Our method uses only activity data that can be collected easily and
continuously over the long term using wearable sensors. There are various ways in which humans can spend
a day, and a period of daily life consists of a set of several days spent in several manners. We compare two
periods of daily life by considering the manner in which a day is spent. The manner in which a day is spent
can be distinguished based on the activities that are performed on a given day. The amount of movement
differs depending on the activity, and similar amounts of movement are measured when similar activities are
performed. We focus on this point to classify how each day is spent. Further, we distinguish the manner in
which a day is spent based on similarities in the time series data with respect to the levels of the activities by
noting the main sleeping period, which is an important behavior in daily human life. We propose a method to
compare two distinct periods of daily life based on the distribution of the manner in which a day is spent in
each period. The effectiveness of the methods proposed in this paper is evaluated via experimental evaluations
using real datasets.
1 INTRODUCTION
Data collection technology has become widespread
due to the extensive usage of small and inexpensive
sensors. Human activity data for long periods of
time can be continuously assessed using wristband-
and clip-type wearable sensors(Gurrin et al., 2014).
There are many services for visualizing information
related to sleeping time, steps, and calories burned us-
ing lifelog data obtained from wearable sensors. This
allows the user to keep track of his or her health and
look back on past events(Jacquemard et al., 2014;
Christiansen and Matuska, 2006). In addition, re-
searchers have reported the use of activity data for
medical and health care(Dobbins and Rawassizadeh,
2015). Motion data have been used to monitor and
improve diet,(Amft and Troster, 2009) to monitor
the process of quitting smoking(Stanley and Osgood,
2011), and to analyze the relationship between a par-
ticular disease and various activities(Bravata et al.,
2007).
Many studies have been conducted to recognize
human behavior from activity data acquired by wear-
able sensors(Lara and Labrador, 2013). Human ac-
tivity recognition (HAR) methods for recognizing ba-
sic activities such as walking, running, and climbing
stairs and the recognition of behavior consisting of
multiple basic activities such as cleaning have also
been introduced(Kim et al., 2010; Chen et al., 2012;
Rawassizadeh et al., 2016b; Cheng et al., 2017). In
these methods, HAR models are built using a hidden
Markov model (HMM) and deep learning methods
such as convolutional neural network (CNN) and re-
current neural network (RNN) (Li et al., 2018; Jiang
and Yin, 2015; Rodriguez et al., 2017). However,
annotated data are required for the learning process.
HAR models are not sufficient to understand human
daily life because the types of behaviors that can be
recognized are limited.
One of the uses of lifelogs is to understand long-
term daily life. Social rhythm metric (SRM) is one
method used to understand human life(Monk et al.,
1990; Monk et al., 1991). SRM evaluates the daily
life of a user using the regularity of the user’s daily
life patterns. The SRM method collects the times of
17 behavioral types, such as waking up, breakfast, and
Shintani, T., Ohmori, T. and Fujita, H.
Comparison Method of Long-term Daily Life Considering the Manner of Spending a Day.
DOI: 10.5220/0008163903470354
In Proceedings of the 11th International Joint Conference on Knowledge Discovery, Knowledge Engineering and Knowledge Management (IC3K 2019), pages 347-354
ISBN: 978-989-758-382-7
Copyright
c
2019 by SCITEPRESS – Science and Technology Publications, Lda. All rights reserved
347

commuting, using questionnaires; then, it measures
the regularity of a person’s life via the dispersion of
these times. Because a user needs to manually record
the times associated with each behavioral type, this
process is difficult to continue for a long time period.
However, SRM is widely used as an index for under-
standing the relationship between a person’s condi-
tion of life and diseases. Therefore, methods to un-
derstand long-term daily life are needed.
Studies aiming to construct a daily life model us-
ing using various sensor data obtained via smartphone
have also been reported(Mafrur et al., 2015; Sitova
et al., 2016). These studies focus on authentication
and user identification using daily life models. Some
algorithms have also been proposed for efficiently
mining frequently performed behavioral patterns us-
ing smartphone logs(Rawassizadeh et al., 2016a). A
life model of these methods is a set of routine be-
haviors. These methods identify lifelog event data
that appear in the same time frame for consecutive
two or more days as a routine behavior. The main
lifelog event data is the usage of smartphone applica-
tion. GPS trajectory and Wifi probe are transformed
to location and movement states. Acceleration data
are converted into basic activities. These are also used
as lifelog event data. Even though these methods are
also expected to help understand long-term life pat-
terns, only conscious behaviors by the user are con-
sidered. In our previous study, we have proposed a
long-term daily life comparison method using motion
status data(Shintani et al., 2019). Similar and differ-
ent periods of life can be compared; however, it is
necessary to use motion status data indicating seg-
ments in which the same type of motion continues.
However, common wearable devices do not output
motion status data. Recently, small wearable devices,
such as wristband sensors, have been developed that
can be worn during the daytime and while sleeping
to collect activity data 24 hours a day all year long.
Most sensor devices output activity amounts per unit
time. This data includes not only conscious behavior
but also unconscious behavior. We can use these data
to better understand human daily life.
In this paper, we propose a method to compare
daily life patterns during two time periods using the
activity amount data per unit time. Long-term activity
data gathered using a wristband-type sensor equipped
with an acceleration sensor are used in this paper. We
consider that daily human lives are comprised of peri-
ods of several days that are spent in several ways; we
then compare two such periods of daily life according
to the manner in which they were spent. Even though
it is assumed that the manner in which a day is spent is
characterized by the performed behavior, we examine
a method for comparing daily life without recogniz-
ing the concrete content of the behavior. In addition,
the amount of activity remains similar when similar
behaviors are performed. Therefore, similar amounts
of activity during the same time unit indicate that the
manner in which a day is spent is likely similar. We
treat the activity amount data, which are separated by
one day, as time series data and distinguish the day-
type distribution of how a day is spent. Accordingly,
we propose a method to compare two periods of daily
life using the day-type distribution. In addition, the
effectiveness of the proposed method is evaluated by
performing experiments using real data.
2 COMPARISONS OF DAILY
LIFE PATTERNS
In this paper, we evaluate the similarity between two
distinct periods of daily life for individual users. Ev-
eryone performs several activities during their daily
lives. Human lives are an accumulation of the several
manners in which a day is spent. For example, re-
searching in a laboratory, attending classes, relaxing
at home, performing part-time jobs, or going out with
friends are day-types related to the manner in which
a person, in this case a student, spends their day. Two
periods of daily student life can be compared using
the differences in the day-types in each period, such
as a period spent primarily attending classes and a pe-
riod of going out with friends and taking on part-time
jobs. Furthermore, even on the day of taking classes,
how to spend the day have to be distinguished by how
a user spent the rest of the time. Unconscious activi-
ties also have to be taken into account. Therefore, we
can characterize a period of daily life using the day-
types performed during that period.
In this paper, we compare two periods of daily life
based on the day-types in each period. The compar-
ison of the daily life in the two periods is intended
to evaluate the similarities between the daily lives of
one user in those two periods. By comparing the daily
life of one user in two periods, we can determine the
time at which this user lives similar and different daily
lives. In addition, we can also identify periods of sim-
ilar daily life patterns during specified periods of time.
Evaluating a period of daily life compared to a stan-
dard period of daily life is also possible. We expect
that a daily life comparison of two periods will be use-
ful to understand long time intervals of daily life.
Two periods of daily life are evaluated to be simi-
lar when the same day-types are frequently observed.
However, these periods are evaluated to be differ-
ent when different day-types are frequently observed.
KDIR 2019 - 11th International Conference on Knowledge Discovery and Information Retrieval
348
Recording the actual behaviors performed in a per-
son’s daily life is necessary to determine if a day-
type is performed. However, it is difficult to manu-
ally record behaviors performed over long time peri-
ods and manual records exhibit poor reliability and
consistency. In this paper, we attempt to address
this problem using activity data. We collected long-
term activity data using a wearable sensor that was
equipped with an acceleration sensor. The activity
data obtained from the wearable sensor directly re-
flect the user’s behaviors and permit the continuous
collection of data over long time periods. The activ-
ity data indicate the amount of activity; however, it is
difficult to obtain detailed behavioral content from the
activity data. By expressing the activity according the
behaviors performed by the user, it is possible to ex-
tract information corresponding to the behavior using
the activity data. In this paper, we detect the day-types
using the activity data and compare two periods of a
user’s daily life based on these data.
3 ACTIVITY DATA
We collected activity data obtained using a wristband
sensor device. We used the life recorder UW-301BT
from Hitachi Systems as the sensor device (Figure 1).
The three-axis acceleration of the arm movement was
Figure 1: The Hitachi System wristband sensor UW-301BT.
measured by attaching the device to the user’s wrist
during the daytime and while sleeping. This device
outputs the amount of activity data in every minute.
One record is comprised of a date and time (in min-
utes) pair and the value of the activity amount. The
activity amount data have a numerical value indicat-
ing the intensity of the activity.
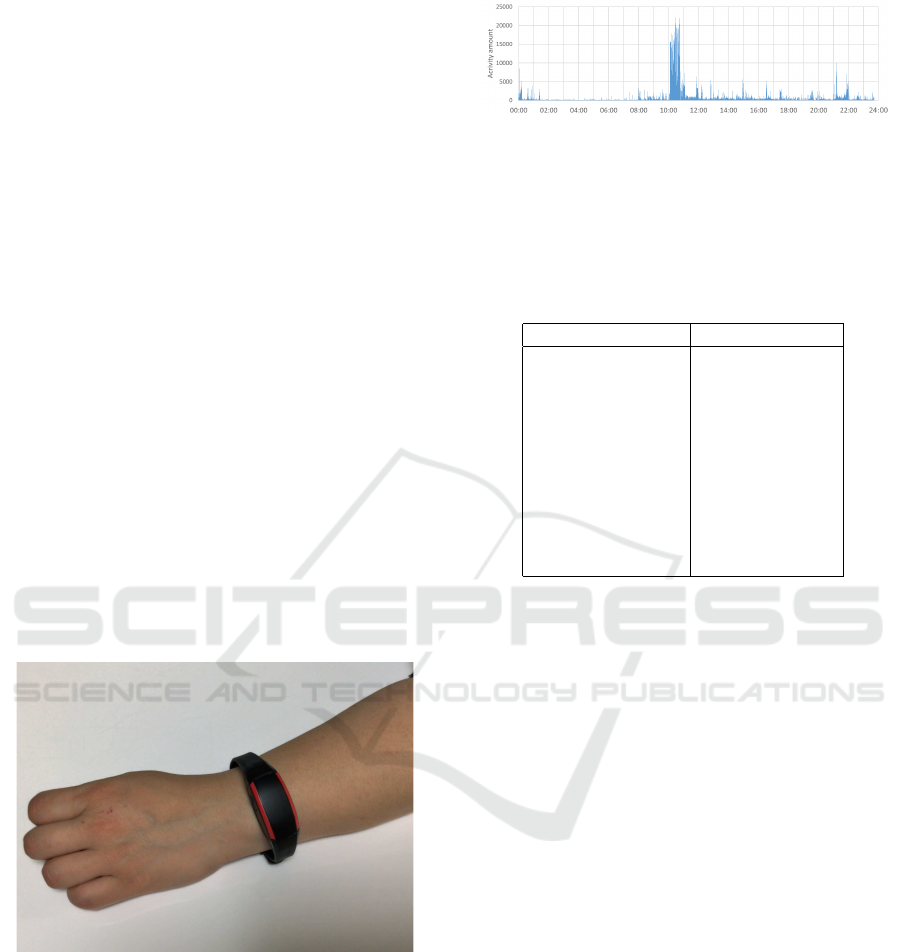
Figure 2 depicts one day of activity amount data
for an example user. Table 1 lists in part the activ-
ity amount data in Figure 2. In this figure, the verti-
cal axis represents the activity amount, whereas the
Figure 2: Example of activity amount data for one day.
horizontal axis represents time. The data obtained
over one day from 00:00 to 24:00 are graphically rep-
resented. From 02:00 to 08:00, the activity is ob-
served to be minor. Shortly after 10:00, a large activ-
ity amount indicates a transition in the type of activity.
Table 1: Example of activity amount data.
Date and time Activity amount
2018-10-11 10:00 144.6
2018-10-11 10:01 1685.9
2018-10-11 10:02 1728.3
2018-10-11 10:03 237.2
2018-10-11 10:04 2120.4
2018-10-11 10:05 1128.4
2018-10-11 10:06 15566.8
2018-10-11 10:07 15588.1
2018-10-11 10:08 15745.4
2018-10-11 10:09 15582.3
4 MANNER OF SPENDING A
DAY, THE DAY-TYPE
4.1 Clustering the Day-type
The day-type in which a day is spent is character-
ized by the user’s behavior during each time period.
Therefore, we distinguish the manner in which a day
is spent according to the performed behavior and
time. For example, a day of going to school in-
volves waking up at approximately 07:00, dressing
for 1h, traveling to school at 08:00, and attending
classes from 09:00. Meanwhile, a day of enjoying
sports in the morning involves waking up at approx-
imately 06:00, going out at 08:00, and playing. In
addition, even if the same behaviors are performed
on two days, they should be distinguishable as differ-
ent days if these behaviors are performed at different
times or for different lengths of time.
The activity amount data indicate the amount of
activity-related behaviors that are exhibited by a user.
Therefore, it is possible to distinguish between sim-
ilar or different behaviors. In this paper, days with
similar activity amounts at the same time of day are
observed to exhibit similar ways of spending a day,
that is, similar day-types.
Comparison Method of Long-term Daily Life Considering the Manner of Spending a Day
349

The activity amount data for one day are an or-
dered list of the activity amounts from 00:00 to 24:00
and are referred to as the activity vector and is com-
prised of 1440 elements. The distance between two
activity vectors corresponds to the dissimilarity in the
manner in which a day is spent. When the Euclidean
distance is adopted, the distance d(x, y) between two
activity vectors x and y can be calculated as follows:
d(x, y) =
n
∑
i=0
q
(x
i
− y
i
)
2
.
Here, n denotes the number of elements in the activity
vector for one day. x
i
and y
i
denotes the i-th element
of the activity vector x and y. The smaller the value of
d(x, y), the higher the probability that the day-types
are similar. In this paper, we use the Euclidean dis-
tance; however, other distance metrics, such as the
Minkowski distance, may be used.
The activity vectors are clustered using a cluster-
ing algorithm using this distance metric. Activity vec-
tors belonging to one cluster are a set of days that ex-
hibit similar day-types. Each cluster corresponds to
a given set of day-types. Days belonging to different
clusters are distinguished as days with different day-
types, or different ways of spending the day. The clus-
tering procedure for the activity vectors can be given
as follows:
1. Convert the activity amount data into activity vec-
tors for each day;
2. Cluster the activity vectors using the clustering al-
gorithm; and
3. Label each day as the day-type, i.e., cluster, to
which the activity vector belongs.
4.2 Level of the Activity Amount Data
The activity amount depends on the user’s behav-
ior. When behaviors with active movements are per-
formed, the activity amount becomes very high. The
value difference in the activity amount differs depend-
ing on the behavior. For example, the difference be-
tween the activity amounts of gardening and play-
ing with children is considerably larger than that be-
tween gardening and deskwork. With respect to be-
haviors, a difference can be observed between gar-
dening, which is standing work, and deskwork, which
is sitting work. Meanwhile, for behavior with gentle
movements, the difference between activity amounts
is small even with different behaviors. A divergence
can be observed between the differences in behaviors
and activity amounts. However, the difference in ac-
tivity amount cannot adequately determine behavioral
differences.
In this paper, the symbolic aggregate approxima-
tion (SAX)(Keogh et al., 2001) algorithm is used to
convert the activity amount data into a symbol string.
SAX is also used to convert numerical time series data
into symbol strings. These symbols have meaning in
their magnitude relationships and differences. The
numerical time series data z = (z
1
, . . . , z
n
) of length
n is converted into a vector X = ( ¯x
1
, ¯x
2
, . . . , ¯x
M
) of
length M (≤ n). The i-th element ¯x
i
of X can be cal-
culated as follows:
¯x
i
=
M
n
n
M
∑
j=1
z
n
M
∗i+ j
.
This vector can be referred to as a piecewise aggregate
approximation (PAA). Because the activity data used
in this paper are given per minute,
n
M
corresponds to
the unit of time. Further, the value range of the PAA
elements is divided via equal frequency discretization
(EFD) into L ranges and each range corresponds to
the level of positive numbers. By converting each el-
ement of the PAA vector into a level, a vector can be
constructed based on the amount of activity data. This
vector is referred to as the activity level data. The ac-
tivity level data are used to denote the level of exercise
during each unit of time. The activity level data can
help us understand the amount of movement that has
been performed in a given unit of time. These data are
also numerical time series data; therefore, identifying
the specific context of a behavior is difficult.
However, determining the times at which activi-
ties that do not involve considerable movement are
performed and the times at which well-characterized
behaviors are performed in a user’s daily life is pos-
sible. Even for users who are often involved in light
activities, it is possible to distinguish differences be-
tween their behaviors. Therefore, addressing the di-
vergence between behavioral differences and differ-
ences in activity amounts is feasible. The clustering
procedure of the day-type for the activity level data is
the same as the procedure presented in Section 4.1. A
list of activity level data for one day corresponds to
the activity vector.
4.3 Consideration of Sleep
Sleep is an important behavior in human life. When
comparing the manner in which a day is spent, we
need to consider both the sleeping hours and the sleep
time. Specifically, for the activity level data presented
in the previous section, the duration of the sleeping
time affects the clustering of the day-types. Users
with an average sleeping time of seven hours sleep
approximately 30% of their daily lives. When activity
level data are categorized into 10 levels, 3 levels are
KDIR 2019 - 11th International Conference on Knowledge Discovery and Information Retrieval
350

occupied by sleep. Therefore, the distance of the ac-
tivity amount vector with respect to the activity level
is strongly influenced by the sleeping time, making it
impossible to properly cluster the day-type.
In this paper, we use the activity level data gener-
ated based on the activity amount data for the entire
day and that excepting the main sleeping period. The
longest sleeping period in a day is considered to be the
main sleeping period. Several studies have been con-
ducted to detect sleep in activity data(Webster et al.,
1982; Kay et al., 2012). Here, sleep was detected us-
ing the Cole equation(Cole et al., 1992) and the ac-
tivity level data corresponding to the main sleeping
period were converted to “NULL”.
While clustering the day-type, it is necessary to
consider the main sleeping period while performing
the distance calculation for an activity vector. While
comparing two days with respect to the manner in
which the day was spent, the time unit, that is the
main sleeping period for both the days, can be re-
garded as exhibiting the same behavior. However, for
the time unit of the main sleeping period on only one
day, we cannot calculate the activity level difference
because the value of the activity level in this time unit
is “NULL”. Therefore, the equation of the distance
d
0
(x, y) of the activity vector is modified to omit the
main sleeping period:
d
0
(x, y) = d(x, y) ×
M − M
s
M
p
.
Here, M
p
denotes the number of entries in which the
elements of the same time unit for both vectors are
not “NULL” and M
s
denotes the number of entries
in which the elements of the same time unit for both
vectors are “NULL”. Therefore, the difference corre-
sponding to the time unit in which only one side is
the main sleeping period is rectified by the time unit
difference can be calculated. There is a case where
M
p
= 0. This case is valid when all the time units of
the two days are expressed in the main sleeping pe-
riod of one day only. In this case, the distance cannot
be calculated. Our method marks such cases as out-
liers. Days belonging to outliers are considered to be
in a single cluster.
5 PROPOSED METHOD
In this paper, we compare two periods of daily life
based on the manner in which the day is spent dur-
ing each period. The composition of the manner of
spending a day, the day-types, of a period p denotes
the distribution of the number of days corresponding
to those day-types. The distribution of this number of
days is referred to as the day-type vector. For exam-
ple, in the clustering of the day-types, the days can be
classified into three types. For a period of 10 days, if 3
days are day-type 1, 5 days are day-type 2, and 2 days
are day-type 3, the day-type vector can be given as
(3, 5, 2). Because the daily life in a certain period can
be represented by such a vector, similarities between
such vectors correspond to similarities in the user’s
daily life. When the cosine similarity is adopted for
the vector similarity, the similarity between two peri-
ods sim(X, Y ) can be calculated as follows:
sim(X, Y ) = cos(X, Y ) =
X ·Y
kXk × kY k
.
With increasing proximity of sim(X, Y ) to 1, the daily
lives of these periods are observed to become increas-
ingly similar, where X and Y are considered to be day-
type vectors for each period.
Assuming the amount of activity data D, two pe-
riods P
1
and P
2
, the length of the activity level vector
M, the number of activity levels L, and the number of
day-types K, the procedure of the proposed method
can be given as follows:
1. Detect the main sleeping period in D and convert
the activity amount of the corresponding record of
D to “NULL”;
2. Convert D into the activity level data D
L
;
3. Convert D
L
into activity vectors and cluster them
into the day-types;
4. Generate the day-type vector for each period; and
5. Calculate the similarity from the day-type vectors.
The value outputted by this procedure is the similarity
between the two periods of daily life.
6 EXPERIMENTAL EVALUATION
6.1 Experiments
We examined our method using an actual dataset. We
used activity amount data collected from six exper-
imental participants. The term of each dataset was
approximately 0.8–6.5 years, with a total of 4795
days. The proposed methods, that is, the clustering
of the manner of spending a day (the day-type) and a
comparison of two periods of daily life, were evalu-
ated. While clustering the day-types, a K-means algo-
rithm(MacQueen, 1967) along the Euclidean distance
was used. The cosine similarity was used for the sim-
ilarity of the day-type vector. In all the experiments,
the unit of time of the activity level was set to 10 min,
Comparison Method of Long-term Daily Life Considering the Manner of Spending a Day
351
the number of activity levels was set to 10, and the
number of clusters on the k-means algorithm was set
to K= 15. Similar experimental results were observed
when other clustering algorithms were used and when
parameter settings were changed.
6.2 Evaluation of the Clustering of the
Day-type
We selected dates that were confirmed to exhibit simi-
lar manners of spending a day and calculated the sim-
ilarity of the two periods. We calculated 56 pairs of
such days. Here, every two days for which the simi-
larity was calculated used data belonging to the same
experimental participant. In addition, we selected
days that were observed to have different day-types
and calculated the similarity of the two periods. We
calculated 83 such pairs. Every two days in which the
similarity was calculated used data belonging to the
same experimental participant. Here, the two combi-
nations of different day-types were set to ensure that
the sums of the activity amounts for each day were
nearly the same. Therefore, we avoided comparing
two days that were obviously different day-types.
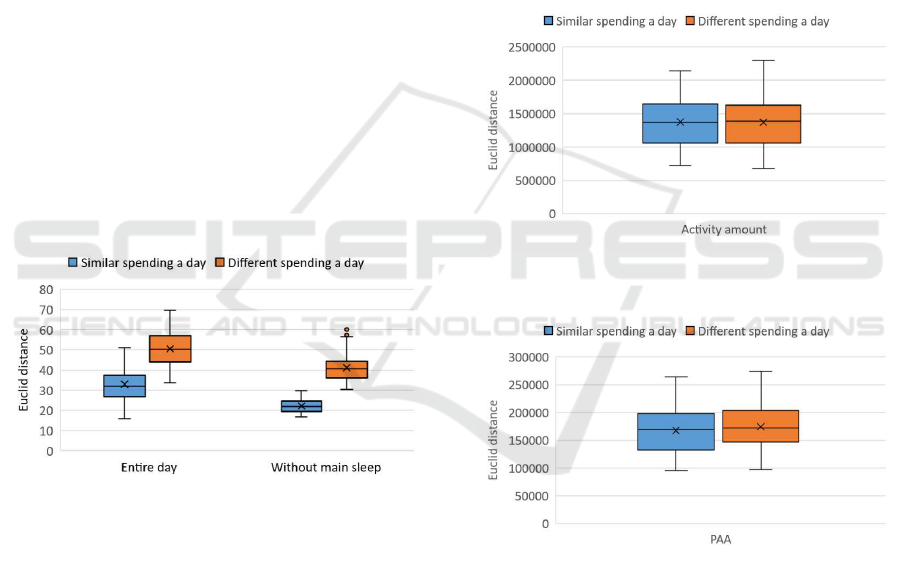
Figure 3 depicts the calculation results for the sim-
ilarities of the day-types. The two plots on the left
Figure 3: Similarity of day-types.
side of Figure 3 indicate the results of similarity cal-
culations using the activity level data from the entire
day. The two plots on the right side are the results
of similarity calculations using the activity level data
excluding the time unit of the main sleeping period.
The first and third plots from the left are the results of
similarity calculations of days exhibiting similar day-
types. The second and fourth plots from the left are
the results of similarity calculations of pairs of dif-
ferent day-types. As depicted in Figure 3, the value
ranges of similarity for similar day-types and that of
different day-types overlap when the value is calcu-
lated using data from the entire day. This result indi-
cates that calculations using data from the entire day
cannot accurately distinguish between day-types. For
each experimental participant, cases where the simi-
larity of different day-types was higher than the sim-
ilarity of similar day-types were considered to be er-
rors when distinguishing between types. This ratio
is referred to as the error ratio of the day-type dis-
tinction. The error ratio of the day-type distinction
for calculations using data from the entire day was
observed to be 29%. Meanwhile, the value range of
the similarity of similar day-types and that of different
day-types do not overlap when the value is calculated
using data excluding the time unit of the main sleep-
ing period. The error ratio of the day-type distinction
in this case was observed to be 0%.
Figures 4 and 5 depict the calculation results using
the activity amount per minute and PAA, respectively.
The unit of time of the PAA data was set to 10 min.
Figure 4: Similarity of the day-type using the activity
amount.
Figure 5: Similarity of the day-type using PAA.
Figures 4 and 5 show that calculations performed
using the activity amounts per min and the calcu-
lations using PAA cannot accurately distinguish be-
tween the day-types. Specifically, for people who ex-
ercise, several errors were present in the day-type dis-
tinction. For the similarity calculated using the value
of the activity amount, the difference in the activity
amount of a time unit with respect to the active behav-
iors became large, therefore increasing the distinction
errors for the day-type.
KDIR 2019 - 11th International Conference on Knowledge Discovery and Information Retrieval
352
6.3 Evaluation of the Comparison of
Two Periods of Daily Life
We prepared 26 pairs of periods in which similar
daily activities were confirmed and 35 pairs of peri-
ods in which different daily activities were confirmed.
Each period compared durations of two weeks to two
months.
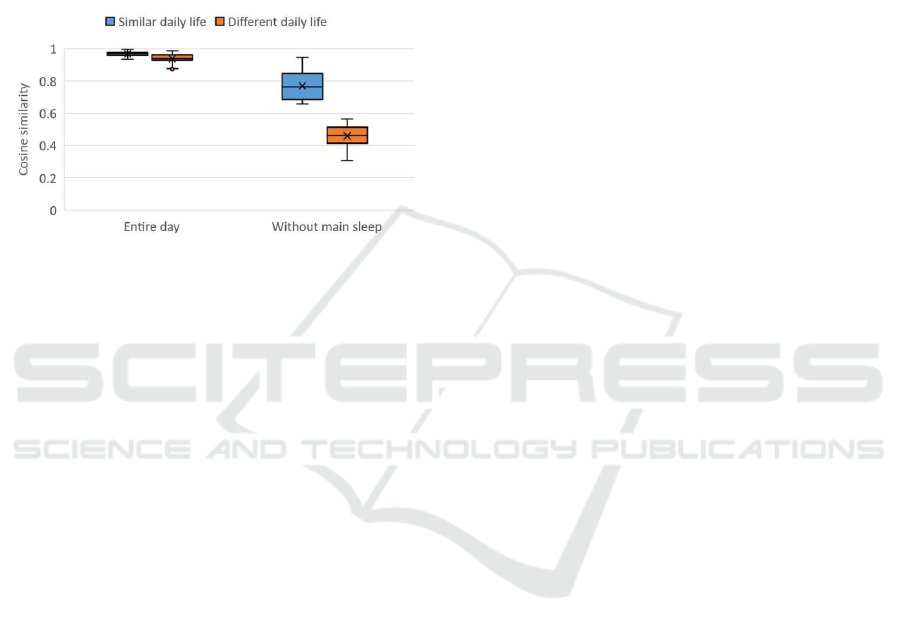
Figure 6 depicts the comparison results of the
daily life for 10 times. The plots of on the left side are
Figure 6: Similarities of daily life activities, or day-types.
the cosine similarity of pairs of periods with similar
day-types, whereas those on the right side are the co-
sine similarity of pairs of periods with different day-
types. Figure 6 depicts the result of calculations using
the activity level data from the entire day and those
excluding the time unit of the main sleeping period.
A cosine similarity value closer to 1 indicates more
similar day-types.
Figure 6 depicts the difference between the aver-
age value of similar day-type pairs and the average
value of different day-type pairs. However, for the
calculation results obtained using the data from the
entire day, the cosine similarity ranges of the simi-
lar and different day-types overlap. For the same ex-
perimental participants, the case in which the similar-
ity of different day-types becomes higher than that of
similar day-types was considered to be an error. The
ratio of this error is referred to as the error ratio of
the daily life comparison. The error ratio of the daily
life comparison that used the data from the entire day
was 48%. Because calculations using data from the
entire day cannot accurately distinguish the day-type,
the daily life comparison was observed to be inaccu-
rate. Meanwhile, the cosine similarity range does not
overlap for results of calculations excluding the time
unit of the main sleeping unit. Further, the difference
in the similarity between similar and different day-
type pairs was also large with an error ratio of 0%.
The same trend was also observed when the number
of activity levels, the unit of time of the activity level
data, and the number of clusters of day-types were
changed. Therefore, the proposed method using the
activity level data, excluding the time unit of the main
sleeping period, can accurately compare two periods
of daily life.
7 CONCLUSIONS
In this study, we proposed a method to compare long-
term daily life patterns using activity data. The pro-
posed method does not detect the context of the be-
havior. The day-type, or the way a day is spent, is
clustered using the activity data of a user over a long
period of time as obtained from a wearable sensor de-
vice. We calculated the similarity between two pe-
riods of daily life based on the distribution of the
day-type in each period. In addition, we addressed
the problem of divergence with respect to the activ-
ity amount and the behavior based on the level of the
activity amount. By considering the main sleeping pe-
riod, which is an important behavior in human daily
lives, a method was proposed to distinguish between
day-types. The results of the experimental evaluation
performed based on actual data indicated that the pro-
posed method can accurately compare two periods of
daily life.
ACKNOWLEDGEMENTS
This work was supported by JST CREST Grant Num-
ber JPMJCR1503, Japan.
REFERENCES
Amft, O. and Troster, G. (2009). On-body sensing solutions
for automatic dietary monitoring. Pervasive Comput-
ing, 8(2):62–70.
Bravata, D., Spangler, C., Sundaram, V., Gienger, A., Lin,
N., Lewis, R., Stave, C., Olkin, I., and Sirard, J.
(2007). Using pedometers to increase physical activ-
ity and improve health: a systematic review. American
Medical Association, 298(19):2296–2304.
Chen, L., Hoey, J., and Nugent, C. (2012). Sensor-based
activity recognition. Transactions on systems, man,
and cybernetics, 42(6):790–808.
Cheng, L., Guan, Y., Zhu, K., and Li, Y. (2017). Recogni-
tion of human activities using machine learnig meth-
ods with wearable sesors. In Annual Computing and
Communication Workshop and Conference. IEEE.
Christiansen, C. and Matuska, K. (2006). Lifestyle balance:
a review of concepts and research. Journal of Occu-
pational Science, 13(1):49–61.
Comparison Method of Long-term Daily Life Considering the Manner of Spending a Day
353

Cole, R., Kripke, D., Gruen, W., Mullaney, D., and Gillin,
J. (1992). Automatic sleep/awake identification from
wrist activity. Sleep, 15(5):461–469.
Dobbins, C. and Rawassizadeh, R. (2015). Clustering of
physical activities for quantified self and mhealth ap-
plications. In International Conference on Ubiquitous
Computing and Communications, pages 1423–1428.
Elsevier.
Gurrin, C., Smeaton, A., and Doherty, A. (2014). Lifelog-
ging: personal big data. Foundations and Trends in
Information Retrieval, 8(1):1–125.
Jacquemard, T., Novitzky, P., O’Brokchaun, F., Smeaton,
A., and Gordijn, B. (2014). Challenges and oppor-
tunities of lifelog technologies: a literature review
and critical analysis. Science and Engineering Ethics,
20(2):379–409.
Jiang, W. and Yin, Z. (2015). Human activity recognition
using wearable sensors by deep convolutional neural
networks. In Internationa Conference o Multimedia,
pages 1307–1310. ACM.
Kay, M., Choe, E., Shepherd, J., Greenstein, B., Watson,
N., Consolvo, S., and Kientz, J. (2012). Lullaby: a
capture & access system for understanding the sleep
environment. In International Conference on Ubiqui-
tous Computing, pages 226–234. ACM.
Keogh, E., Chu, S., Hart, D., and Pazzani, M. (2001). An
online algorithm for segmenting time series. In Inter-
national Conference on Data Mining, pages 289–296.
IEEE.
Kim, E., Helal, S., and Cook, D. (2010). Human activity
recognition and pattern discovery. Pervasive comput-
ing, 9:48–53.
Lara, O. and Labrador, M. (2013). A survey on human ac-
tivity recognition using wearable sensors. Communi-
cations Surveys and Tutorials, 15(3):1192–1209.
Li, F., Shirahama, K., Nisar, M., Koping, L., and Grze-
gorzek, M. (2018). Comparison for feature learning
methos for human activity recognition using wearable
sensors. Sensors, 18(679).
MacQueen, J. (1967). Some methods for classification and
analysis of multivariate observations. In Berlekley
Symposium on Mathematical Statistics and Probabil-
ity, pages 281–297.
Mafrur, R., Dharma, I., and Choi, D. (2015). Modeling and
discovering human behavior from smartphone sens-
ing life-log data for identification purpose. Human-
centric Computing and Information Science, 5(31).
Monk, T., Flaherty, J., Hoskinson, F., and Kupfer, D.
(1990). The social rhythm metric: an instrument to
quantify the daily rhythm of life. Nervous and Mental
Disease, 178(2):120–126.
Monk, T., Kupfer, D., Frank, E., and Ritenour, A. (1991).
The social rhythm metric (srm): measuring daily so-
cial rhythms over 12 weeks. Psychiatry Research,
36(2):195–207.
Rawassizadeh, R., Momei, E., Dobbins, C., Gharibshah,
J., and Pazzani, M. (2016a). Scalable daily human
behavioral pattern mining from multivariate temporal
data. Transactions on knowledge and data engineer-
ing, 28(11):3098–3112.
Rawassizadeh, R., Momeni, E., Dobbins, C., Gharibshah,
J., and Pazzani, M. (2016b). Scalable daily human
behavioral pattern mining from multivariate temporal
data. Transactions on Knowledge and Data Engineer-
ing, 28(11):3098–3112.
Rodriguez, M., Orrite, C., Medrano, C., and Makris, D.
(2017). One-shot learning of human activity with an
map adapted gmm and simlex-hmm. Transactions on
cybernetics, 47(7):1769–1780.
Shintani, T., Ohmori, T., and Fujita, H. (2019). Method
for comparing long-term daily life using long-duration
episodes. In International Workshop on Data Analyt-
ics solutions for Real-Life Aplications.
Sitova, Z., Sedenka, J., Yang, Q., Peng, G., Zhou, G.,
Gasti, P., and Balagani, K. (2016). Hmog: New be-
havioral biometric features for continuous authentica-
toin of smartphone users. Transactions on information
forensics and security, 11(5):877–892.
Stanley, K. and Osgood, N. (2011). The potential of sensor-
based monitoring as a tool for health care, health
promotion, and research. The annuals of Family
Medicine, 9(4):296–208.
Webster, J., Kripke, D., Messin, S., Mullaney, D., and
Wyborney, G. (1982). An activity-based sleep mon-
itor system, for ambulatory use. Sleep, 5(4):389–399.
KDIR 2019 - 11th International Conference on Knowledge Discovery and Information Retrieval
354
