
A Two-phased Risk Management Framework
Targeting SMEs Project Portfolios
Christophe Ponsard
1 a
, Fabian Germeau
1
, Gustavo Ospina
1
,
Jan Bitter
2
, Hendrik Mende
3
, Ren
´
e Vossen
2
and Robert H. Schmitt
4
1
CETIC Research Centre, Charleroi, Belgium
2
Institute for Management Cybernetics (IfU), Aachen, Germany
3
Fraunhofer Institute for Production Technology (IPT), Aachen, Germany
4
Laboratory for Machine Tools WZL RWTH Aachen University, Aachen, Germany
{jan.bitter, rene.vossen}@ifu.rwth-aachen.de, hendrik.mende@ipt.fraunhofer.de, r.schmitt@wzl.rwth-aachen.de
Keywords: Project Planning, Risk Analysis, Monte-Carlo Simulation, Analytic Hierarchy Process, Risk Minimisation,
Toolset, Case Study.
Abstract:
Managing project risks is challenging for many enterprises, especially smaller ones, because they generally
only have very limited method or tool support, i.e. basic, qualitative and rather short term reaction to the
occurrence of risks. This results in higher vulnerability and reduced competitiveness. This paper proposes a
risk management framework fitting SMEs needs by providing a way to adequately quantify risks and address
them at two levels. First, an Analytical Hierarchy Process (AHP) is used to perform cost-benefit analyses of
the possible mitigation actions assessed through Monte-Carlo simulations. Second, an on-line optimisation
tool is used to make sure the planning is following the minimal risk path and reschedule mitigation action as
soon as a risk has materialised. To address the limited SMEs resources, the core components are provided
as Open Source with a clean application programming interface for easing integration with existing tools. A
reference integration with the Open Source Redmine project management tool is also provided.
1 INTRODUCTION
Small and medium-sized enterprises (SMEs) are driv-
ing the economy worldwide, e.g. in Europe they en-
sure about 66 % of the jobs and generate almost 60
% of the wealth (Muller et al., 2015). Companies are
project-driven, each project being a “temporary en-
deavour undertaken to create a unique product, ser-
vice, or result” (PMI, 2008). Projects have to face
many risks that can cause failures, delays or budget
overruns. Such risks are not restricted to SMEs, but
they can be very harmful or even fatal for SMEs due
to their limited size, maturity, resources, lower adher-
ence to standards, despite a larger flexibility (Ghoba-
dian and Gallear, 1997).
Standards or frameworks for project management
like PRINCE2(Murray, 2009), PMBOK (PMI, 2008)
and ISO31000 (ISO, 2009) are available to correctly
address project risks. However, in SMEs these are
rarely used due to their complexity and lack of flex-
a
https://orcid.org/0000-0002-5027-2114
ibility. Also, SMEs are often not even aware of
the standards’ and frameworks’ existence. In reac-
tion, more specific approaches for SMEs have been
defined and validated: a risk driven methodology
was developed by (Marcelino-S
´
adaba et al., 2014) in-
cluding simple tools, templates and risk check-lists
of including actions and indicators. In the Nether-
lands, Situation Project Management Methodology
(SPMM) which enables to tune the project manage-
ment methodology to the context was experimented
with SMEs (Heupers, 2011). Several lightweight
standards have been defined such as the ISO29110
in the IT sector which is free and comes with use-
ful deployment toolboxes (ISO, 2011). However large
scale surveys reveal that currently available methods
for SMEs mainly focus on the early phases (risk iden-
tification/analysis) and provide incomplete coverage
of the risk mitigation step (Verbano and Venturini,
2013).
This paper summarises the main achievements of
the PRIMa-Q project to address the above mentioned
406
Ponsard, C., Germeau, F., Ospina, G., Bitter, J., Mende, H., Vossen, R. and Schmitt, R.
A Two-phased Risk Management Framework Targeting SMEs Project Portfolios.
DOI: 10.5220/0008119704060413
In Proceedings of the 9th International Conference on Simulation and Modeling Methodologies, Technologies and Applications (SIMULTECH 2019), pages 406-413
ISBN: 978-989-758-381-0
Copyright
c
2019 by SCITEPRESS – Science and Technology Publications, Lda. All rights reserved
shortcomings in project risk management (CORNET,
2016; Ponsard et al., 2017). As part of the COR-
NET program, PRIMa-Q is focusing on methods and
tools for SMEs. The main project goal is to enable
a minimal form of quantitative reasoning and also to
be able to address complex contexts such as multi-
project portfolios, shared resources, and presence of
uncertainties. Important non-functional requirements
for SMEs like usability, learnability and ease of inte-
gration are also considered. Finally, cost of ownership
is also addressed by providing the resulting software
in Open Source with both an application program-
ming interface (API) and a reference implementation
based on the Redmine tool (Lang, 2006).
Our proposed approach actually relies on different
methods and techniques that have demonstrated their
capability to address risks while hiding the implemen-
tation complexity behind a few simple concepts. Our
focus is the risk mitigation phase, so we assume that
basic project management and risk identification sup-
port are available (as fall-back such functionalities are
present in our reference implementation). Our ap-
proach is considering two levels of risk management:
1. Quantified guidance to help in selecting the best
mitigation action(s). Such actions are captured in
a knowledge base of measures. Their impact on a
specific (set of) running project(s) is assessed us-
ing a cost-benefit model using an Analytic Hier-
archy Process (AHP) for decision making (Saaty,
2000; Saaty, 2008). In order to quantitatively as-
sess the effect of each action, a Monte-Carlo sim-
ulation method is used (Zio, 2013) based on our
past experience (Landtsheer et al., 2016).
2. Guidance is also provided in the planning phase.
We consider here project tasks, resources and
dependencies but also the effect of risk miti-
gation action on planning like providing time
buffer for some risky tasks, increasing the avail-
ability of specific highly demanded/scarce pro-
files/equipment. The provided support is rely-
ing on online optimisation techniques based on
an efficient constraint-based local search (OscaR,
2012; Ponsard et al., 2019), which means it will
constantly adapt to manually added decisions or
to external factors like the materialisation of ex-
pected or unexpected risks.
This paper is structured as follows. Section 2 ex-
plains our method using a detailed workflow. Then
Section 3 presents the architecture of the developed
tooling. Section 4 performs a validation and discus-
sion on a project derived from a real case. Finally,
Section 5 concludes and presents our future work.
2 PROPOSED APPROACH
This section first gives a general overview of the
workflow before more detailed descriptions follow.
2.1 Workflow
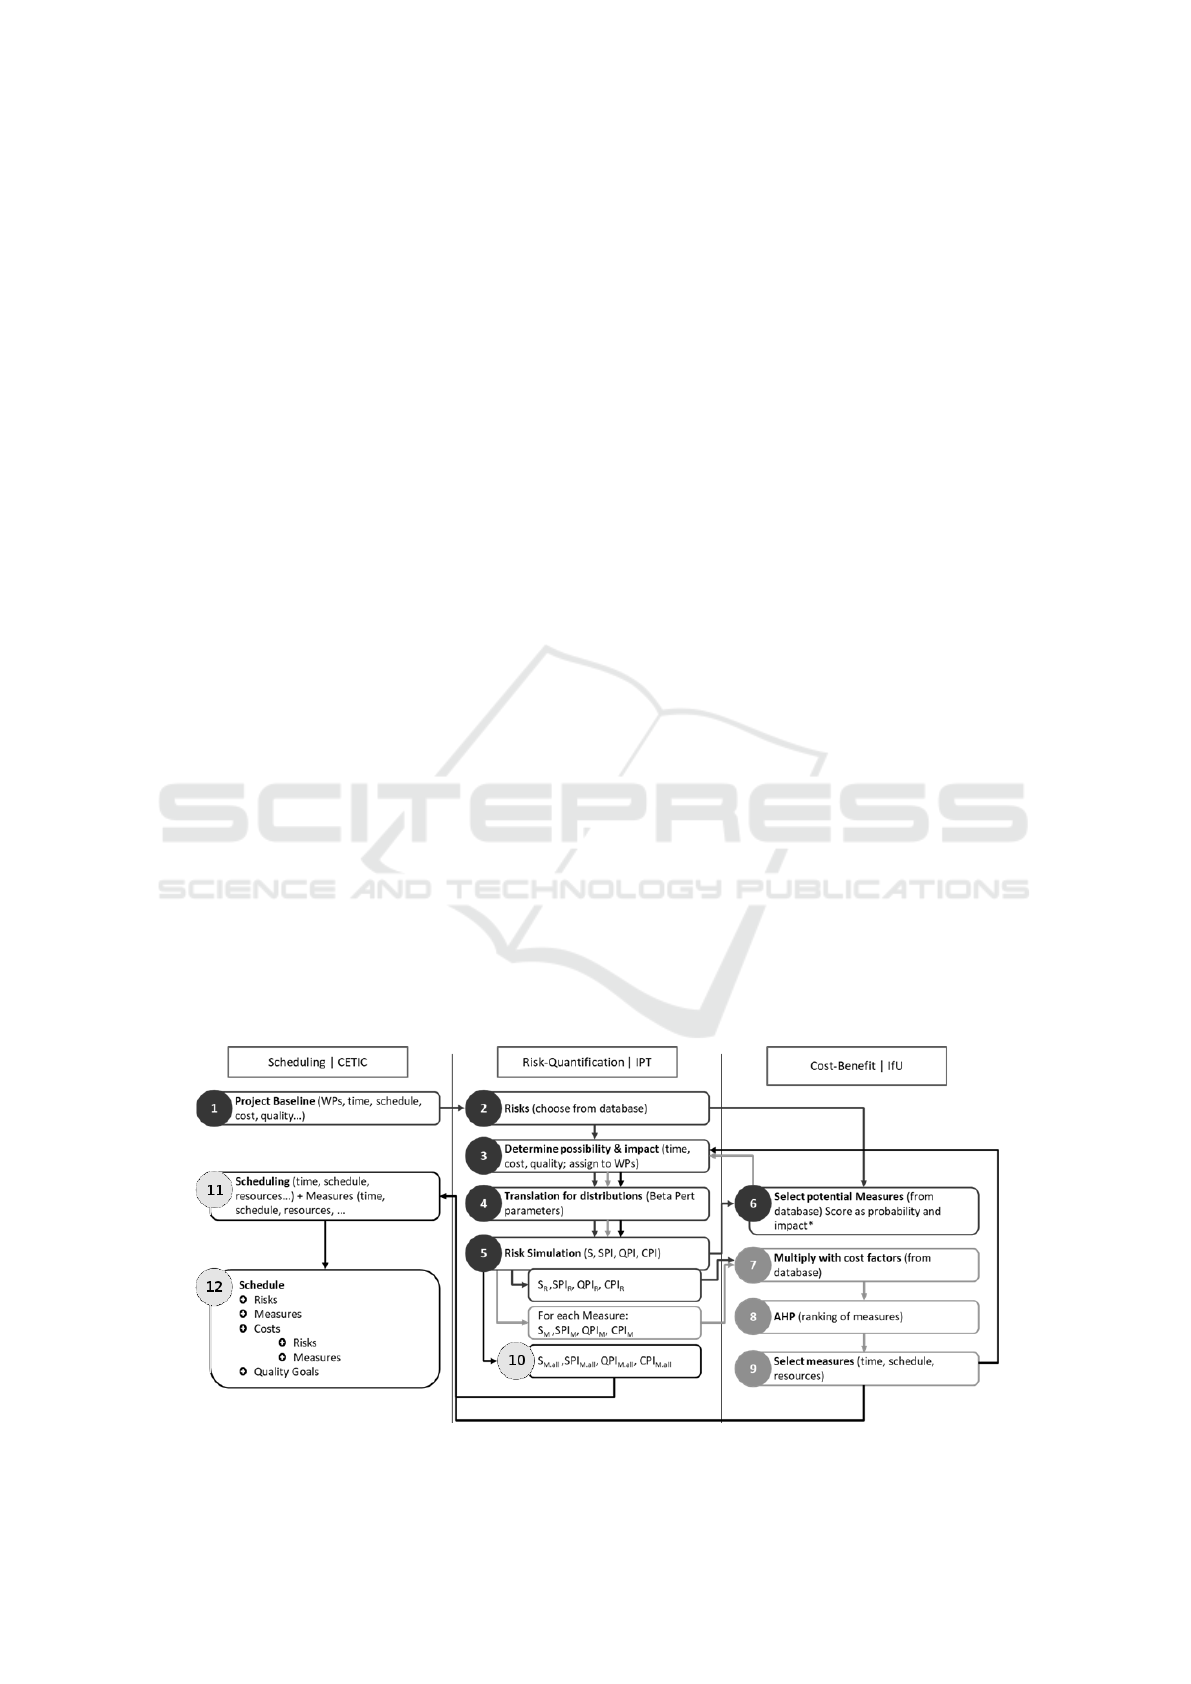
The proposed risk management workflow is depicted
in Figure 1. It is divided into three main parts
grouping specific components developed by the col-
laborating parties: the scheduling engine (includ-
ing database), the quantification framework and cost-
benefit modelling. Furthermore, the interface is di-
vided into three parts. Steps 1 to 6 represent the
risk simulation. Steps 7 to 9 stand for the simulation
of measures counteracting risks. Step 10 to 12 rep-
Figure 1: Quantified risk management workflow.
A Two-phased Risk Management Framework Targeting SMEs Project Portfolios
407
resents the subsequent scheduling including the se-
lected measure(s).
The workflow can be described as follows. First
(1), the project is described through its time, planning,
costs, quality and work packages. This information is
captured using existing tools or through the forms of
our reference implementation.
Based on this information, possible risks that may
occur are identified in (2). These risks can either be
taken from the existing database or added individu-
ally. In (3), the possible effects of the identified risks
on e.g. time, cost and quality are determined. As a
first step for the following simulation, the determin-
istic effects are translated into a specific parametric
probability distribution in (4). These parameters form
the basis of the following Monte-Carlo simulation.
This Monte-Carlo simulation takes place in (5).
There, success indexes are computed. Those are de-
tailed later but reflect the classical project triangle
about time/cost/quality. On the basis of the selected
risk, possible measures that act against this risk are
identified in (6). These can also be taken from the
ready-made database. The blue arrow that connects
(6) to (3) makes it clear that the cycle described above
is now starting again. First, the possible effects of the
measures are determined and then translated into β-
PERT parameters. Subsequently, a Monte-Carlo sim-
ulation is carried out again for each individual mea-
sure to provide estimated of all success indices.
These values are multiplied by the cost factors
from the database in (7). In the subsequent AHP,
these weighted values are evaluated and ranked in (8).
This ranking indicates which of the measures should
best be implemented taking into account the factors
of cost, time and quality. In (9), one or multiple risk
treating action(s) is/are selected based on the cost-
benefit model for the specific risk and project. This
process is detailed later in this section and forms the
first level of our guidance.
The selected action(s) are implemented inside the
project. The combination of risks and selected mea-
sure(s) runs through the simulation again, as indicated
by the black arrow connecting (9) and (3). The result-
ing values of the success indexes (10) are then used
for the planning phase (11). During this phase, resid-
ual risks are also considered using scheduling tech-
niques. Those last steps compose the second level of
our guidance and are detailed later in this section.
2.2 Step 1: Modelling Project and Risk
A mandatory step for any structured and quantita-
tive approach to reason on project and risk is to have
a clear model of those concepts. For this purpose
we developed a joint meta-model already sketched in
(Ponsard et al., 2019) and which is refined here. It is
composed of two overlapping views.
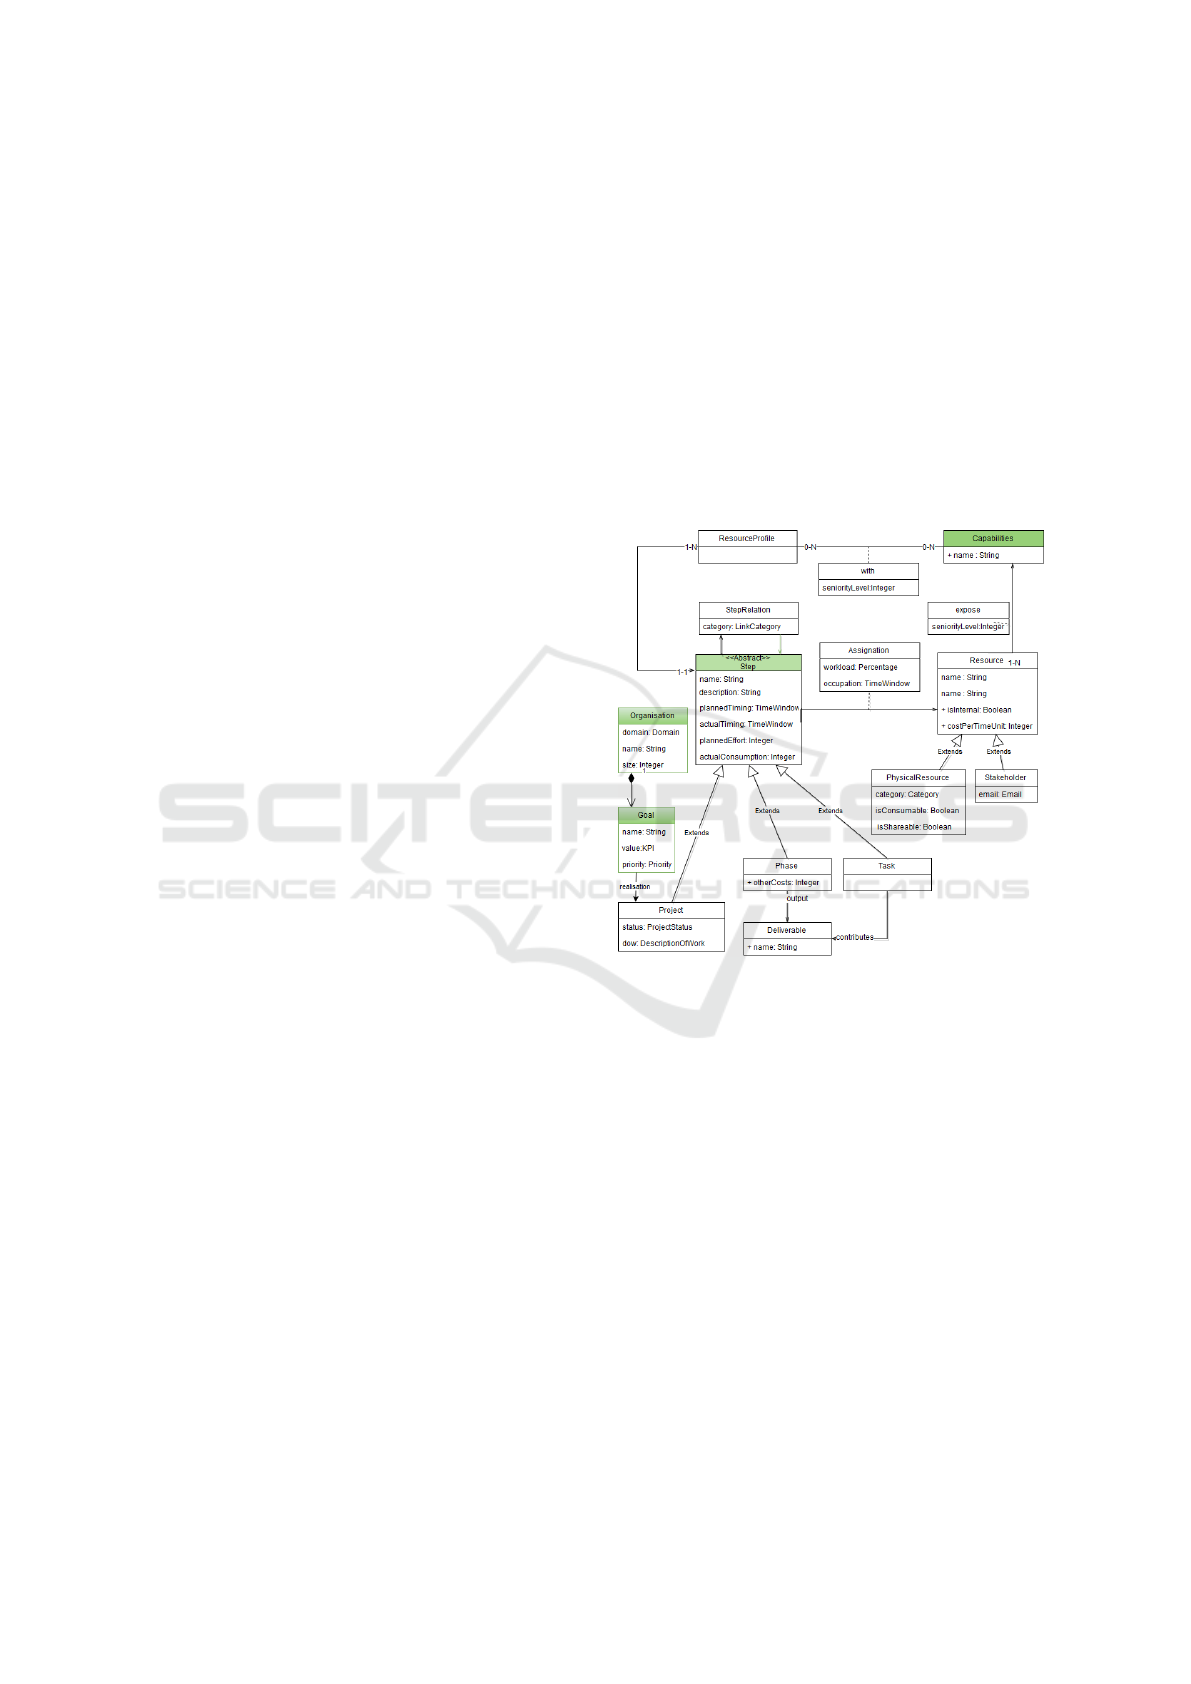
The project view is depicted in Figure 2 and has
two main concepts: Step and Resource. A step is
an abstraction of a whole project or phase or task de-
pending the required level(s) of granularity and mul-
tiple levels are also supported. Each step has several
information such as due date, planned effort. In ad-
dition to refinement. Steps can also have other rela-
tions like the classical precedence. They also require
one or many Resources characterised by their Capa-
bilities. A Resource can be a Physical Resource or a
Stakeholder.
Figure 2: Project part of the meta-model.
Figure 3 shows the risk part. A risk obstructs
a Goal and has some Impact with some likelihood.
The Impact can be mitigated by some Action to by
applied at a specific Step and which will restore
some Goal. A classification of Constraints related to
cost/quality/delay issues is available and are directly
related with some Impacts. This will help to guide the
selection of mitigation Actions.
The meta-model is instantiated inside a knowl-
edge base which is populated with different risks and
measures. The following classification has been es-
tablished based on a literature review and validation
with a set of companies involved in the project:
• Scope Risks: new requirements, strategic change.
• Scheduling Risks: duration, dependencies.
• Resource Risks: capability and availability.
• Technology Risks: related to hardware and soft-
ware availability, reliability, security issues.
SIMULTECH 2019 - 9th International Conference on Simulation and Modeling Methodologies, Technologies and Applications
408
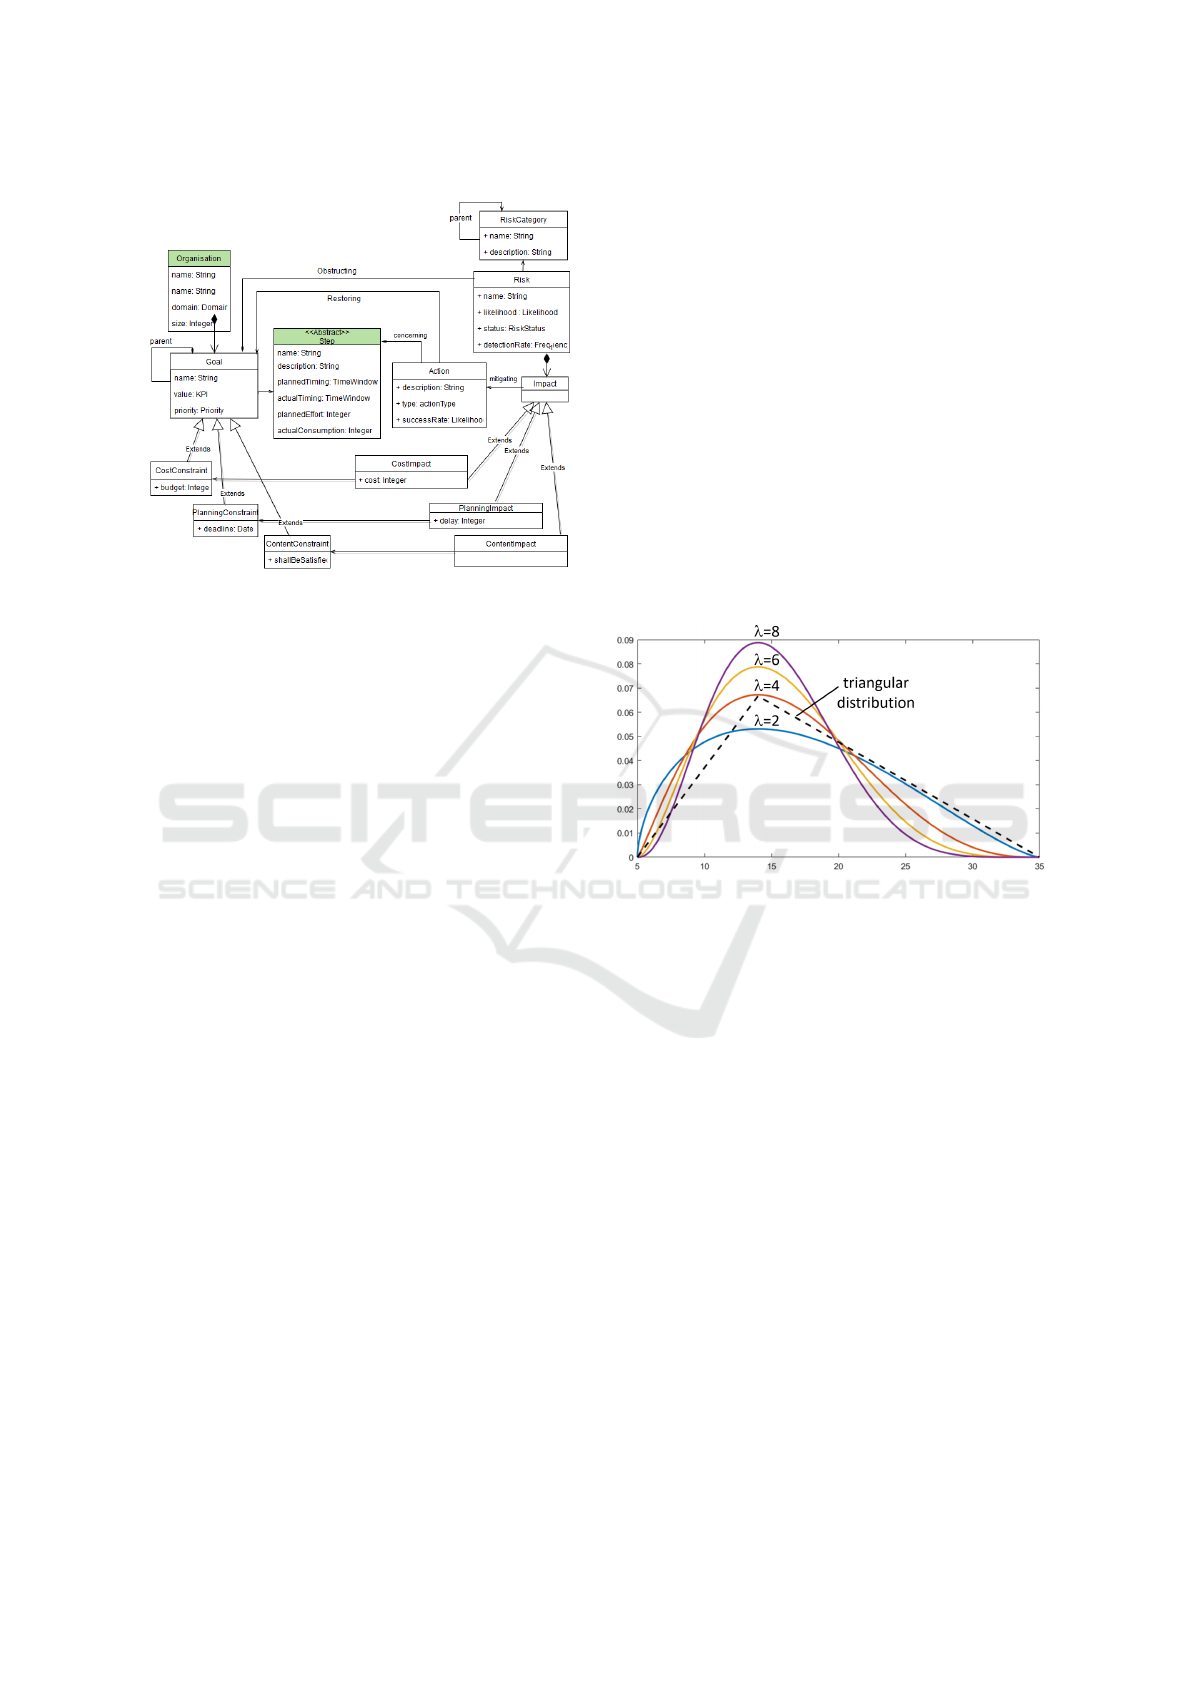
Figure 3: Risk part of the meta-model.
• Environment risks, e.g. government, market, etc.
• Management risks, e.g. organisation complexity,
available skills, bureaucracy.
2.3 Steps 2-5: Quantification and
Simulation of Risks
Another preliminary to achieve our objective of risk
mitigation is to adequately quantify project risks. Our
quantification approach is based on a few Key Perfor-
mance Indicators for the project success. These indi-
cators are successful if greater or equal to one. The
closer to zero, the larger the failure.
• Schedule Performance Index (SPI) targets the time
dimension, i.e. how close the actual (total) time
is compared to the planned (total) time from the
Schedule-Cost Baseline. The actual time is mod-
elled as a random variable resulting from the sum
of the time duration for individual project steps on
the critical path. The SPI is computed as the ratio
planned vs actual time.
• Cost Performance Index (CPI) follows a similar
approach, i.e. by comparing the planned (total)
costs of the cost baseline with the actual costs. It
is also modelled as a random variable. The total
costs include all costs and are independent of the
critical path. The CPI is computed as the project
budget divided by the actual costs.
• Quality Performance Index (QPI) is more sophis-
ticated. It is regarded as a combination of all ob-
jectives which do not represent explicit budget or
deadline targets in order to provide a holistic view
of risks. It is composed of basic, performance and
enthusiasm characteristics which can also directly
be related to different goals of the organisation.
Satisfaction metrics are used to quantify and ag-
gregate those dimensions resulting on a scale from
0 (complete failure) to 1 (total success) in all di-
mensions.
Those indicators can be measured on actual
projects but also estimated on model simulations.
Most parameters are of stochastic nature (task dura-
tion, resource availability, quality of a result) and are
modelled using probabilistic distributions. Such dis-
tributions are a way to quantify risks partly and in-
volve some subjectivity in the choice. To keep the
model simple, we rely on the parametric modified β-
PERT distribution depicted in Figure 4. It uses an in-
tuitive three-point estimation of continuous variables
and as proven very useful to capture expert opinions
(Vose, 2008). In addition, the Bernoulli distribution is
used to model discrete variables.
Figure 4: Modified beta-PERT distribution.
Using the Monte-Carlo technique, a large number
of discrete event simulations can be computed to es-
timate the probability distribution of the above indi-
cators and to quantify the risk of failure given some
acceptable threshold, e.g. in 95% of the case, we will
be on-time. Figure 5 shows the computed distribu-
tions for SPI, CPI and QPI, with a lower resolution
for the latter. The values corresponding to the target
probability threshold are also depicted.
Note that computing the global success requires
carefulness given some dimension might not be inde-
pendent. To cope with this, the Sobol index is used
in addition of the above indexes. The Sobol index ex-
presses the possible variance reduction of the overall
result if an input variable is assumed to be safe. A
variance reduction means that the possible results of a
target expression can be narrowed down, i.e. the tar-
get expression has a lower risk in the sense of reduced
variability. Consequently the Sobol index is an appro-
priate measure for assessing the impact of individual
risks. The global success S aggregates the result of
each simulated project using formula 1.
A Two-phased Risk Management Framework Targeting SMEs Project Portfolios
409
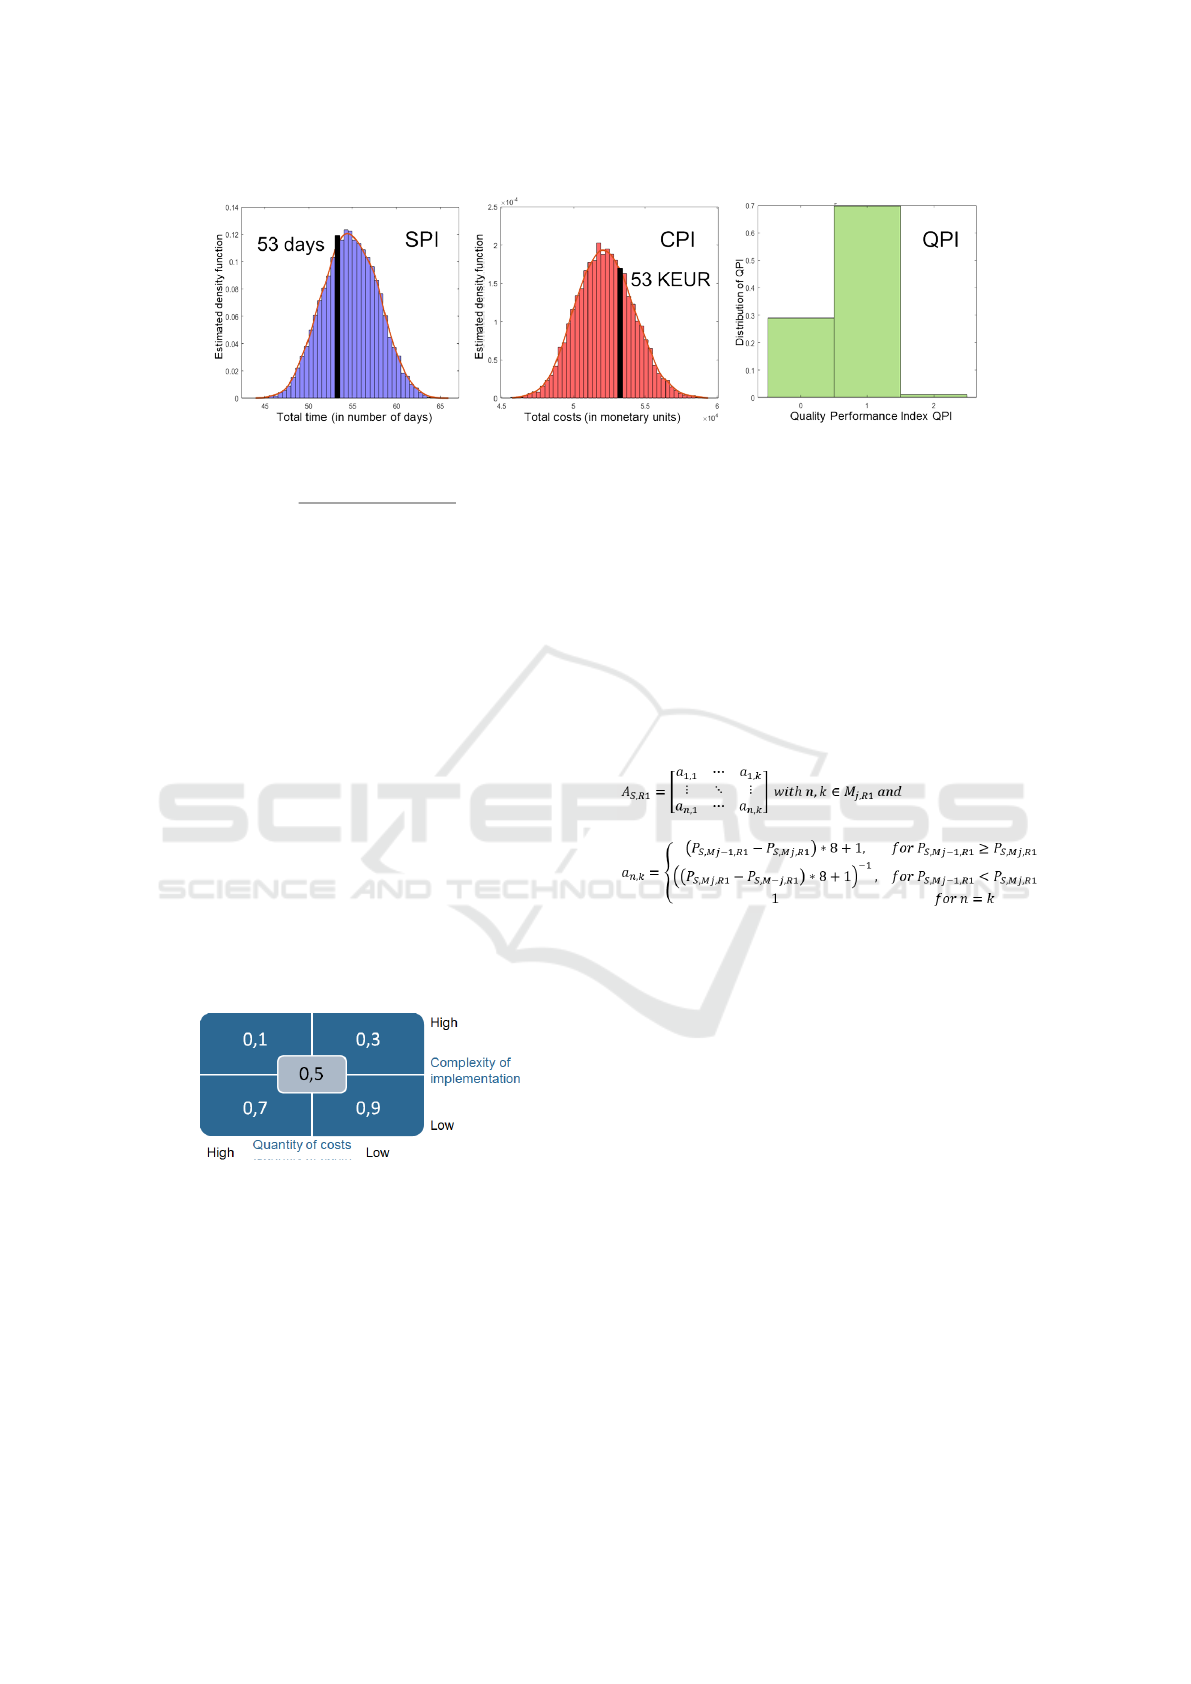
Figure 5: Distributions resulting from the Monte-Carlo simulations.
S =
# successful project
# projects
(1)
2.4 Steps 6-9: Mitigation Action
Selection
Our approach is to contrast the benefits of re-
duced/mitigated/eliminated project risks with the
costs of conducting specific risk-treating measures. It
is based on an AHP, a multi-criteria-decision-analysis
(MCDA) technique. It facilitates a structured compar-
ison, ranking and thus decision regarding measures,
based on multiple criteria which are S, SPI, CPI and
QPI in our case.
In order to improve usability and allow for quali-
tative expert inputs, each cost factor is based on two
dimensions: quantity of costs and complexity of im-
plementation, which can each be divided into discrete
sets: e.g. low, middle and high. Each combination of
values for the dimensions is accompanied by a numer-
ical cost factor, that allows further processing. The
resulting cost factor matrix is shown in Figure 6.
Figure 6: Cost factor matrix.
The AHP pre-processing is as follows:
• Step 6 - the primary input is a list of potential risks
and potential treating measures. For each mea-
sure, the database contains the probability of suc-
cess, quantity of impact, effect on risk probability
and on risk impact as well as the cost factors.
• Output of Step 5 - those inputs refined into our S,
SPI, CPI and QPI indexes using the quantification
approach presented in the previous section.
• Step 7 - indexes are multiplied by the cost fac-
tor resulting in P
S
, P
SPI
, P
CPI
and P
QPI
parameters
which are the real inputs for the AHP.
A default additional measure “No action” with no
effect and cost factor 1 is also always considered.
Within the AHP approach (step 8), the potential
measures are pairwise compared for each parameter
P
S
, P
SPI
, P
CPI
and P
QPI
. Therefore, the distance be-
tween the parameter values of two measures is calcu-
lated and normalized on a scale between 1 and 9 using
the equations detailed in Figure 7 (Saaty, 2000).
Figure 7: AHP pairwise comparison computation.
This leads to four n x n matrices (for P
S
, P
SPI
, P
CPI
and P
QPI
). Computation of their Eigenvectors pro-
duce a percentage-based ranking of measures for each
parameter. The rankings of each index must then be
combined. Within the project, all parameters were as-
signed the same weight. However, different weights
could be used to stress more on specific dimensions.
The final result (step 9) is a global ranking of mea-
sures from the most effective to the least effective.
2.5 Steps 10-12: Risk-aware Scheduling
The selected actions are applied to the model and a
final simulation is run to retrieve the actual risk pa-
rameters (step 10). The resulting schedule can then be
computed (step 11). This step can also address risks
that were not fully solved by the previous AHP pro-
cess because scheduling risks are only covered by a
restricted subcategory of the risk database. More spe-
cific heuristics are applied here to address schedule
impacting risks such as:
SIMULTECH 2019 - 9th International Conference on Simulation and Modeling Methodologies, Technologies and Applications
410
• Tasks with poor estimation of scope or feasibility.
• Tasks potentially impacting many dependent
tasks.
• Tasks involving many resources or unreliable or
scarce resources.
• Complex portfolios with several parallel projects.
Examples of heuristics have been investigated using
efficient optimisation tools like (OscaR, 2012) and
(Smet, 2006) and are reported in (Ponsard et al.,
2019).
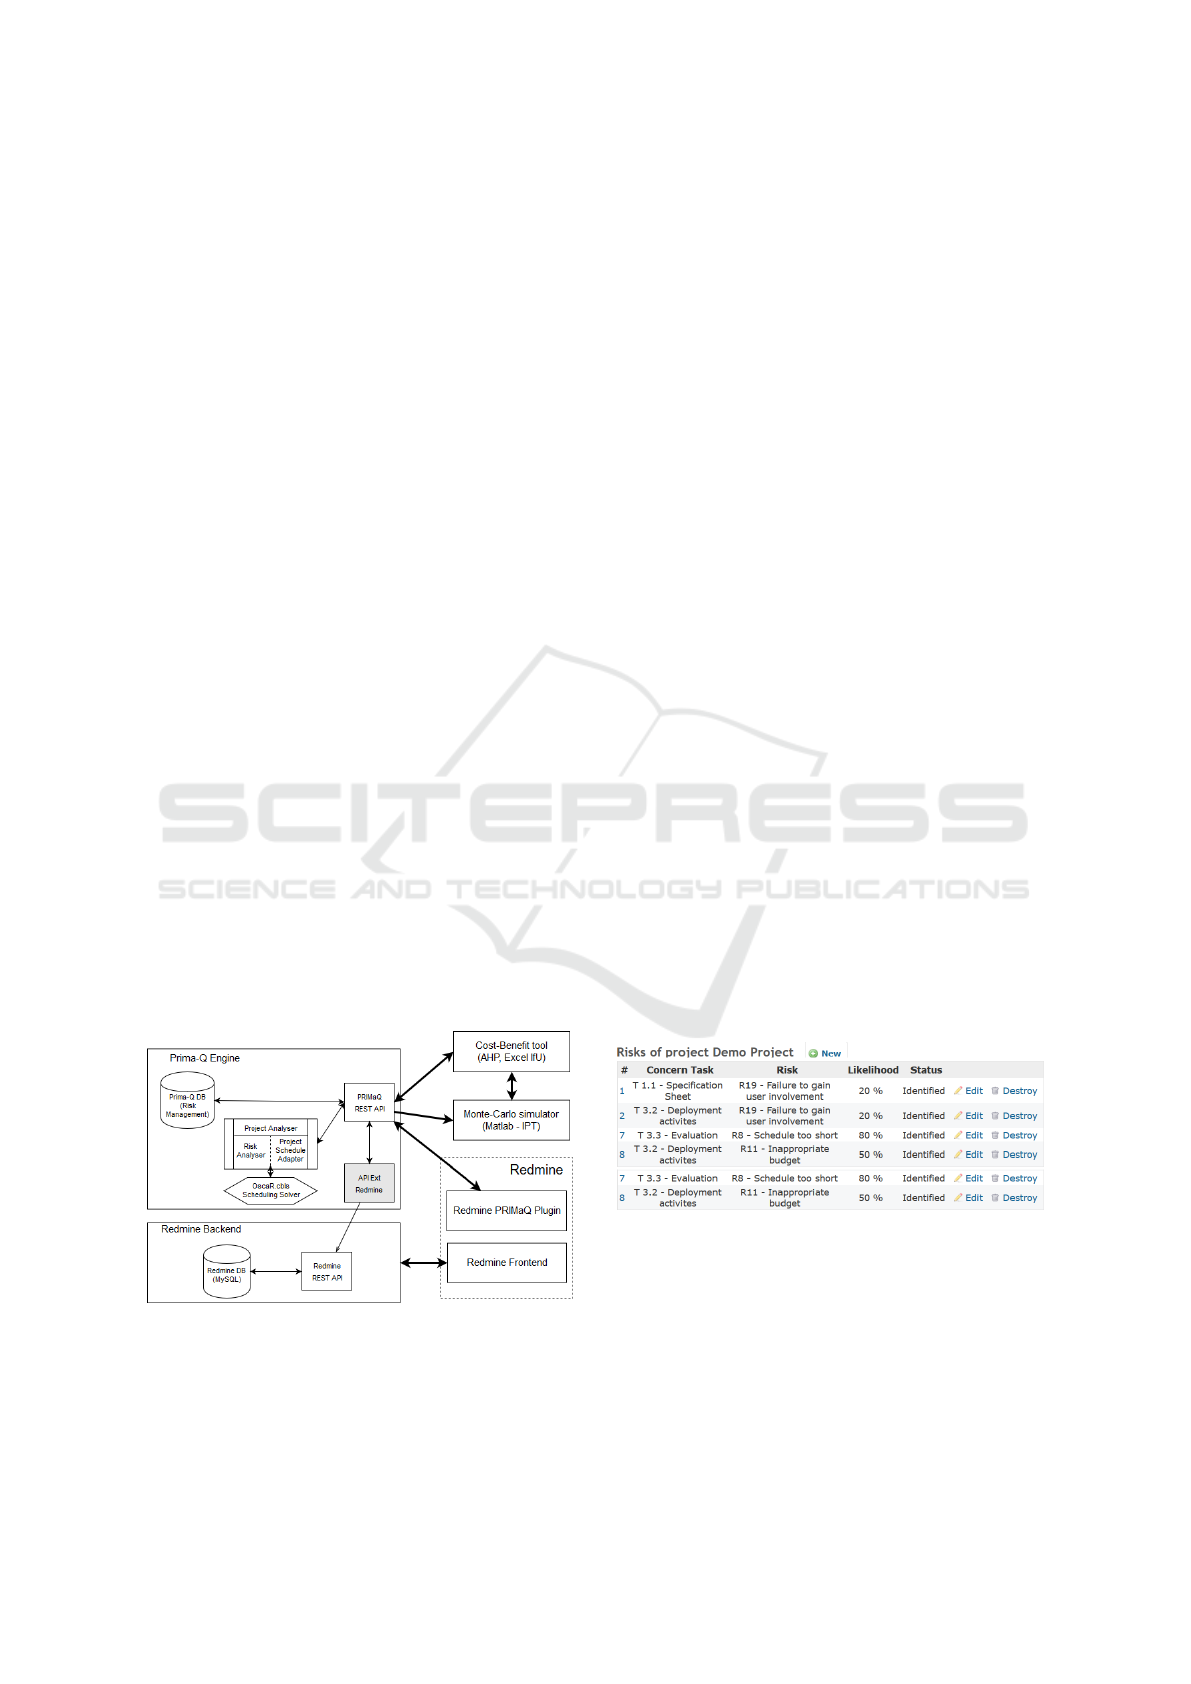
3 TOOL IMPLEMENTATION
The global architecture of our tooling is shown in Fig-
ure 8. It is composed of:
• The PRIMa-Q core engine containing a relational
database reflecting our conceptual model and a re-
lated web-based interface for easing the connec-
tion with existing platforms, e.g. JIRA or Trello.
Specific adaptors can be developed to synchronise
project and/or risk data. The core engine also in-
cludes a scheduling capability based on the Oscar
optimisation library (OscaR, 2012).
• A reference implementation based on the Red-
mine platform (Lang, 2006). It illustrates an inte-
gration scenario with the back-end repository and
a specific front-end plugin to provide a full user
interface for driving the risk management process
and presenting the resulting schedule.
• The AHP (Excel-based) cost-benefit tool (Goepel,
2013) relying on Monte-Carlo engine (Matlab-
based). Both can access their data through the
web-service API.
Figure 8: Tool architecture.
The implementation is easy to deploy on a server
or a local virtual machine running Linux. An online
demonstration is accessible from the following URL:
http:\\prima-q.cetic.be.
4 VALIDATION CASE STUDY
4.1 Description
Our case is a R&D project spanning over two years
and composed of five main work packages each typ-
ically composed of three to five tasks. The project
involved about ten researchers (not simultaneously)
from three organisations located in two countries.
Although the project was designed to be run in an
agile mode, a number of dependencies were identi-
fied such as the requirements backlog (WP1) must be
finished before starting the design (WP2) and contin-
uous validation (WP5). Ending specific WP2 tasks is
also mandatory for starting some WP4 implementa-
tion tasks.
Resources were only specified as overall effort per
task and partner. The actual allocation needs to be
done on the basis of available people with a profile
matching the task needs (e.g. an analyst for the re-
quirements or a developer for the software coding).
Typical risks to be addressed are:
• A few key experts simultaneously required on
multiple projects resulting in delays.
• Poor estimation of real task duration due to tech-
nological risk or integration issues.
• Validation delayed due to external causes like
poor user involvement.
4.2 Capturing Project and Risk Data
The provided implementation contains a complete set
of forms (about 20) to create/read/update/delete infor-
mation related to projects and risks. Figure 9 shows a
key screen where a risk can be linked to a task.
Figure 9: Form to associate risks to project tasks.
Figure 10 details a specific risk related to the fail-
ure to gain user involvement. Different impacts are
estimated about quality, usability or delay resulting
from missing requirement. Based on them, a number
of measures are specified such as education, steering
committee involvement or gathering requirements us-
ing other channels. Estimates about effectiveness of
each measure are also captured.
A Two-phased Risk Management Framework Targeting SMEs Project Portfolios
411
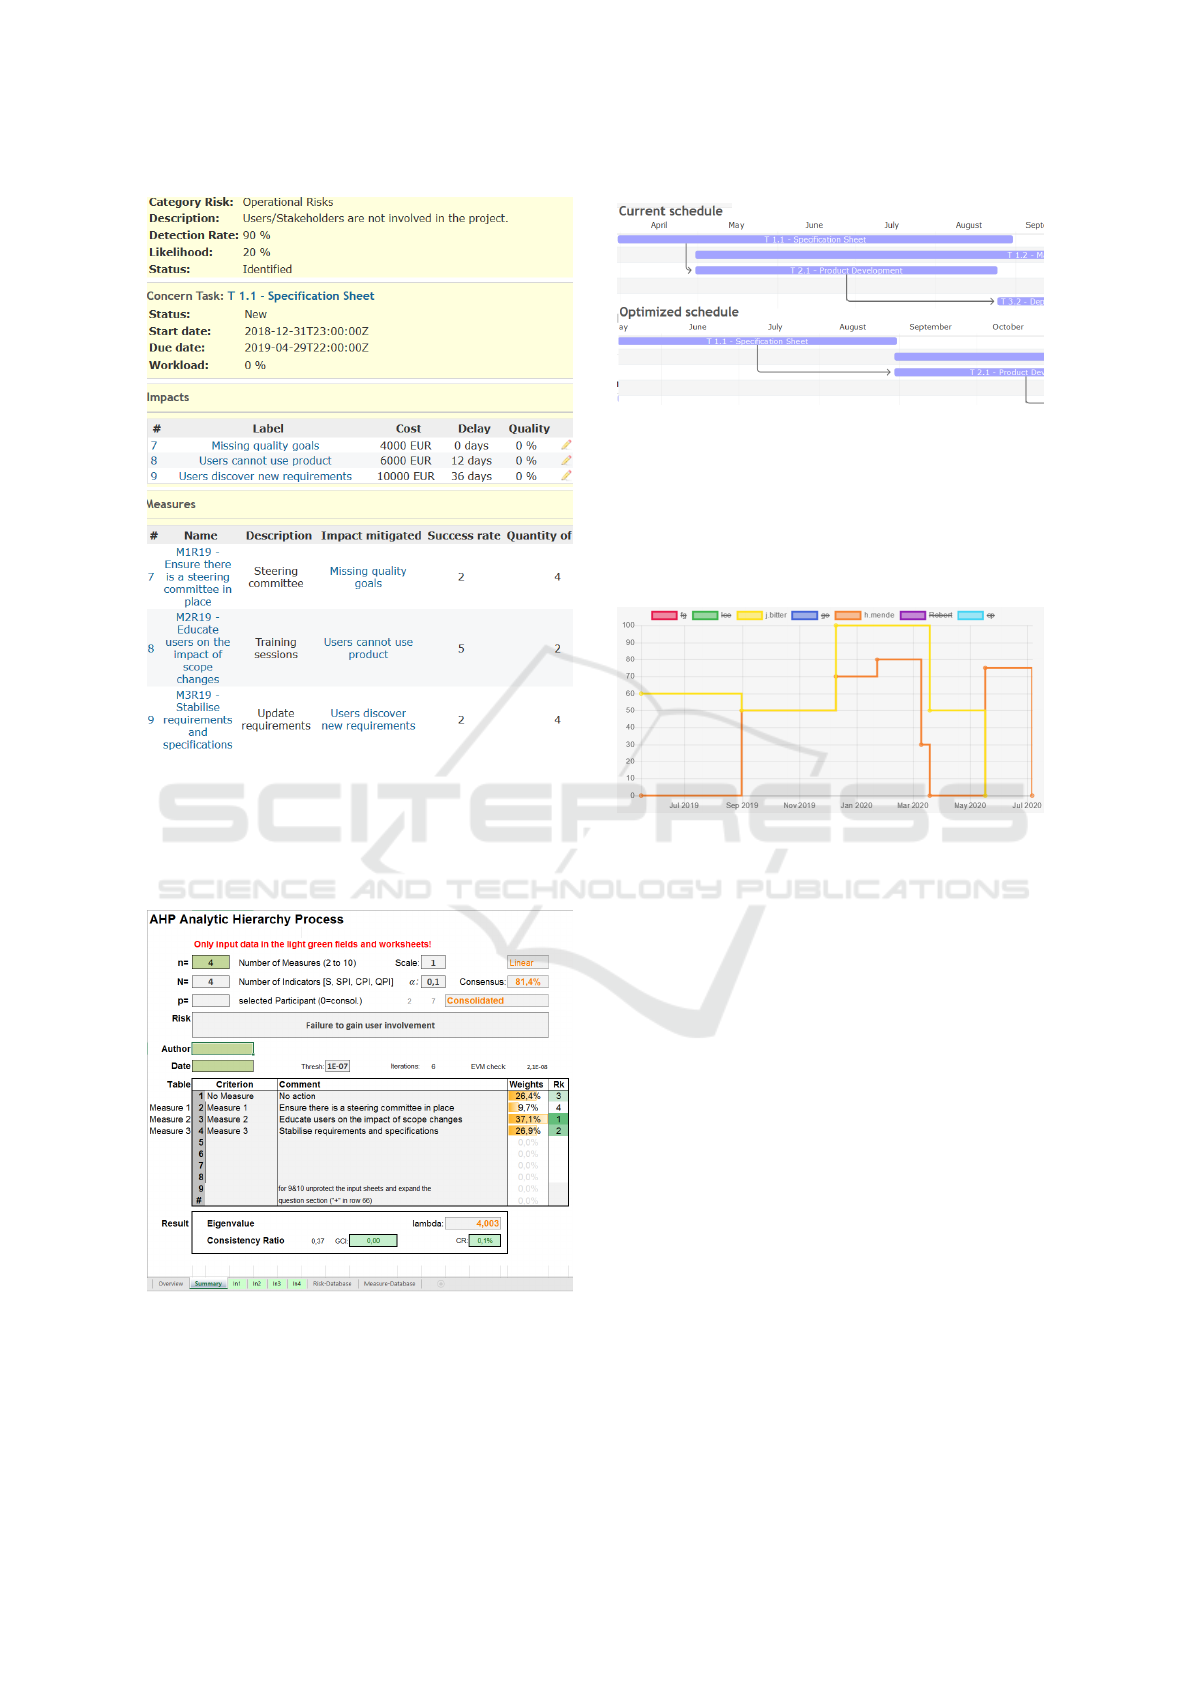
Figure 10: Form to identify risks impacts and measures.
Figure 11 shows that the AHP recommends ac-
tion 2 about education over requirements improve-
ment and no action. Those rank almost the same while
enabling the steering committee is less effective.
Figure 11: AHP pairwise comparison computation.
Figure 12 represents the initial and final Gantt pro-
duced by our scheduling tool. It shows the main de-
pendencies and we can see T2.1 is planned after the
end of T1.1 due to such a dependency.
Figure 12: Initial and optimised Gantt.
Note that T1.2 is also postponed until the end of
T1.1 but in this case due to a resource issue on a
common resource (j.bitter) which is a bottleneck here.
This is also visible in Figure 13 as the resource is al-
located 60 % then 50 % which rules out a parallel
allocation because it would result in 110 % load.
Figure 13: Resource load.
4.3 Performance Assessment
The global performance of the involved tools is as fol-
lows:
• The Monte-Carlo simulation requires N+1 simu-
lation of risks: one for each measure and a final
one for the selected set of measures. In order to
produce a precise approximation of the probabil-
ity distributions, enough simulations must be run,
around 1000 in practice. This results in compu-
tation times of about a few seconds on a laptop
(single core of an I7 Intel CPU). The whole pro-
cess takes under a minute.
• The selection of measures involves some tricky
matrix computation. The current Excel imple-
mentation is able to solve it within seconds on the
same configuration.
• The final planning generation step used the Os-
caR.CBLS local search solver. There is no guar-
antee to find the optimum but the stop criteria can
be configured to reach a good balance between
search time and quality. In practice, near optimal
schedules can be produced in about 20 seconds for
moderately complex projects (i.e. about 30 tasks)
SIMULTECH 2019 - 9th International Conference on Simulation and Modeling Methodologies, Technologies and Applications
412

and using a virtual machine with a computation
power similar to the above end-user configuration.
Globally the whole process is compatible with an in-
teractive use of the tooling and allows the user to wait
for answers, analyse results, perform manual adap-
tations like reassessing some impacts, introducing
additional mitigation actions, changing some tasks,
adding resources, etc. After this a new risk analysis
process take place until the user is confident the risks
are adequately mitigated.
5 CONCLUSIONS AND NEXT
STEPS
This short paper has reported about our work to pro-
vide a tool-supported methodology for helping SMEs
to move towards a more quantitative approach for risk
management. Our approach provides a modelling ref-
erence, risk classification, tooling for measure selec-
tion and for the planning phase. The whole frame-
work is provided as Open Source with a SaaS refer-
ence implementation available online. Our validation
so far is still limited but we could involved a handful
of end-user manufacturing companies and software
editors which helped to improve usability and to ease
the integration.
Our future work aims at providing integrated ser-
vices within our core platform for computing the AHP
and Monte-Carlo simulations. We also plan to start
collecting more data to enable some form of learning
of risks to enrich the available knowledge base and
increase the risk coverage. Specific cases are being
discussed and relates to enterprise architecture, agile
project management and project requirements engi-
neering.
ACKNOWLEDGEMENTS
This project was partly funded by the Belgian Wal-
loon ePick (7570) and PRIMa-Q (1610088) projects.
On the German side PRiMa-Q (IGF-No. 183 EN)
was funded by the AiF within the framework of the
program for the promotion of industrial joint research
and development (IGF) of the Federal Ministry of
Economic Affairs and Energy on the basis of a res-
olution of the German Bundestag. We also thank our
user committees for their collaboration and feedback.
REFERENCES
CORNET (2016). PRIMa-Q - Project Risk Management -
A Quantitative Approach. http://prima-q.eu.
Ghobadian, A. and Gallear, D. (1997). Tqm and organi-
zation size. International Journal of Operations &
Production Management, 17(2):121–163.
Goepel, K. D. (2013). Implementing the Analytic Hierarchy
Process as a Standard Method for Multi-Criteria De-
cision Making In Corporate Enterprises. A New AHP
Excel Template with Multiple Inputs. In Proc. of the
Int. Symposium on the Analytic Hierarchy Process.
Heupers, E. (2011). Towards Situational Project Manage-
ment Method Engineering for SMEs. MsC, University
of Twente.
ISO (2009). Risk management – principles and guidelines.
ISO 31000.
ISO (2011). Software engineering - lifecycle profiles for
very small entities (vses). ISO 29110.
Landtsheer, R. D. et al. (2016). A Discrete Event Simula-
tion Approach for Quantifying Risks in Manufactur-
ing Processes. In Int. Conf. on Op. Research and En-
terprise Systems (ICORES), Rome, 23-25 February.
Lang, J.-P. (2006). Redmine flexible project management
web application. https://www.redmine.org/.
Marcelino-S
´
adaba, S. et al. (2014). Project risk manage-
ment methodology for small firms. Int. Journal of
Project Management, 32(2):327 – 340.
Muller, P. et al. (2015). Annual Report on European SMEs
- SMEs start hiring again. European Commission.
Murray, A. (2009). Managing successful projects with
PRINCE2. TSO, Norwich.
OscaR (2012). OscaR: Scala in OR. https://bitbucket.org/
oscarlib/oscar.
PMI (2008). A Guide to the Project Management Body of
Knowledge (PMBOK). Project Management Institute.
Ponsard, C. et al. (2017). PRIMa-Q - Towards a More
Quantitative Approach in Project Risk Management
by SMEs. In Challenges and Opportunities in ICT
Research Projects - Vol 1: EPS Madrid,. SciTePress.
Ponsard, C., Germeau, F., and Ospina, G. (2019). To-
wards Risk-aware Scheduling of Enterprise Architec-
ture Roadmaps. 21st Int. Conf. on Enterprise Infor-
mation Systems (ICEIS), Heraklion, 3-5 May.
Saaty, T. (2000). Fundamentals of the Analytic Hierarchy
Process. RWS Publications.
Saaty, T. (2008). Decision making with the analytic hierar-
chy process. Int. J. Services Sciences, 1:83–98.
Smet, G. D. (2006). OptaPlanner Open Source Constraint
Solver. http://www.optaplanner.org.
Verbano, C. and Venturini, K. (2013). Managing Risks in
SMEs: A Literature Review and Research Agenda.
Journal of Tech. Management & Innovation, 8(3).
Vose, D. (2008). Risk Analysis: A Quantitative Guide. Wi-
ley.
Zio, E. (2013). The Monte Carlo Simulation Method for
System Reliability and Risk Analysis. Springer, Lon-
don.
A Two-phased Risk Management Framework Targeting SMEs Project Portfolios
413
