
A Synergistic Approach to Enhance the Accuracy-interpretability
Trade-off of the NECLASS Classifier for Skewed Data Distribution
Jamileh Yousefi
1
, Andrew Hamilton-Wright
2
and Charlie Obimbo
2
1
Shannon School of Business, Cape Breton University, Sydney, NS, Canada
2
School of Computer Science, University of Guelph, Guelph, ON, Canada
Keywords:
Fuzzy, Discretization, Neuro-fuzzy, Classification, Skewness, NEFCLASS, Rule-pruning, Adjusted residual,
EQUAL-WIDTH, MME.
Abstract:
NEFCLASS is a common example of a neuro-fuzzy system. The popular NEFCLASS classifier exhibits sur-
prising behaviour when the feature values of the training and testing datasets exhibit significant skew. This
paper presents a combined approach to improve the classification accuracy and interpretability of the NEF-
CLASS classifier, when data distribution exhibits positive skewness. The proposed model consists of two steps.
Firstly, we used an alternative discretization method to initialize fuzzy sets. Secondly, we devised a statistical
rule pruning algorithm based on adjusted residual to reduce the number of rules, thus improving interpretabil-
ity. This method improves the interpretability of NEFCLASS without significant accuracy deterioration. More-
over, a hybrid approach combining the two approaches is developed to increase the accuracy-interpretability
trade-off of NEFCLASS.
1 INTRODUCTION
Skewness is a numerical measure which indicates
whether data distribution is symmetric or not. Skewed
feature values are commonly observed in biological
and medical datasets. Addressing skewness in medi-
cal diagnosis systems is vital for finding rare events,
such as rare diseases (Gao et al., 2010). Most ma-
chine learning algorithms perform poorly on skewed
datasets (Ben-Gal, 2010). This poses a challenge for
the classification of medical data.
Data distributions in the majority of machine
learning algorithms, when they are discussed at all,
are generally expected to have a symmetric distribu-
tion with a central tendency, if not a normally distri-
bution (Ben-Gal, 2010; Mueller and Massaron, 2016).
For example, approaches based on Maximum Like-
lihood and Minimum Distance depend on the as-
sumption of a multivariate Gaussian distribution of a
dataset (Marapareddy et al., 2017). Neural networks
don’t have a priori assumption about the data distribu-
tion (Gupta, 2016). Support Vector Machines (SVMs)
do not assume normality assumption but the SVMs
based on smooth loss functions enjoy an asymptotic
normality (Hable, 2012). Naive Bayes classifier de-
pends on the assumption of a normal distribution for
numerical variables. Another example is the NEF-
CLASS classifier, which uses the EQUAL-WIDTH dis-
cretization method. The EQUAL-WIDTH discretiza-
tion method provides a feature value density indepen-
dent map of input space.
NEURO-FUZZY systems are common machine
learning approaches in the medical domain because of
their ability to learn fuzzy rules from training data and
represent the rules in an understandable way. There-
fore, addressing skewness in neuro-fuzzy systems is
a topic of interest because of their applicability in the
medical domain.
In this work, the NEFCLASS classifier is ex-
tended to provide improved accuracy-interpretability
trade-off over the original NEFCLASS classifier when
trained on skewed data. In order to improve accu-
racy, we used an alternative discretization method.
Additionally, we devised a statistical rule pruning
algorithm which prunes the rules based on a mea-
sure of statistical significance when measured by ad-
justed residuals. Moreover, a hybrid approach com-
bining the two approaches is proposed to enhance the
accuracy-interpretability trade-off of NEFCLASS.
We provide a study based on an easily repro-
ducible synthetic data distributions, in order to allow
deeper insights into the data analysis. We evaluated
the accuracy of the classifiers using misclassification
percentages, and the transparency of the rule-based
Yousefi, J., Hamilton-Wright, A. and Obimbo, C.
A Synergistic Approach to Enhance the Accuracy-interpretability Trade-off of the NECLASS Classifier for Skewed Data Distribution.
DOI: 10.5220/0008072503250334
In Proceedings of the 11th International Joint Conference on Computational Intelligence (IJCCI 2019), pages 325-334
ISBN: 978-989-758-384-1
Copyright
c
2019 by SCITEPRESS – Science and Technology Publications, Lda. All rights reserved
325

classifiers using the number of rules.
The next section of this paper contains a short re-
view of the NEFCLASS classifier and adjusted resid-
ual measure that will be used to modify the NEF-
CLASS classifier. Section 3 describes the methodol-
ogy of our study. Section 4 presents the statistical
analysis for the results obtained. Finally, conclusions
are presented.
2 BACKGROUND
2.1 The NEFCLASS Classifier
NEFCLASS (Nauck et al., 1996; Nauck and Kruse,
1998; Klose et al., 1999) is a NEURO-FUZZY classi-
fier that generate fuzzy rules and tune the shape of the
membership functions to determine the correct class
label for a given input.
Fig. 1 shows a NEFCLASS model that classifies
input data with two features into two output classes
by using three fuzzy sets and two fuzzy rules. In-
put features are supplied to the nodes at the bottom
of the figure. These are then fuzzified, using a num-
ber of fuzzy sets. The sets used by a given rule are
indicated by linkages between input nodes and rule
nodes. If the same fuzzy set is used by multiple rules,
these links are shown passing through an oval, such as
the one marked “large” in Fig. 1. Rules directly im-
ply an output classification, so these are shown by un-
weighted connections associating a rule with a given
class. Multiple rules may support the same class,
however that is not shown in this diagram.
In Fig. 2a, a set of initial fuzzy membership func-
tions describing regions of the input space are shown,
here for a two-dimensional problem in which the
fuzzy sets are based on the initial discretization pro-
duced by the EQUAL-WIDTH algorithm. As will be
demonstrated, NEFCLASS functions work best when
these regions describe regions specific to each in-
tended output class, as is shown here, and as is de-
scribed in the presentation of a similar figure in the
classic work describing this classifier (Nauck et al.,
1996, pp. 239).
As is described in the NEFCLASS overview pa-
per (Nauck and Kruse, 1998, pp. 184), a relationship
is constructed through training data to maximize the
association of the support of a single fuzzy set with a
single outcome class. This implies both that the num-
ber of fuzzy sets must match the number of outcome
classes exactly, and in addition, that there is an as-
sumption that overlapping classes will drive the fuzzy
sets to overlap as well.
Figure 1: A NEFCLASS model with two inputs, two rules,
and two output classes. The figure extracted from (Yousefi
and Hamilton-Wright, 2016).
(a) Initial fuzzy set membership functions in NEFCLASS,
produced using EQUAL-WIDTH discretization
(b) Results of tuning the above membership functions to bet-
ter represent class/membership function information
Figure 2: Fuzzy membership functions before and after
training data based tuning using the NEFCLASS algorithm.
The figure extracted from (Yousefi and Hamilton-Wright,
2016).
Fig. 2a shows the input membership functions as
they exist before membership function tuning per-
FCTA 2019 - 11th International Conference on Fuzzy Computation Theory and Applications
326
formed by the original NEFCLASS algorithm, when
the input space is partitioned into EQUAL-WIDTH
fuzzy intervals.
Fig. 2b demonstrates that during the fuzzy set tun-
ing process, the membership function is shifted and
the support is reduced or enlarged, in order to better
match the coverage of the data points belonging to
the associated class, however as we will see later, this
process is strongly informed by the initial conditions
set up by the discretization to produce the initial fuzzy
membership functions.
There are three different modes to be used for rule
selection in NEFCLASS. These modes are based on
the performance of a rule or on the coverage of the
training data. The three options for the rule selec-
tion mode presented here are Simple, Best and Best-
PerClass. The Simple rule selection chooses the first
generated rules until a predefined maximum number
of rules is achieved. The Best rule selection is an al-
gorithm that ranks the rules based on the number of
patterns associated with each rule and select the rules
from this list. The BestPerClass option is selection of
rules by creating an equal number of rules for each
class. This method uses the Best rule selection algo-
rithm to ranks the rules.
After the construction of the fuzzy rules, a fuzzy
set learning procedure is applied to the training data,
so that the membership functions are tuned to better
match the extent of the coverage of each individual
class in the training data space (Nauck et al., 1996,
pp. 239). Fuzzy membership functions will grow or
shrink, as a result, depending on the degree of ambi-
guity between sets and the dataset coverage.
2.2 Discretization
A discretization process divides a continuous numeri-
cal range into a number of covering intervals where
data falling into each discretized interval is treated
as being describable by the same nominal value in
a reduced complexity discrete event space. In fuzzy
work, such intervals are then typically used to define
the support of fuzzy sets, and the precise placement
in the interval is mapped to the degree of membership
in such a set.
In the following discussion, we describe the
EQUAL-WIDTH and MME discretization methods.
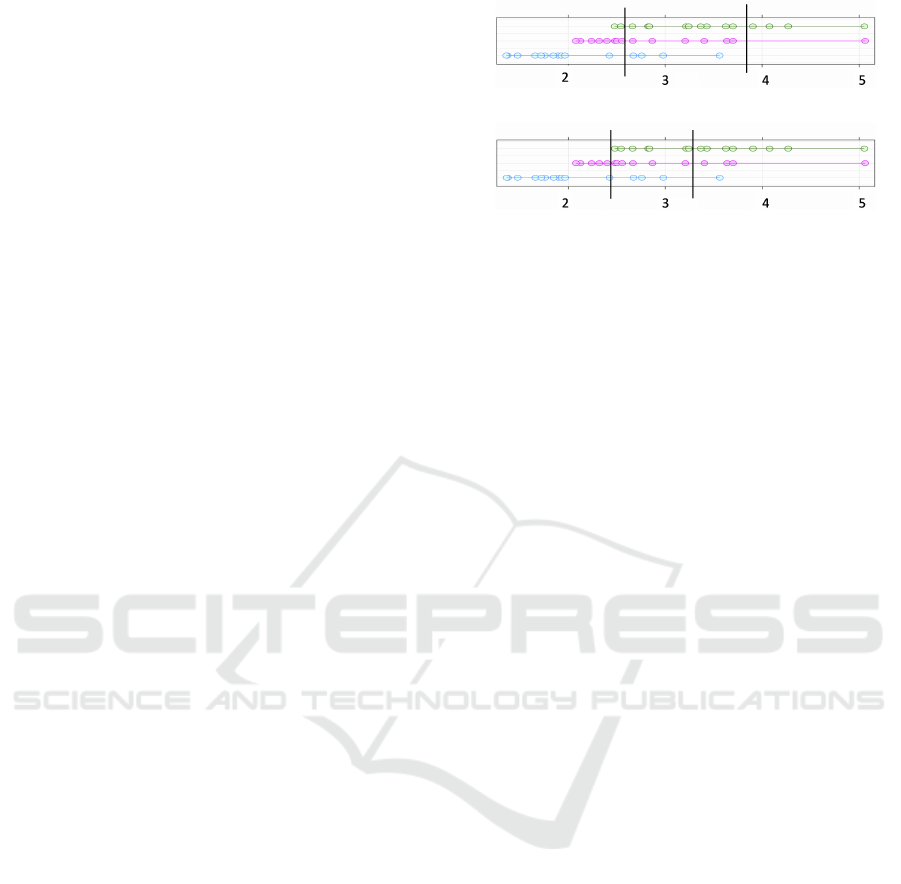
For example, imagine a dataset formed of three over-
lapping distributions of 15 points each, as shown with
the three coloured arrangements of points in Fig. 3.
The points defining each class are shown in a horizon-
tal band, and the points are connected together to indi-
cate that they are part of the same class group. In parts
3a and 3b, the results of binning these points with two
(a) EQUAL-WIDTH
(b) MME
Figure 3: Two discretization techniques result in different
intervals produced on the same three-class dataset. The fig-
ure extracted from (Yousefi and Hamilton-Wright, 2016).
different discretization techniques are shown. The
subfigures within Fig. 3 each show the same data,
with the green, red and blue rows of dots (top, middle
and bottom) within each figure describing the data for
each class in the training data.
2.2.1 EQUAL-WIDTH
The EQUAL-WIDTH discretization algorithm divides
the observed range of continuous values for a given
feature into a number of equally sized intervals, pro-
viding a simple mapping of the input space that is
created independent of both the distribution of class
and of the density of feature values within the input
space (Kerber, 1992; Chemielewski and Grzymala-
Busse, 1996).
Fig. 3a demonstrates the partitioning using
EQUAL-WIDTH intervals. Note that the intervals
shown have different numbers of data points within
each (21, 19 and 5 in this case).
2.2.2 Marginal Maximum Entropy
Marginal Maximum Entropy based discretization
(MME) (Chau, 2001; Gokhale, 1999) divides the
dataset into a number of intervals for each feature,
where the number of points is made equal for all of
the intervals, under the assumption that the informa-
tion of each interval is expected to be equal. The in-
tervals generated by this method have an inverse rela-
tionship with the points’ density within them. Fig. 3b
shows the MME intervals for the example three-class
dataset. Note that the intervals in Fig. 3b do not
cover the same fraction of the range of values (i.e.,
the widths differ), being the most dense in regions
where there are more points. The same number of
points (15) occur in each interval. In both of these
discretization strategies, class identity is ignored, so
there is likely no relationship between class label dis-
tribution and discretization boundary.
A Synergistic Approach to Enhance the Accuracy-interpretability Trade-off of the NECLASS Classifier for Skewed Data Distribution
327

2.3 Adjusted Residual
We use the Hebreman’s adjusted residual algorithm
(Haberman, 1973; Haberman, 1979) in our rule-
pruning model.
In statistics, a residual is defined as a function
of the difference between the expected and observed
counts under the assumed model. The adjusted resid-
uals is a measure of the strength of the difference be-
tween observed and expected counts. The residual is
defined as:
Definition 1. Given a training set of size n, the resid-
ual for each independent event R
n
i
is defined as:
r
n
i
= o
R
n
i
−e
R
n
i
(1)
where o
R
n
i
and e
R
n
i
are the observed number and the
expected number of the event R
n
i
, respectively; and r
n
i
is the residual associated with R
n
i
.
Definition 2. The adjusted residuals is defined as:
a
R
n
i
=
z
R
n
i
√
v
R
n
i
(2)
where z
R
n
i
is the standard residual and v
R
n
i
is the maxi-
mum likelihood estimate of the standard residual vari-
ance, and is defined as:
v
R
n
i
= var(z
R
n
i
) = var
o
R
n
i
−e
R
n
i
√
e
R
n
i
!
= 1 −
∏
j=1,N
o
R
j
i
N
(3)
where o
R
j
i
is the number of occurrences of the pri-
mary event R
j
i
∈ R
n
i
.
The expected number of occurrences of R
j
i
is de-
fined as:
e
R
n
i
= n
∏
j=1,n
o
R
j
i
n
(4)
The value of the adjusted residuals defines the rel-
ative significance of the associated event R
j
i
.
The advantage of adjusted residuals is that they follow
a Gaussian frequency distribution (with mean zero
and a standard deviation one). Thus we can use a test
of significance to determine the likelihood of certain
residual’s value being obtained by chance. The null
hypothesis is that the occurrence of each component’s
primary event is random and independent. A signif-
icance test compares the event’s observed number of
occurrences with the expected number of occurrences
under this null hypothesis. If the adjusted residual is
larger than -1.96 or smaller than 1.96 (the critical val-
ues for > .95 confidence), we conclude that the differ-
ences between the observed and expected number of
occurrences of an even are significant. A detailed ex-
position of residual analysis can be found in (Haber-
man, 1973; Haberman, 1979), where the properties of
the analysis are discussed.
3 METHODOLOGY
This paper has two objectives. The first is to eval-
uate an alternative discretization method to counter-
act the performance problems in skewed data do-
mains which was identified in (Yousefi and Hamilton-
Wright, 2016). The second is to reduce the rule-base
complexity of the NEFCLASS classifier without losing
accuracy.
Experiments were performed on synthesized
datasets with different levels of feature values skew-
ness. Besides, we conducted a set of experiments
to evaluate the effectiveness of our approaches for a
real-world dataset, EMG data, which contains several
highly skewed features. Results from the experiments
are presented in terms of misclassification percent-
ages and number of rules.
In the following sections, we explain the MME
discretization method and the rule pruning algorithm
that are used in our modified NEFCLASS.
3.1 Improving Accuracy by using the
MME Discretization Methods
The NEFCLASS classifier as presented in (Nauck
et al., 1996) uses an EQUAL-WIDTH discretization
method to divide the observed range of continuous
values for a given feature into fuzzy intervals as de-
scribed in Section 2.1. The fuzzy sets constructed
by the EQUAL-WIDTH discretization method only re-
flect the extent of the data distribution, but do not
reflect the variability of density within the distribu-
tion, nor do they reflect class labels. This raises the
question of whether taking the distribution of sam-
ples within its extent may improve classification per-
formance. To evaluate this question, we use skewed
distributions and the MME method of discretization.
The MME method is not part of the standard NE-
FCLASS implementation, therefore we implemented
a modified NEFCLASS classifier, utilizing the MME
discretization method.
3.2 Rule Pruning by using the Adjusted
Residual Measure
In this work, we have evaluated rule pruning based
on the adjusted residual on the grounds that a statis-
tically significant association, as encoded by a fuzzy
FCTA 2019 - 11th International Conference on Fuzzy Computation Theory and Applications
328

rule, should give a measure by which higher quality
rules may be identified. We therefore propose a rule
pruning algorithm based on the adjusted residual that
proceeds as described below.
Definition 3. Let T be a training set of n training
examples (x
i1
, x
i2
, . . . , x
im
, y
i
); i = 1, . . . , n. Each
training example is represented by an instance
{x
i1
, x
i2
, . . . , x
im
} and it’s associated class label y
i
.
where
m is the dimensionality of the input space. There are
m features for each training example, x
1
, x
2
, . . . , x
m
;
c is the dimensionality of the output space. There are
c class labels, l
1
, l
2
, . . . , l
c
.
Let values for each feature x
1
, x
2
, . . . , x
m
be di-
vided into a number of s fuzzy sets.
where
Feature x
1
is associated with fuzzy sets F
1
1
, F
2
1
, . . . , F
s
1
;
Feature x
2
is associated with fuzzy sets F
1
2
, F
2
2
, . . . , F
s
2
;
And feature x
m
is associated with F
1
m
, F
2
m
, . . . , F
s
m
.
Let R be a set of k rules generated from the
training set T .
where
R
k
is a linguistic rule generated from the example
(x
i1
, x
i2
, . . . , x
im
, y
i
);
A
k
is the antecedent of R
k
;
C
1
, . . . ,C
k
are the conditions for the antecedent A
k
.
Each condition C
i
defined as “If x
i
is F
j
i
” ;
i = 1, . . . , m and j = 1, . . . , s;
R
k
is defined as follows:
R
k
= If C
1
and C
2
and . . . and C
m
then l is y
i
(5)
Residuals for R
k
are calculated as follows:
r
R
k
= o(R
k
) −e(R
k
) (6)
where
r(R
k
) is the residual of rule R
k
;
o(R
k
) is the observed number of occurrences of rule
R
k
in the training set.
e(R
k
) is the number of occurrences of rule R
k
ex-
pected under an assumed model of uniform random
chance, and is calculated as follows:
e(R
k
) = e(A
k
) ×e(l is y
i
) (7)
e(A
k
) = n ×e(C
1
) ×e(C
2
) ×···×e(C
m
) (8)
e(C
i
) =
o(C
i
)
n
(9)
The rules that are statistically significant, based on
their adjusted residual, will be selected, whereas the
insignificant rules will be removed. Finally we use
the new fuzzy rule-base for retraining the NEFCLASS
classifier in order to tune the membership functions in
a way such that they match with new rules.
3.3 Modified NEFCLASS Classifiers
Table 1 summarizes the four NEFCLASS classifiers
with their respective properties and provides the
names by which they will be identified in the rest of
the paper.
3.4 Synthesized Datasets
Four synthesized datasets were used for experiments.
Three datasets were produced by randomly gener-
ating numbers following the F-DISTRIBUTION with
different degrees of freedom chosen to control skew.
The F-DISTRIBUTION (Natrella, 2003) has been cho-
sen as the synthesis model because the degree of skew
within an F-DISTRIBUTION is controlled by the pairs
of degrees of freedom specified as a pair of distribu-
tion control parameters. This allows for a spectrum of
skewed data distributions to be constructed. We de-
signed the datasets to present different levels of skew-
ness with increasing skew levels. Three pairs of de-
grees of freedom parameters have been used to gen-
erate datasets with different levels of skewness, in-
cluding low, medium, and high-skewed feature val-
ues. After initial experiments datasets with degrees of
freedom (100, 100) was chosen to provide data close
to a normal distribution, (100, 20) provides moderate
skew, and (35, 8) provides high skew.
A synthesized dataset consisting of 1000 ran-
domly generated examples consisting of four-feature
(W , X, Y , Z). F-DISTRIBUTION data for each of
three classes was created. The three classes (ClassA,
ClassB and ClassC) overlap, and are skewed in the
same direction. We have taken care to ensure that
all datasets used have a similar degree of overlap,
and same degree of variability. The size of datasets
were designed to explore the effect of skewness when
enough data is available to clearly ascertain dataset
properties. Ten-fold cross validation was used to di-
vide each dataset into training (2700) and testing (300
point) sets in which an equal number of each class is
represented. This method provides a better estimate
of median performance, as well as a measure of vari-
ability.
Another synthesized dataset was produced by
randomly generating numbers from the CIRCULAR-
UNIFORM-DISTRIBUTION. A CIRCULAR-
UNIFORM-DISTRIBUTION is a distribution within
a circle with constant probability density across the
area of the circle for all values. The CIRCULAR-
UNIFORM-DISTRIBUTION is a part of the family of
symmetric distributions, so the skewness of circular
uniform distribution is close to 0.
Fig. 4 shows the skewness of each dataset for each
A Synergistic Approach to Enhance the Accuracy-interpretability Trade-off of the NECLASS Classifier for Skewed Data Distribution
329
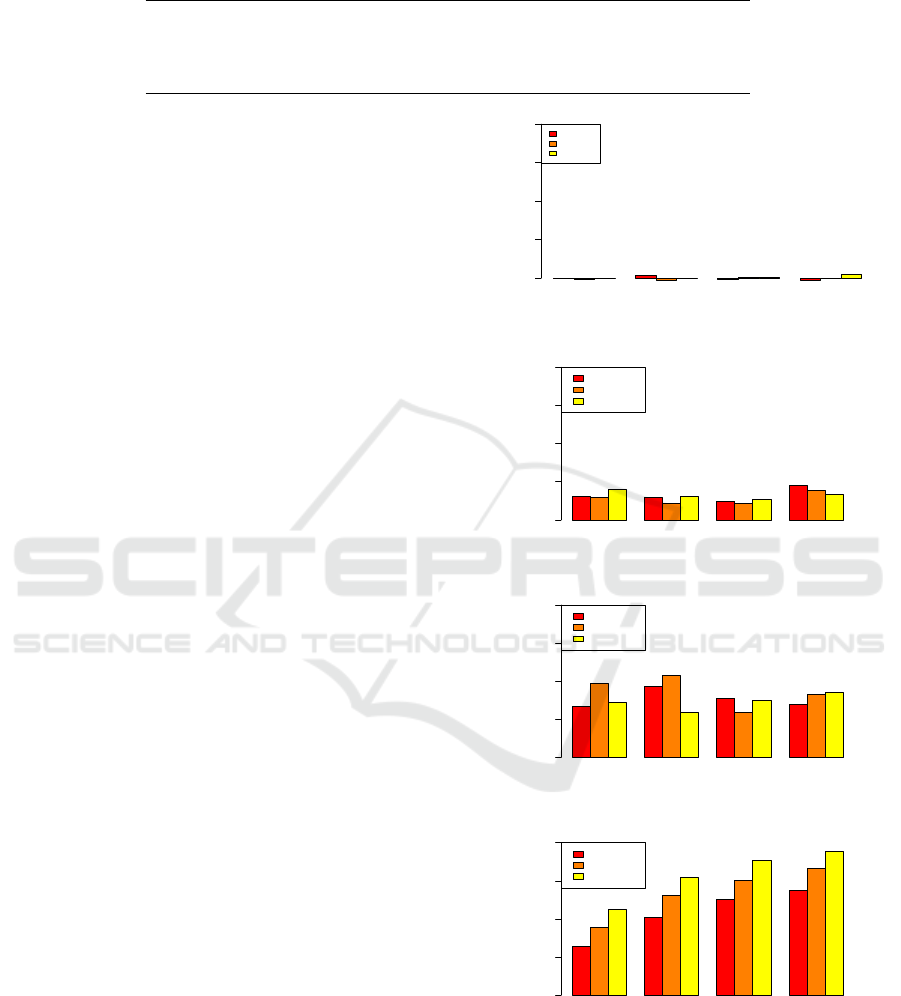
Table 1: List of all classifiers derived from the NEFCLASS classifier.
Classifier Discretization Technique Rule Pruning Technique
NEF-ORG Default (EQUAL-WIDTH) Default (BestPerClass)
NEF-MME MME Default (BestPerClass)
NEF-AR Default (EQUAL-WIDTH) Adjusted Residuals
NEF-MME-AR MME Adjusted Residuals
feature. From these figures one can see that the UNI-
FORM and LOW-100,100 data are relatively symmet-
ric, while as the skew increases as we consider the
MED-100,20 and HIGH-35,8 data show an increas-
ing, and ultimately quite dramatic, skew.
3.5 Electromyography Dataset (EMG)
To show the pertinence of this analysis to a real
world data problem, we have explored the skewness
of a dataset from the clinically applicable world of
quantitative electromyography (QEMG). QEMG is
the study of the electrical potentials observed from
contracting muscles as seen through the framework of
quantitative measurement. QEMG is used in research
and diagnostic study (Stashuk and Brown, 2002).
EMG datasets are known to contain features with
highly skewed value distributions (Enoka and Fugl-
evand, 2001).
The EMG dataset used here contains seven
features of MUP templates (Amplitude, Duration,
Phases, Turns, AAR, SizeIndex, and MeanMUVolt-
age) observed on 791 examples representing three
classes (Myopathy, Neuropathy, Healthy), collected
through a number of contractions, and used in previ-
ous work (Varga et al., 2014). Each example is based
on measuring values from a MUP template extracted
from an EMG signal, and it describes the contribution
of all observed MUs that contributed to the obtained
EMG signal.
Figure 5 shows the skewness values for all the
features with respect to each class. As is shown in
Figure 5, the distribution of values for Amplitude
and MeanMUVoltage are highly positively skewed,
particularly in Myopathy cases. In contrast, Turns
is highly skewed in Neuropathy and Normal cases.
Also, Phases, AAR, and SizeIndex demonstrate rel-
atively low skewness.
4 RESULTS AND DISCUSSIONS
We evaluate the effect of discretization methods on
the misclassification percentages and the number of
rules obtained by a NEFCLASS based classifier when
trained on skewed data. The misclassification per-
centages obtained by the four classifiers are gathered
W X Y Z
Feature
Skewness Value
0 1 2 3 4
ClassA
ClassB
ClassC
(a) UNIFORM
W X Y Z
Skewness Value
0 1 2 3 4
ClassA
ClassB
ClassC
(b) LOW-100,100
W X Y Z
Skewness Value
0 1 2 3 4
ClassA
ClassB
ClassC
(c) MED-100,20
W X Y Z
Skewness Value
0 1 2 3 4
ClassA
ClassB
ClassC
(d) HIGH-35,8
Figure 4: Skewness by label and feature for the three syn-
thetic datasets. The figure extracted from (Yousefi and
Hamilton-Wright, 2016).
in Table 2, while the number of rules appears in Ta-
ble 3. The results have been calculated over the 10
cross-validation trials. Mann-Whitney-Wilcoxon was
FCTA 2019 - 11th International Conference on Fuzzy Computation Theory and Applications
330
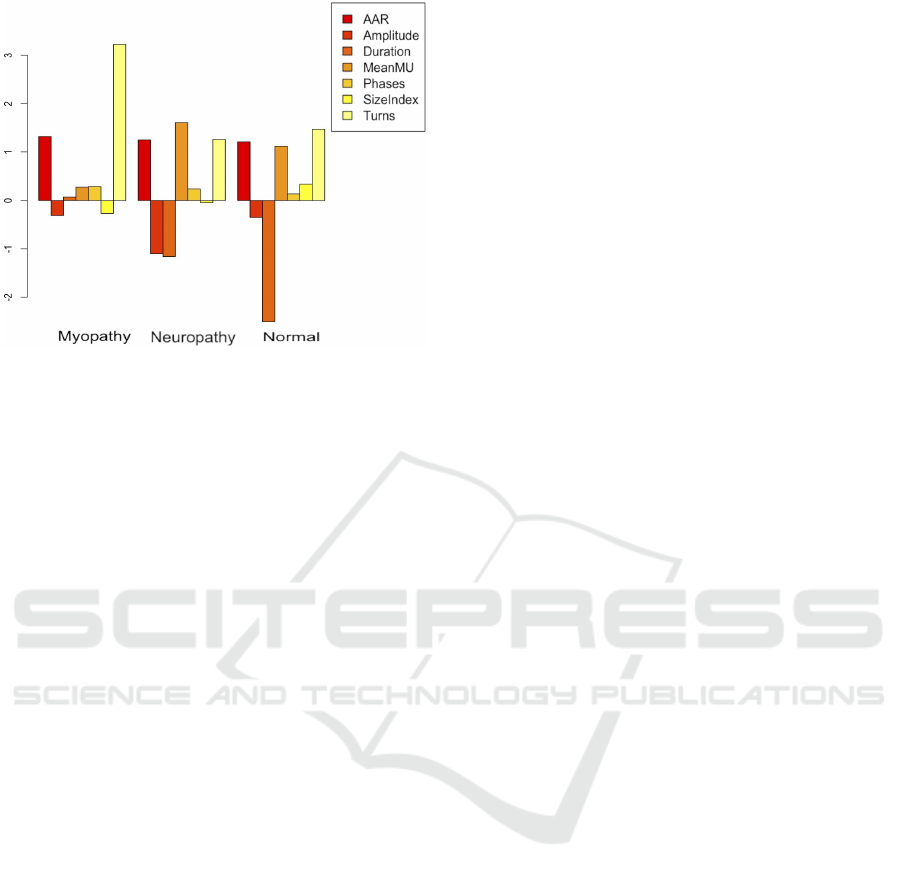
Figure 5: Degree of skewness for the EMG dataset.
used because an analysis using a Shapiro-Wilks test
indicated that a non-parametric test was appropriate.
4.1 The Effect of Discretization Method
on the Performance of NEFCLASS
The results of NEF-MME were compared with
those of NEF-ORG, which uses the default EQUAL-
WIDTH discretization strategy. The analyses were
performed using two-sided M-W-W test at a 0.05 sig-
nificance level. The test identified a significant differ-
ence in the misclassification percentage between the
two classifiers for all datasets. As shown in Table 2,
NEF-MME achieved lower misclassification percent-
ages compared to NEF-ORG using all datasets except
LOW-100,100. Additionally, the test resulted in a
significant difference in the number of rules obtained
by NEF-ORG versus NEF-MME for all cases. As
shown in Table 3, NEF-MME constructed a higher
number of rules than did the NEF-ORG, for medium
and high skewed datasets, resulted in a higher accu-
racy. The number of rules obtained by NEF-ORG de-
creased with increase of data skewness level. This is
an underlying cause for the increase in misclassifica-
tion percentages trained on skewed datasets. The de-
creasing trend in the number of rules constructed by
the NEF-ORG classifier confirms that less informa-
tion is being captured about the dataset as the skew-
ness increases.
This study indicated that the choice of initial dis-
cretization method affected the classification accu-
racy of the NEFCLASS classifier and that this effect
was very strong in skewed datasets. Utilizing MME
discretization method in the NEFCLASS classifier sig-
nificantly improved classification accuracy for highly
skewed data.
4.2 The Effect of the Rule Pruning
Algorithm on the Performance of
NEFCLASS
To assess the effect of the rule pruning algorithm,
we compared each pair of classifiers to determine
whether the application of the rule pruning algorithm
significantly reduced the number of rules. Addi-
tionally, the misclassification percentages were com-
pared to determine whether a reduction in the num-
ber of rules significantly increase the misclassifica-
tion percentage. Comparisons between classifiers
were performed as follows: for each discretization
method and each dataset, results obtained by AR-
PRUNING algorithm were compared with those of the
NEFCLASS DEFAULT RULE-PRUNING . Hence, we
examined two comparisons: (i) classifiers with the
EQUAL-WIDTH discretization method, i.e., NEF-AR
versus NEF-ORG, (ii) classifiers with the MME dis-
cretization method, i.e., NEF-MME-AR versus NE-
F-MME. Additionally, we compared the final com-
bined classifier, i.e., NEF-MME-AR versus NEF-
ORG.
The analyses were performed using one-way M-
W-W test at a 0.05 significance level. Tables 4 and
5 report the M-W-W test results for comparison of
the misclassification percentages and the number of
rules, respectively. Comparisons between classifiers
were performed as follows:
• NEF-AR versus NEF-ORG:
As shown in Table 5, the test yielded a significant
decrease in the number of rules by application of
AR-PRUNING for all datasets. The test results
shown in Table 4 revealed that this reduction
of rules did not increase the misclassification
percentages. This reduction in the rule-base
size without reducing accuracy means that the
use of AR-PRUNING raised the efficiency of the
classifier.
• NEF-MME-AR versus NEF-MME:
As shown in Table 5, the test determined that
NEF-MME-AR constructed a significantly
lower number of rules for all datasets, except
for UNIFORM. Also, the test results shown in
Table 4 revealed that there was no significant
increase in misclassification percentages. As
shown in Table 5, NEF-MME-AR significantly
reduced the number of rules for medium and high
skewed datasets without significantly decreasing
accuracy.
A Synergistic Approach to Enhance the Accuracy-interpretability Trade-off of the NECLASS Classifier for Skewed Data Distribution
331

Table 2: Misclassification percentages (Median ± IQR) based on the rule pruning algorithm.
Classifier Dataset
UNIFORM LOW-100,100 MED-100,20 HIGH-35,8
NEF-ORG 30.16 ± 3.50 22.66 ± 1.33 65.00 ± 5.51 66.67 ± 3.26
NEF-AR 30.16 ±0.75 23.00 ±0.75 71.83 ±0.00 66.67 ±1.00
NEF-MME 16.66 ± 2.00 26.00 ± 1.50 34.16 ± 1.00 42.50 ± 1.00
NEF-MME-AR 17.50 ±1.75 23.33 ±1.75 32.33 ±0.00 41.50 ±0.75
Table 3: Number of fuzzy rules (Median ± IQR) based on the rule pruning algorithm.
Classifier Dataset
UNIFORM LOW-100,100 MED-100,20 HIGH-35,8
NEF-ORG 55.50 ± 1.00 49.00 ± 0.00 34.50 ± 2.00 15.00 ± 1.00
NEF-AR 49.50 ±1.00 42.50 ±1.75 19.00 ±0.00 10.00 ±1.00
NEF-MME 43.00 ± 2.00 44.00 ± 1.50 50.00 ± 1.00 46.00 ± 1.00
NEF-MME-AR 43.50 ±1.75 40.00 ±1.75 29.00 ±0.00 21.00 ±0.75
Table 4: Results of the one-tailed M-W-W test for comparison of the misclassification percentages between classifiers using
different rule pruning algorithms.
Classifier Dataset
UNIFORM LOW-100,100 MED-100,20 HIGH-35,8
NEF-AR vs. NEF-ORG .60 .80 .99 .69
NEF-MME-AR vs. NEF-MME .45 .94 .93 .75
NEF-MME-AR vs. NEF-ORG *** .97 *** ***
*** significant at 95% confidence (p < .05)
Table 5: Results of one-tailed M-W-W test for comparison of the number of rules between classifiers using different rule
pruning algorithms.
Classifier Dataset
UNIFORM LOW-100,100 MED-100,20 HIGH-35,8
NEF-AR vs. NEF-ORG *** *** *** ***
NEF-MME-AR vs. NEF-MME .10 *** *** ***
NEF-MME-AR vs. NEF-ORG *** *** *** .99
*** significant at 95% confidence (p < .05)
• NEF-MME-AR versus NEF-ORG:
M-W-W identified a significant decrease in the
number of rules obtained by NEF-MME-AR
compared to NEF-ORG for all datasets, except
for high-skewed data. The results shown in Ta-
ble 3 suggest that, in the case of HIGH-35,8, the
number of rules increased due to the effect of
the discretization method. However, some of the
rules were pruned later after the AR-PRUNING
process took place. At the end of training, the fi-
nal number of rules obtained by NEF-MME-AR
was more than that of NEF-ORG but less than
those of NEF-MME. For example, the number
of rules obtained by NEF-ORG using the HIGH-
35,8 data was 15. Then, the application of the
MME discretization method increased the num-
ber of rules to 45. Finally, pruning the rules us-
ing AR-PRUNING decreased the number of rules
to 21. Furthermore, the test indicated a signifi-
cant decrease in the misclassification percentages
for all comparisons except in the case of LOW-
100,100.
The findings of this analysis revealed that the
combination of the MME discretization method with
the AR-PRUNING algorithm not only led to a signifi-
cant reduction in the number of rules but also improve
the accuracy using medium and high skewed data.
4.3 Experiments using Real-world Data
Table 6 depicts the misclassification percentages and
the number of rules. Table 7 gives the test results.
As shown in the table, the test revealed a signifi-
cant decrease in the misclassification percentages ob-
tained by NEF-MME compared to NEF-ORG. The
results of this experiment once again confirmed that
using the MME method improved accuracy. Addi-
tionally, the test indicated a significant decrease in
FCTA 2019 - 11th International Conference on Fuzzy Computation Theory and Applications
332

Table 6: Misclassification percentages (Median ±IQR) and number of rules (Median ±IQR) obtained from classifiers trained
on the EMG dataset.
Classifier Misclassification Percentage Number Of rules
NEF-ORG 54.18 ± 28.00 149.00 ± 4.00
NEF-MME 41.00 ± 22.00 90.00 ± 14.00
NEF-MME-AR 21.00 ±25.00 33.00 ±16.00
*** significant at 95% confidence (p < .05)
Table 7: Results of one-tailed M-W-W to compare the rule pruning methods for the EMG dataset.
Classifier Misclassification Percentage Number Of rules
NEF-ORG vs. NEF-MME .03 .84
NEF-ORG vs. NEF-MME-AR *** ***
*** significant at 95% confidence (p < .05)
the misclassification percentages and the number of
rules obtained by NEF-MME-AR compared to NEF-
ORG. In light of the above findings, it is concluded
that using a simplified rule-base obtained by the ap-
plication of AR-PRUNING not only reduced the num-
ber of rules but also reduced the confusion in the
decision-making process.
5 CONCLUSIONS
The results of our last study indicated that the NE-
FCLASS classifier performs increasingly poorly as
data feature value skewness increases. Also, the
study indicated that the choice of initial discretization
method affected the classification accuracy of the NE-
FCLASS classifier and that this effect was very strong
in skewed datasets. This study revealed that utilizing
MME discretization method in the NEFCLASS classi-
fier significantly improved classification accuracy for
the medium and high skewed data. Furhter, the find-
ings of this study showed that the combination of the
MME discretization method with the AR-PRUNING
algorithm not only led to a significant reduction in the
number of rules but also improve the accuracy in the
majority of cases. Hence, the NEF-MME-AR clas-
sifier produced a compelling combination of the dis-
cretization method and the rule pruning algorithm for
skewed datasets.
The proposed model-based strategy can be use-
ful in medical diagnosis systems because it not only
provides more accurate results but, by reducing the
number of rules, will likely make interpretation of the
system simpler. Other domains where skewed data
is common are likely additional areas of application,
and include fraud detection, computer security, and
finance. Finally, it should be noted that while it has
been evaluated using NEFCLASS, the adjusted resid-
uals rule pruning system introduced here can be used
in any rule based system, and is likely to have simi-
lar benefits, as there is nothing specific to the fuzzy
domain.
ACKNOWLEDGEMENTS
The authors gratefully acknowledge the support of
NSERC, the National Sciences and Engineering Re-
search Council of Canada, for ongoing grant support.
REFERENCES
Ben-Gal, I. (2010). Outlier detection. In Maimon, O. and
Rokach, L., editors, Data Mining and Knowledge Dis-
covery Handbook, chapter 7, pages 131–146. Springer
Science & Business Media.
Chau, T. (2001). Marginal maximum entropy partition-
ing yields asymptotically consistent probability den-
sity functions. IEEE Transactions on Pattern Analysis
and Machine Intelligence, 23(4):414–417.
Chemielewski, M. R. and Grzymala-Busse, J. W. (1996).
Global discretization of continuous attributes as pre-
processing for machine learning. International Jour-
nal of Approximate Reasoning, 15:319–331.
Enoka, R. and Fuglevand, A. (2001). Motor unit physiol-
ogy: some unresolved issues. Muscle & Nerve, 24:4–
17.
Gao, J., Hu, W., Li, W., Zhang, Z., and Wu, O. (2010).
Local outlier detection based on kernel regression.
In Proceedings of the 10th International Conference
on Pattern Recognition, pages 585–588, Washington,
DC, USA. EEE Computer Society.
Gokhale, D. V. (1999). On joint and conditional entropies.
Entropy, 1(2):21–24.
Gupta, A. (2016). Neural networks in data processing. In-
ternational Journal of Advanced Research in Com-
puter Engineering & Technology (IJARCET), 5(5):1–
13.
Haberman, S. J. (1973). The analysis of residuals in cross-
classified tables. Biometrics, 29(1):205–220.
A Synergistic Approach to Enhance the Accuracy-interpretability Trade-off of the NECLASS Classifier for Skewed Data Distribution
333

Haberman, S. J. (1979). Analysis of Qualitative Data,
volume 1 of Springer Series in Statistics, pages 78–
79,82–83. Academic Press, Toronto.
Hable, R. (2012). Asymptotic normality of support vector
machine variants and other regularized kernel meth-
ods. Journal of Multivariate Analysis, 106:92–117.
Kerber, R. (1992). ChiMerge discretization of numeric at-
tributes. In Proceedings of AAAI-92, pages 123–128,
San Jose Convention Center, San Jose, California.
Klose, A., N
¨
urnberger, A., and Nauck, D. (1999). Im-
proved NEFCLASS pruning techniques applied to a
real world domain. In Proceedings Neuronale Netze
in der Anwendung, University of Magdeburg. NN’99.
Marapareddy, R., Aanstoos, J. V., and Younan, N. H.
(2017). Accuracy analysis comparison of supervised
classification methods for anomaly detection on lev-
ees using SAR imagery. Electronics – Open Access
Journal, 68(6):1–13.
Mueller, J. P. and Massaron, L. (2016). Machine Learning
For Dummies. For Dummies.
Natrella, M. (2003). NIST SEMATECH eHandbook of Sta-
tistical Methods. NIST.
Nauck, D., Klawonn, F., and Kruse, R. (1996). Neuro-Fuzzy
Systems. Wiley.
Nauck, D. and Kruse, R. (1998). NEFCLASS-X – a soft
computing tool to build readable fuzzy classifiers. BT
Technology Journal, 16(3):180–190.
Stashuk, D. W. and Brown, W. F. (2002). Quantitative elec-
tromyography. In Brown, W. F., Bolton, C. F., and
Aminoff, M. J., editors, Neuromuscular Function and
Disease, volume 1, pages 311–348. W.B. Saunders,
Philadelphia.
Varga, R., Matheson, S. M., and Hamilton-Wright, A.
(2014). Aggregate features in multi-sample classifi-
cation problems. IEEE Trans. Biomed. Health Inf.,
99:1.
Yousefi, J. and Hamilton-Wright, A. (2016). Classifi-
cation confusion within nefclass caused by feature
value skewness in multi-dimensional datasets. In Pro-
ceedings of the 8th International Joint Conference on
Computational Intelligence (IJCCI 2016) - Volume 2:
FCTA, pages 21–29.
FCTA 2019 - 11th International Conference on Fuzzy Computation Theory and Applications
334
