
An Efficient, Robust, and Customizable Information Extraction and
Pre-processing Pipeline for Electronic Health Records
Eva K. Lee
1,2,3
, Yuanbo Wang
1,2,3
, Yuntian He
1,2,3
and Brent M. Egan
4,5
1
Center for Operations Research in Medicine and HealthCare, U.S.A.
2
H. Milton Stewart School of Industrial and Systems Engineering, U.S.A.
3
School of Biological Sciences, Georgia Institute of Technology, U.S.A.
4
University of South Carolina School of Medicine–Greenville, U.S.A.
5
Care Coordination Institute, Greenville, U.S.A.
Keywords: Electronic Health Record, Information Extraction, Encryption, Data Standardization, Clustering, Time Series.
Abstract: Electronic Health Records (EHR) containing large amounts of patient data present both opportunities and
challenges to industry, policy makers, and researchers. These data, when extracted and analyzed effectively,
can reveal critical factors that can improve clinical practices and decisions. However, the inherently complex,
heterogeneous and rapidly evolving nature of these data make them extremely difficult to analyze effectively.
In addition, Protected Health Information (PHI) containing sensitive yet valuable information for clinical
research must first be anonymized. In this paper we identify current challenges with obtaining and pre-
processing information from EHR. We then present a comprehensive, efficient “pipeline” for extracting, de-
identifying, and standardizing EHR data. We demonstrate the use of this pipeline, based on software from
EPIC Systems, in analysing chronic kidney disease, prostate cancer, and cardiovascular disease. We also
address challenges associated with temporal laboratory time series data and natural text data and develop a
novel approach for clustering irregular Multivariate Time Series (MTS). The pipeline organizes data into a
structured, machine-readable format which can be effectively applied in clinical research studies to optimize
processes, personalize care, and improve quality, and outcomes.
1 INTRODUCTION
Electronic health record (EHR) plays an important
role in advancing clinical and operational processes.
Although early clinical medical records first appeared
in 1600 BC, it was not until 1900 that it was put into
regular use (Gillum, 2013). The launch of the 10-
year-effort to create a national electronic medical
record system by the United State government in
2004 helped fuel its rapid adoption and medical
advance (Gunter and Terry, 2005). As of 2015, 80
percent of U.S. hospitals had adopted a basic
electronic health record keeping system (Henry et al.,
2016). The value of EHR data is increasingly
recognized by health care organizations and
government. Its utilizations significantly changed the
patient-clinic interaction process (Asan et al., 2015).
Data-driven healthcare has the potential to
revolutionize care delivery while reducing costs.
However, for policymakers, practitioners, and
researchers to take full advantage, several challenges
must be addressed: 1) Extraction and coding methods
for EHR data must be strategically designed
considering issues related to data quantity, quality,
interoperability, and patient confidentiality; 2)
Standardization of clinical terminologies is essential
in facilitating interoperability among EHR systems
and allows for multi-site comparative effectiveness
studies; 3) Effective methods for mining longitudinal
health data common in EHR are critical for revealing
disease progression, treatment patterns, and patient
similarities, all of which play important roles in
clinical decision support and treatment improvement;
4) Advanced machine learning techniques are
necessary for early detection and prognosis of disease
and identifying critical factors that impact patient
outcome; 5) Practical intervention strategies must be
developed to address healthcare disparities in rural
and remote areas with lack of resources and access.
In this study, we focus on tackling the first three
challenges by 1) developing a framework for
identifying and extracting key clinical features from
structured and unstructured data, 2) developing a
concept standardization procedure among the
multitude of available clinical terminologies, and 3)
310
Lee, E., Wang, Y., He, Y. and Egan, B.
An Efficient, Robust, and Customizable Information Extraction and Pre-processing Pipeline for Electronic Health Records.
DOI: 10.5220/0008071303100321
In Proceedings of the 11th International Joint Conference on Knowledge Discovery, Knowledge Engineering and Knowledge Management (IC3K 2019), pages 310-321
ISBN: 978-989-758-382-7
Copyright
c
2019 by SCITEPRESS – Science and Technology Publications, Lda. All rights reserved

implementing unsupervised learning algorithms for
characterizing patient treatment outcomes based on
longitudinal data. These critical data pre-processing
steps allow us to better understand patient
characteristics and treatment patterns. We can
subsequently build outcome predictive models to
identify critical features that contribute to variance in
treatment outcomes. Best practices can be developed
based on these factors and can help hospitals to
redesign and implement evidence-based treatment
plans to achieve better outcome (Lee et al., 2016).
2 LITERATURE REVIEW
It is challenging to establish an efficient data
extraction schema for EHR due to the complexity of
data and lack of data standards. A common task in
EHR is case detection – identifying a cohort of
patients with a certain condition or symptom. Coded
data such as International Classification of Disease
(ICD) codes are often not sufficient or accurate
(Birman-Deych et al., 2005). Informatics approaches
combining structured EHR data with narrative text
data achieve better performance (Li et al., 2008). Key
clinical items can be extracted from narrative texts
with simple methods such as pattern matching using
regular expression (Long, 2005, Turchin et al., 2006),
full or partial parsing based on morpho-semantems
(Baud et al., 1998), and syntactic and semantic
analysis (Jain and Friedman, 1997). Recently, more
complex statistical and rule-based machine learning
approaches (Bashyam and Taira, 2005) have been
developed to tackle this challenge. Biomedical
Named Entity Recognition (NER) – the “task of
identifying words and phrases in free text that belong
to certain classes of interest” (Settles, 2004), allows
users to identify key clinical concepts such as
physician visits, referrals, dietary management, and
suspected problems normally not present in
structured data tables.
Negation detection, which identifies the negative
sense of a concept, is another essential task
accompanying NER, since the presence of negations
can yield false-positive detections because medical
personnel are trained to include pertinent negatives in
their reports (Mutalik et al., 2001). It has been
achieved through rule-based / syntactic parsing
(Chapman et al., 2001, Gindl et al., 2008, Elkin et al.,
2005) and machine learning (De Bruijn et al., 2011,
Díaz et al., 2012, Goldin and Chapman, 2003)
approaches.
Once patient information is extracted, data
security and confidentiality must be ensured through
de-identification steps. According to Health
Insurance Portability and Accountability Act
(HIPAA), patients’ Protected Health Information
(PHI) must be de-identified or anonymized for
commercial and research interest. PHI exists in both
structured and unstructured clinical records
(Zikopoulos and Eaton, 2011). This includes patient
names, addresses, phone numbers, etc. Manual and
rule-based or lexicon-based methods have been used
to achieve PHI de-identification (Sweeney, 1996,
Ruch et al., 2000, Taira et al., 2002), but they are
extremely time-consuming and can be inaccurate.
Machine learning approaches have also been
developed (Sibanda and Uzuner, 2006, Wellner et al.,
2007). However, due to the complexity of data
schemas and the heterogeneity of data structures, it is
very challenging to detect PHI with high sensitivity.
Because EHR data include various types of
records for patients, it is extremely difficult to analyze
all these data without data standardization. In
addition, since these data are recorded by different
hospital staff members at various provider sites, data
heterogeneity becomes a major issue due to the
significant practice variation in style of reporting, use
of terminologies, and descriptive content.
Tackling the problem of data heterogeneity is
essential for conducting predictive analytics using
artificial intelligence. Many clinical records in the
EHR adhere to different terminology systems and can
cause problems such as data redundancy and
inconsistency, hindering the performance of
automated machine learning models. To establish
interoperability among various naming systems,
standardization of data is necessary. In our previous
work, (Lee et al., 2016), clinical concepts were
standardized by a concept mapping system which
links concepts describing diagnosis, laboratory, and
medications to the standardized SNOMED-CT
terminologies.
Standardization of terminologies not only
facilitates the analysis of EHR data but can also
increase the efficiency of operations and information
sharing, thereby facilitating knowledge transfer and
reducing practice variance among health care
organizations.
Analyzing longitudinal clinical data recorded
during care delivery is challenging due to their
incompleteness and non-uniformness. Identification
of subgroups of patients who experience symptoms
with greater or lesser severity (Miaskowski et al.,
2006) or respond to treatment procedures differently
may reveal critical risk or treatment factors that
impact patient outcome. Laboratory and vitals
measurements before, during, and after treatment
may act as markers of disease severity (Wells et al.,
2013) and characterize recovery process. Uncovering
An Efficient, Robust, and Customizable Information Extraction and Pre-processing Pipeline for Electronic Health Records
311

patient clusters also have prognostic significance – by
constructing cluster-based clinical event predictive
models, one can achieve superior performance when
compared to treating all patient episodes as a single
group (Marlin et al., 2012). However, laboratory and
vitals in the form of time series often exhibit different
length and frequency due to different syndromes and
schedules for different patients. Thus, conventional
clustering algorithms aiming to identify patient
subgroups cannot be applied directly. Pre-processing
methods such as interpolation (Lee et al., 2000,
Kreindler and Lumsden, 2016) and resampling
(Carlstein, 1992) can normalize time series data.
Alternatively, clustering algorithms have been
customized for variable-length time series. They
utilize a variety of similarity (distance) measures such
as Dynamic Time Warping (DTW) (Sakoe, 1971),
Soft-DTW (Cuturi and Blondel, 2017), Global
Alignment Kernel (GAK) (Cuturi et al., 2007), and
Time-Warp Edit Distance (TWED) (Marteau, 2009).
While some disease severity can be characterized
by a single type of laboratory measurement — for
example — serum cholesterol levels can be used to
characterize conditions of patients with
hyperlipidemia (Wells et al., 2013), others can be
better defined by multiple laboratory measurement
time series. For instance, systolic blood pressure and
diastolic blood pressure should both be considered for
patients with hypertension. Clustering approaches for
such Multivariate Time Series (MTS) (Brockwell et
al., 2002) are limited. Existing PCA-based (Singhal
and Seborg, 2005), Hidden Markov Model (HMM)-
based , partition-based (Liao, 2007), and model-based
approaches (Košmelj and Batagelj, 1990, Ramoni et
al., 2002) have been applied to a variety of fields
including chemistry and manufacturing, but have not
been utilized in clinical settings. This is likely due to
the irregularity of clinical time series. As far as we are
concerned, clustering approaches have not been
developed for MTS with irregular intervals and
unequal lengths. We will refer to these MTS as
“irregular MTS” throughout this paper.
3 METHODS
3.1 Data Extraction Methods from
EPIC EHR Database
Kaiser Permanente (KP) uses the Clarity module to
transform data from EPIC’s operational database into
a relational form for reporting. Clarity database from
the KP’s HealthConnect EHR system stores patient
data in over 7,000 tables with over 60,000 columns
and update daily (Waitman et al., 2011). The EPIC
Clarity database has recently been imported to Oracle
Exadata for performance improvement. Structured
Query Language (SQL) written in Oracle SQL
Developer is the primary programming language used
to access the database.
3.1.1 Extract Patient Cohort Characterized
by Disease or Symptoms
To extract patient data with certain disease or
symptoms, we first utilize the ICD-9 / ICD-10
diagnosis codes. A Patient ID is selected from the
problem list table if its corresponding record contains
the target diagnosis code(s). In many cases, however,
diagnosis codes are not well-maintained, so it is
necessary to utilize billing information, laboratory
data or narratives in clinical notes for more accurate
case detection. This can be done using semantic
matching of key terms describing medical conditions.
The extracted patient IDs are then used to link to the
other data tables to extract the relevant information.
Table 1 lists the types and coverages of information
extracted. Although most demographics,
medications, billing, procedures, and co-existing
conditions can be found directly from structured data
tables, encounter-level data containing physician
visits and referrals, dietary management, and
suspected problems must be extracted from the
clinical notes table.
Table 1: Data coverage by source tables.
Coverage
Source database tables
Encounter-level data
Encounter / Clinical notes
tables
Medications data
Medications table
Billing information
Billing table
Procedures
Billing / Clinical notes tables
Clinical notes
Clinical notes table
Problem list (co-
existing conditions)
Billing / Problem list / Clinical
notes tables
Laboratory
Order table / Clinical notes
table
3.1.2 Extract Patient Cohort Characterized
by Treatment Features
To extract patient data with certain treatment features
(i.e. procedures, prescriptions, laboratory
measurements), we must first identify all the possible
vocabularies that represent the treatment features.
These vocabularies are compiled into a list and are
used to index the billing / laboratory / medication
tables to select the target patient IDs. Alternatively,
regular expressions can be used to represent groups
of vocabularies to create more succinct queries.
KDIR 2019 - 11th International Conference on Knowledge Discovery and Information Retrieval
312
3.1.3 Table Partitioning and Temporary
Views
In many data extraction tasks, the targeted patient
cohort contains millions of patient records amounting
to terabytes of data. In such cases, table partitions are
created to retrieve data by chunks and reduce local
storage loads. Temporary views are used to reduce
server loads.
3.1.4 PHI Encryption for Structured Data
and Narrative Texts
The SHA-256 Cryptographic Hash Algorithm is used
to encrypt Patient IDs contained in every data record.
For unstructured free-text data, we apply the
transition-based parsing model implemented in the
Python spaCy package (Honnibal and Johnson, 2015)
to detect and de-identify PHI in clinical notes. We
identify and replace the following types of entities:
PERSON, NORP, ORG, and GPE. These entities
cover patient names, nationalities, organizations, and
addresses. In addition, we include a regular
expression-based filter to replace Telephone numbers
as well.
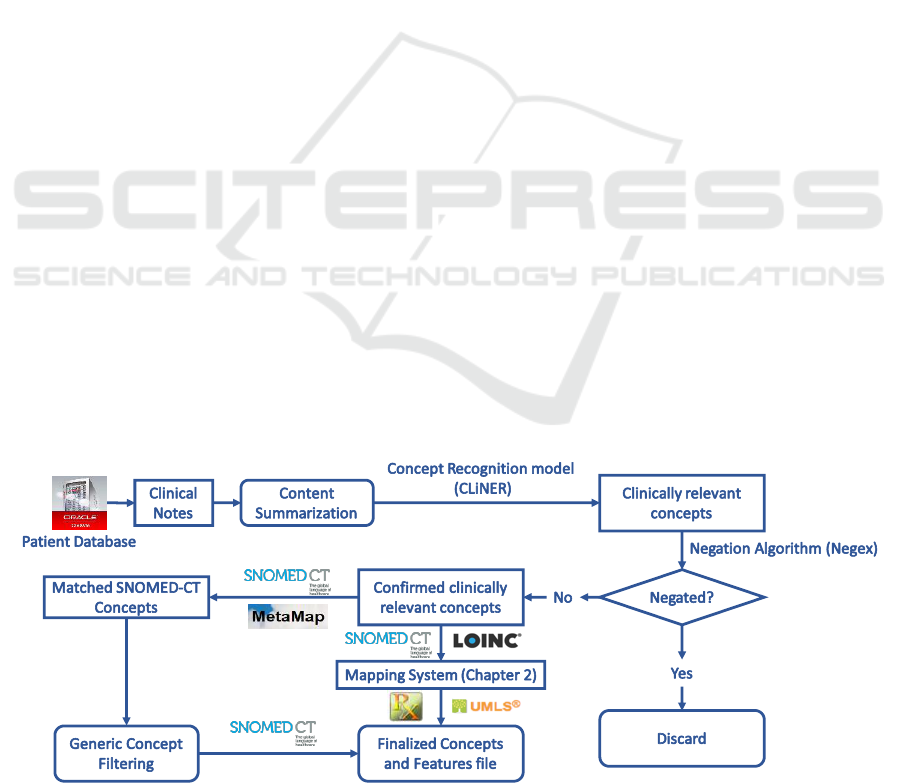
3.1.5 Information Extraction from
Narrative Clinical Texts
We develop an end-to-end “pipeline” (software from
EPIC Systems coded to process data into a more
usable form) for extracting key clinical features from
narrative documents. These features are then filtered
by negation detection and remaining features are
mapped to standardized SNOMED-CT terminology.
Figure 1 shows the feature extraction pipeline from
clinical text. We implement the content
summarization module based on the TextRank
algorithm (Mihalcea and Tarau, 2004). We apply the
CLiNER concept recognition model (Boag et al.,
2018) to extract key clinical features including
problems, procedures, and tests. An improved Negex
(Chapman et al., 2001) algorithm is then used to filter
features within a negated context. We then proceed in
one of two directions: 1) utilize MetaMap to map the
consolidated features to the SNOMED-CT
terminology system and filter out features that are not
mapped. The hierarchical structure of SNOMED-CT
and MetaMap are utilized to remove general concepts
(e.g. “Body structure”, “Clinical finding”,
“Biological agent”) that are situated at the top two
levels in the SNOMED-CT concept tree; 2) utilize the
terminology mapping system developed in Section
3.2 to directly map these concepts to SNOMED-CT.
These standardized concepts can be consolidated into
input features that could be directly input into
machine learning algorithms for knowledge
discovery.
3.2 Data Interoperability with Medical
Terminology Mapping
We apply the concept mapping system described in
(Lee et al., 2016) to standardize all labs and
medications data. For data related to procedures, we
design a similar approach. Instead of mapping the top
scoring UMLS Metathesaurus concepts to either
RxNorm or LOINC terms separately, we attempt to
map the UMLS concepts to both RxNorm and
LOINC because procedures can contain both
medication and lab-related information (Figure 2).
We then select the mapping with the higher matching
score of the two. This process removes redundancies
in the data and produces a condensed feature list
which can be used for machine learning tasks.
Figure 1: Treatment feature extraction from clinical texts.
An Efficient, Robust, and Customizable Information Extraction and Pre-processing Pipeline for Electronic Health Records
313
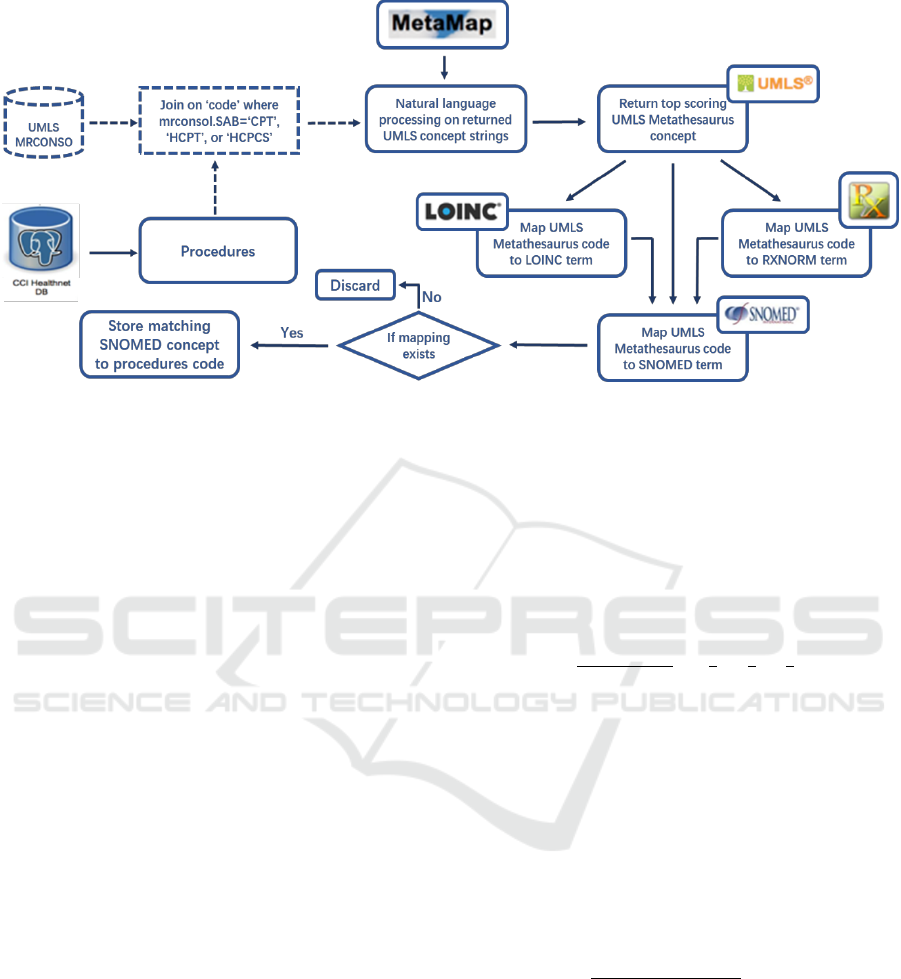
Figure 2: Mapping procedure for CPT/HCPT/HCPCS codes and free-text procedure phrases.
3.3 Characterizing Patient Treatment
Outcomes based on Longitudinal
Laboratory Measurements
In order to characterize patient conditions using
multiple laboratory measurements in the form of
MTS, we develop a novel clustering approach for
irregular MTS based on existing distance metrics for
variable-length time series. DTW, soft-DTW, and
GAK are used to calculate the pairwise distances
between variable-length univariate time series. An
aggregation function is then applied to the distance
between all pairs of corresponding univariate time
series composing the MTS. This produces a pairwise
distance matrix representing the similarity between
each pair of patients.
Clustering based on a pairwise matrix can be done
using hierarchical or medoid-based clustering
algorithms, because it is difficult to determine the
length of the cluster centers when using partition-
based clustering algorithms such as K-means (Liao,
2007). In this study, we apply the K-medoids (Park
and Jun, 2009) clustering algorithm to the distance
matrices.
Here, we describe the entire clustering process
using the Global Alignment Kernel (GAK) metrics
(Cuturi et al., 2007) as an example. GAK can be used
to quantify the similarity between two time series of
varying lengths. It is positive definite, rapidly
computed, and operates on the whole spectrum of
costs of alignments and thus contains a richer
statistics than DTW, which considers only the
minimum of the set of costs (Cuturi et al., 2007).
GAK distance is equal to the sum of the
exponentiated and sign changed similarities of every
alignment pairs:
(1)
where
is the set of all possible alignments
between two series of length n and m, and any
alignment pair
satisfies the warping
restriction
(Cuturi et
al., 2007). Here, is a positive definite kernel
function, and the Gaussian Kernel is used. Distance
between each pair of MTS is calculated by applying
an aggregation function on the GAK distance
between each pair of corresponding univariate time
series. Here, we aggregate the distances using the
weighted average function. Specifically, given two
patients P
x
and P
y
, each characterized by m laboratory
time series
, and non-negative
weights w
1
,w
2
,…,w
m
associated with each laboratory
time series, the aggregated distance is expressed as
(2)
Weights are assigned to each laboratory time series
depending on their importance in characterizing
patient conditions. Alternatively, mean, median, or
the sum function could be used as the aggregation
function. The aggregated distance represents an
alignment score over each pair of univariate time
series and provides a holistic similarity measure for
the pair of MTS. In this study, we compare the
performance of GAK metrics to that of DTW and
soft-DTW when used in MTS clustering.
KDIR 2019 - 11th International Conference on Knowledge Discovery and Information Retrieval
314

4 CASE STUDIES
We demonstrate the use of our EHR information
extraction and pre-processing pipeline for three
different types of disease cases: prostate cancer,
chronic kidney diseases, and cardiovascular diseases.
4.1 Patients with Prostate Cancer
Prostate cancer is the most frequently diagnosed
cancer in 105 countries and the fifth leading cause of
cancer death in men (Bray et al., 2018). It is estimated
that there will be 174,650 new cases of prostate
cancer in the U.S. in 2019 with an associated 31,620
deaths (Siegel et al., 2019). Early prostate cancer
detection has been achieved through prostate
specific antigen (PSA) test and biopsy of tissue
removed during prostatectomy or at autopsy (Bray et
al., 2018). Through mathematical modelling, (Etzioni
et al., 2008) concluded that under the assumption that
stage shift implies survival shift–which motivates
early detection of cancer, PSA screening likely
explains half or more of the mortality reduction
observed in the U.S. since the early 1990s. EHR
provides long-term tracking of patient PSA test
results. These longitudinal data can be extracted using
the lab component IDs or names of the test procedure.
The rate of increase in PSA level, often represented
using PSA doubling time or PSA velocity, has been
widely used in the management of prostate cancer
(Ng et al., 2009).
4.1.1 Information Extraction from EPIC
EHR Database
The extracted dataset covers 98,806 patients with the
ICD-9 code 790.93 or ICD-10 code 97.20, “elevated
prostate specific antigen (PSA)”. This dataset spans
the years 1997-2018 and is composed of patient-level
data (70Mb), problem lists (384Mb), medications
(7.3Gb), billing (167Mb), laboratory orders (10Gb),
and clinical notes (46.1Gb), totalling 64.02
Gigabytes. Patient IDs were successfully encrypted
using SHA-256 encryption. PHI including patient
names, addresses, institutions, age, phone numbers,
and email addresses were detected and encrypted into
dummy tokens.
We applied the clinical concept extraction system
on a subset of patients treated with radioactive seed
implants. An additional 2,194 standardized clinical
features were extracted from their clinical notes,
including “Chronic pain syndrome”, “Placement of
stent”, “Nerve conduction testing”, “Vascular
Calcification”, “Overweight”, “Obstructive sleep
apnea syndrome”, “Neoplasm, metastatic”, and
“Lithotripsy”, etc.
Patient PSA laboratory test results were used as
indicators of disease severity. PSA records were
retrieved by the following method: 1) component IDs
for lab records matching the query string “%PSA%”
were retrieved; 2) PSA-irrelevant lab components
were discarded, leaving 10 unique component IDs
corresponding to “PSA-screening”, “PSA-
monitoring”, “PSA”, “PSA FREE”, “PSA % FREE”,
“PSA, external result”, “PSA, MHS”, “PSA with
reflex FPSA, external result”, “PSA, screening”, and
“PSA, cancer monitoring”; 3) “PSA FREE” and
“PSA % FREE” were removed from the list of
candidate components since free PSA is reported as a
percentage of the total that is not protein bound, i.e.,
free. The higher the free PSA, the lower the likelihood
of cancer; 4) PSA lab records were then retrieved by
patient IDs and the filtered component IDs; 5)
Missing, erroneous, and duplicated records were
removed, and the remaining records were sorted by
date and transformed into time series format for each
patient.
4.1.2 Data Standardization to SNOMED-CT
Using SNOMED-CT ontology as the mapping
standard, we successfully mapped 22,842 out of the
39,570 unique clinical concepts. These 22,842
concepts were mapped to 4,673 unique SNOMED-
CT concepts. Table 2 shows the number of unique
concepts before mapping, with available mapping,
and the number of SNOMED-CT concepts mapped
to. Through this process, we significantly reduced the
feature dimension, removed data redundancy and
inconsistency, and lowered the likelihood of data
collinearity.
Table 2: Mapping results for labs, medications, and
procedures data.
Lab
Procedure
Medication
Total unique
concepts (39,570)
3662
2760
33148
Number of unique
concepts with direct
mapping
1267
696
952
Number of unique
concepts with
indirect mapping
1588
1284
17055
Number of unique
SNOMED-CT
concepts mapped to
1100
1170
2403
An Efficient, Robust, and Customizable Information Extraction and Pre-processing Pipeline for Electronic Health Records
315

4.2 Patients with Chronic Kidney
Disease (CKD)
Kidney is an important organ of human body –
filtering blood, removing waste, balancing fluid, and
controlling the level of electrolytes. Chronic Kidney
Disease (CKD) is becoming more prevalent at a rapid
speed around the world.
CKD can be divided into 5 stages based on
estimated glomerular filtration rate (eGFR)
measurement. Early diagnosis of CKD prevents
patients from regressing into late-stage CKD which
causes serious complications. Late-stage CKD can
lead to end-stage renal disease (ESRD) and
cardiovascular disease (CVD), which steeply increase
patient pain and economic burden. However, the
gradual loss of kidney function is difficult to diagnose
due to the absence of direct evidence from clinical
trials (Moyer, 2012). Hence frequent and regular
measure of serum creatinine—used to calculate
eGFR—is essential for evaluating changes in renal
functions. Identifying trends in eGFR is more
important than one-off readings, as suggested by the
Renal Association, “a progressive fall in eGFR across
serial measurements is more concerning than stable
readings which don’t change over time” (2019).
EHR provides a possibility for health care
organization to monitor and identify early-stage
CKD. Lenart et al. developed clustering techniques to
detect progression of CKD (Lenart et al., 2016). K-
medoids clustering was applied on patients’ routine
measurements and lab tests such as blood pressure,
body mass index, Hemoglobin A1c (HbAlc),
triglycerides and high-density lipid cholesterol
(Lenart et al., 2016). The Cluster Progression Score
(CPS) was designed to measure patients’ relative
health status (Lenart et al., 2016). This clustering
process can help health care organization detect early
stage CKD by monitoring the recorded lab
measurements.
4.2.1 Information Extraction from EPIC
EHR Database
The extracted dataset covers 33,303 patients with the
ICD-9 code starting with “585” or ICD-10 code
starting with “N18”, both referring to “Chronic
Kidney Disease”. This dataset spans the years 1997-
2018 and is composed of patient-level data (24Mb),
problem lists (288Mb), medications (6.74Gb), billing
(1.90Gb), laboratory orders (8.66Gb), and clinical
notes (18.55 Gb), totalling 36.16 Gigabytes. Patient
IDs were successfully encrypted using SHA-256
encryption. PHI including patient names, addresses,
institutions, age, phone numbers, and email addresses
were detected and encrypted into dummy tokens.
Patient eGFR laboratory test results were used as
indications of disease progression. eGFR records
were retrieved by the following method: 1)
component IDs for lab records matching the query
string “%eGFR%” or “%GLOMERULAR
FILTRATION RATE%” were retrieved; 2) Irrelevant
lab components were discarded, leaving 16 unique
component IDs. We then examined eGFR records
matching these component IDs and found that only
records corresponding to two component IDs
“12122727” and “12122728” were well-maintained.
3) eGFR lab records are then retrieved by patient IDs
and these two component IDs. 4) Missing, erroneous,
and duplicated records were removed, and the
remaining records were sorted by date and
transformed into time series format for each patient.
4.3 Patients with Cardiovascular
Disease (CVD)
The CCI-health database (Lee et al., 2016) contains
37,742 patients with CVD from 737 clinical sites.
Processing through the pipeline, each patient is
finally characterized by 11 raw features including
demographics, treatment duration, and co-existing
conditions, and 1,757 standardized features in
SNOMED-CT terminology including laboratory
tests, diagnosed problems, and medications. For each
patient, treatment duration is determined by
calculating the elapsed time between diagnosis
(indicated by the first prescription of a medication)
and the last recorded activity (i.e. procedure, lab,
etc.). Measurements of lipids and lipoproteins are
processed into time series, since these are closely
related to cardiovascular conditions and can
potentially be used to characterize the severity of
CVD. Lack of high-density lipoproteins (HDL) is
significantly associated with the development of
coronary heart disease (Gordon et al., 1977). In
contrast, low-density lipoprotein increases the risk of
heart disease and is considered a “bad” cholesterol
(Gordon et al., 1977). Triglyceride is also associated
with incidence of heart disease but has a less
significant effect (Gordon et al., 1977).
4.3.1 Multivariate Time Series Clustering to
Characterize CVD Treatment
Outcome
In the analysis, we use HDL and LDL measurements
to form an MTS containing two time series for each
patient for clustering. Each of these time series were
KDIR 2019 - 11th International Conference on Knowledge Discovery and Information Retrieval
316
resampled to quarterly frequency (one measurement
every three months). Gaps in the data were filled by
propagating the non-NaN values forward first, and
then backward along a series. For each of the three
types of laboratory measurements, we removed
patients with less than 6 raw measurements or less
than 8 resampled measurements. This produces a data
set containing 3,155 remaining patients. The distance
between each pair of corresponding time series was
calculated using GAK, DTW, and soft-DTW
distances in three separate experiments. Distances
between each pair of MTS was then obtained by
aggregating the two distances between each pair of
corresponding univariate time series using weighted
average, where the weight of LDL measurements was
0.7 and the weight of HDL measurements was 0.3. A
higher weight was assigned to LDL measurements
because LDL is generally considered a stronger risk
factor for CVD than HDL (Badimon and Vilahur,
2012). K-medoids clustering was performed on the
final distance matrix, partitioning the patients into K
groups. Here, we set K=2 and K=3 for each set of
experiments. When K>3, the clusters are over-
partitioned. The quality of clusters is evaluated both
visually and quantitatively. Visually, trends of
laboratory measurements are shown with boxplots of
each patient’s measurement taken at each time point.
Quantitatively, the following statistics are calculated
for each cluster: 1) median of first measured value; 2)
median of the last measured value; 3) difference
between the two medians. Since the goal is to
segregate patients with different treatment outcomes,
ideal clusters of patients should exhibit different
trends of lab measurements.
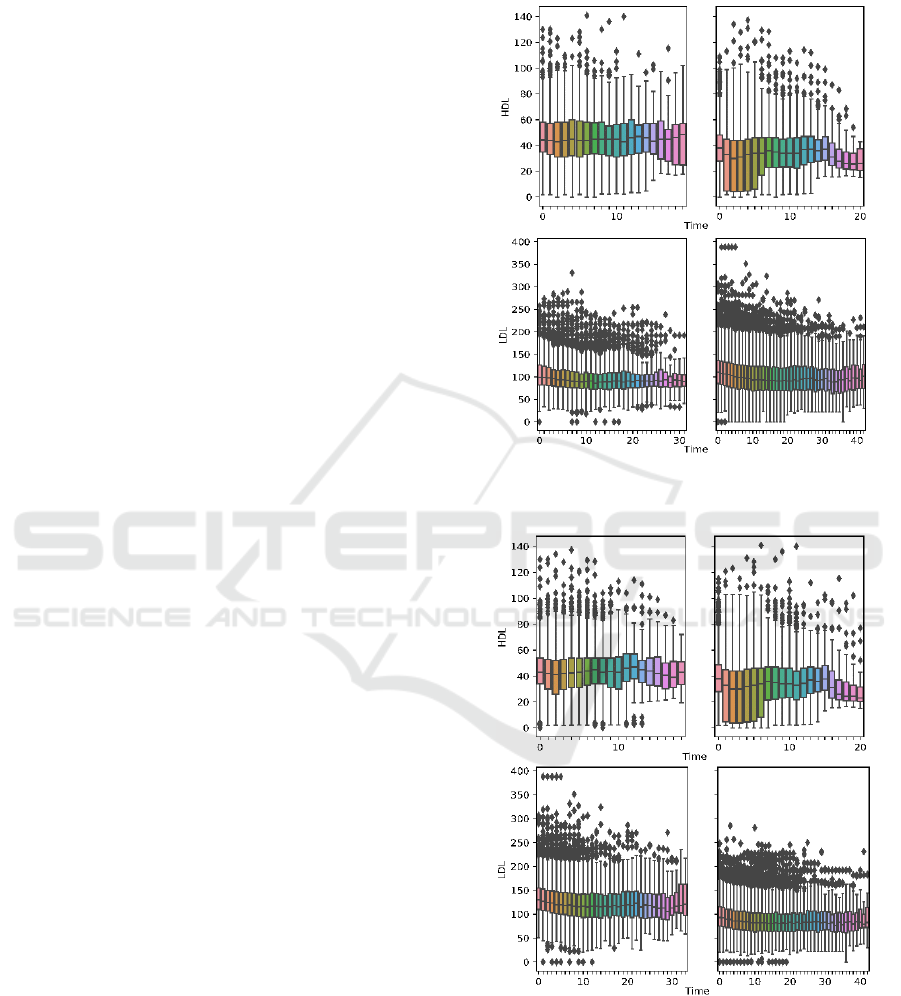
Figures 3-4 show the boxplots of aggregated
laboratory measurements by clusters. Tables 3-4 list
the per-cluster statistics. Results are shown for K=2
and K=3, and for all distance metrics used. Ideally,
clusters of patients showing 1) high HDL
measurements, 2) low LDL measurements, 3) an
upward trend in HDL progression, and 4) a downward
trend in LDL progression should be characterized as
having satisfactory treatment outcome. By comparing
the trend of laboratory progressions and the summary
statistics, we found that when using the GAK distance
metric and setting K=2, we obtain the clusters that
best characterize two patient groups with distinct
outcomes. Cluster 1 satisfies all four characteristics
of good outcome listed above, whereas patients in
Cluster 2 show opposite characteristics except also a
downward trend in LDL progression, with the end
median value slightly above that of Cluster 1. When
using other metrics and K, clusters are not as well-
partitioned (i.e. soft-DTW, K=2), or patients within
the same cluster exhibit trends in HDL and LDL
progression that define opposite qualities of treatment
outcomes (i.e. DTW, K=3).
Figure 3a: Boxplot-aggregated HDL and LDL
measurements using GAK distance and K=2.
Figure 3b: Boxplot-aggregated HDL and LDL
measurements using DTW distance and K=2.
An Efficient, Robust, and Customizable Information Extraction and Pre-processing Pipeline for Electronic Health Records
317
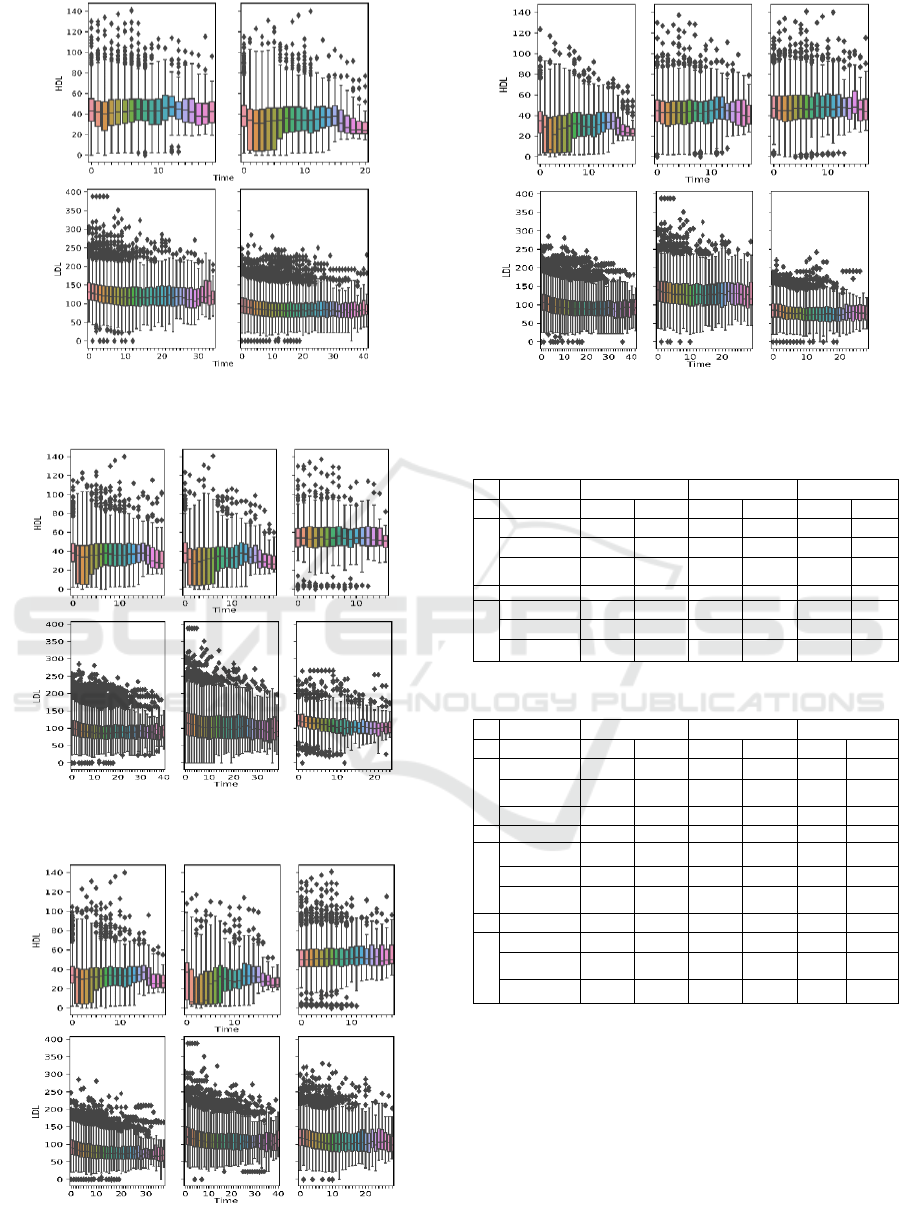
Figure 3c: Boxplot-aggregated HDL and LDL
measurements using soft-DTW distance and K=2.
Figure 4a: Boxplot-aggregated HDL and LDL measurements
using GAK distance and K=3.
Figure 4b: Boxplot-aggregated HDL measurements using
DTW distance and K=3.
Figure 4c: Boxplot-aggregated HDL and LDL
measurements using soft-DTW distance and K = 3.
Table 3: Summary statistics by clusters for K=2.
GAK
DTW
Soft-DTW
Median of
HDL
LDL
HDL
LDL
HDL
LDL
Cluster 1
First Value
44.1
99.3
43.1
130
43
131
Last Value
45
84
42
108
41
108.
Difference
0.9
-15.3
-1.1
-22
-2
-23
Cluster 2
First Value
38
111
38
93
38
93
Last Value
32.8
87
31.3
76
31.9
76
Difference
-5.2
-24
-6.7
-17
-6.1
-17
Table 4: Summary statistics by clusters for K=3.
GAK
DTW
Soft-DTW
Median of
HDL
LDL
HDL
LDL
HDL
LDL
Cluster1
First Value
38
98
34
89.5
35
108
Last Value
34
80
31
73
27.0
84
Difference
-4
-18
-3
-16.5
-7.1
-24
Cluster 2
First Value
38
117
37
123
45
141
Last Value
31.2
103
28
98
43
124
Difference
-6.8
-14
-9
-25
-2
-17
Cluster 3
First Value
54
121
50
119
47
86
Last Value
55.1
94
52
97
47
71.2
Difference
1.1
-27
2
-22
0
-14.8
Complete clustering analysis are presented in Lee
et al. (2019). Furthermore, machine learning results
confirm that this clustering approach produces
promising partitions. Specifically, the groups are
classified with unbiased10-fold cross validation
accuracy of 85-91%, and 83-93% blind prediction
accuracy on independent sets of patients. We will
continue to investigate more robust approaches to
adapt to the different types of diseases and patterns.
KDIR 2019 - 11th International Conference on Knowledge Discovery and Information Retrieval
318

5 CONCLUSIONS
In this paper, we designed a comprehensive
information extraction and pre-processing pipeline
for EPIC-based EHR system. This pipeline consists
of information extraction, de-identification and
encryption, standardization, and time series
processing and clustering. We applied this pipeline to
three cohorts of patients – those with prostate cancer,
chronic kidney diseases, and cardiovascular diseases,
and prepared tabularized data files with standardized
terminologies and reduced feature dimensions. These
data files can be input into machine learning
algorithms for further knowledge discovery.
Using longitudinal laboratory records measured
during care delivery, we have also uncovered patient
subgroups with different outcomes. We introduced an
approach to cluster irregular MTS by aggregating
distances between univariate time series. This allows
us to utilize multiple types of laboratory records for
each patient to characterize treatment outcome.
Among the distance metrics used, GAK produced the
best clusters.
The computational pipeline can be adapted to
similar large EHR systems and datasets and for other
patient cohorts. These modifications include: 1)
redesigning SQL queries by modifying diagnosis
codes when extracting patient ID list to accommodate
different target cohorts; 2) modifying SQL queries to
extract additional data from target disease-specific
tables; 3) reidentifying new motifs through expert
recommendation and/or manual exploration of free-
text data and redesigning new regular expressions for
pattern-based feature extraction.
Through the design and implementation of this
pipeline, we have tackled some major big data
challenges including volume, variety, veracity, and
especially value. This results in a highly robust,
efficient, and customizable pipeline that can be easily
applied to current EHR databases to fulfil their
potential in both academic and clinical research.
Future works remains in the search of more robust
and systematic methods for evaluating the quality of
time series clusters. Given the complexity of irregular
MTS and the difficulty involved in labelling clusters,
it is necessary to combine effective visualization
techniques with quantitative measures to achieve this
task. Machine learning analysis can help to quantify
the separation performance of the clustering results.
Beyond the EHR data, there is also an opportunity to
combine the EHR data with other types of OMICs
data obtained from outside laboratory tests which are
currently not recorded within the EHR systems.
ACKNOWLEDGEMENTS
This work is partially supported by grants from the
National Science Foundation, and in-kind support
from the Southeast Permanente Medical Group.
Findings and conclusions in this paper are those of the
authors and do not necessarily reflect the views of the
National Science Foundation or the Southeast
Permanente Medical Group. The authors would like
to thank Dr. Jeffrey Hoffman, Dr. Rahul Nayak and
Dr. Nirvan Mukerji from the Southeast Permanente
Medical Group for their clinical advice and
collaboration. The authors thank Dr. Randall
Robinson for his critique, and comments from the
anonymous reviewers for improving the manuscript.
The authors also thank the Georgia Tech students,
Thomas Adams, Chenman Cheng, Scott Eckhaus,
Qixuan Hou, Ayush Kayastha, Chris Kwan, Eunho
Kwon, Di Liu, Joe Malecki, Autumn Phillips, and
Peijue Zhang, who helped with the initial usage and
testing of the anonymized data.
REFERENCES
2019. About eGFR [Online]. The Renal Association.
Available: https://renal.org/information-resources/the-
uk-eckd-guide/about-egfr/ [Accessed 4/16 2019].
Asan, O., Young, H. N., Chewning, B. & Montague, E.
2015. How physician electronic health record screen
sharing affects patient and doctor non-verbal
communication in primary care. Patient education and
counseling, 98, 310-316.
Badimon, L. & Vilahur, G. 2012. LDL‐cholesterol versus
HDL ‐ cholesterol in the atherosclerotic plaque:
inflammatory resolution versus thrombotic chaos.
Annals of the New York Academy of Sciences, 1254, 18-
32.
Bashyam, V. & Taira, R. K. Indexing anatomical phrases in
neuro-radiology reports to the UMLS 2005AA. AMIA
Annual Symposium Proceedings, 2005. AMIA, 26.
Baud, R. H., Lovis, C., Rassinoux, A.-M. & SCHERRER,
J.-R. Morpho-semantic parsing of medical expressions.
Proceedings of the AMIA Symposium, 1998. AMIA,
760.
Birman-Deych, E., Waterman, A. D., Yan, Y., Nilasena, D.
S., Radford, M. J. & Gage, B. F. 2005. Accuracy of
ICD-9-CM codes for identifying cardiovascular and
stroke risk factors. Medical care, 480-485.
Boag, W., Sergeeva, E., Kulshreshtha, S., Szolovits, P.,
Rumshisky, A. & Naumann, T. 2018. CliNER 2.0:
Accessible and Accurate Clinical Concept Extraction.
arXiv preprint arXiv:1803.02245.
Bray, F., Ferlay, J., Soerjomataram, I., Siegel, R. L., Torre,
L. A. & Jemal, A. 2018. Global cancer statistics 2018:
GLOBOCAN estimates of incidence and mortality
An Efficient, Robust, and Customizable Information Extraction and Pre-processing Pipeline for Electronic Health Records
319

worldwide for 36 cancers in 185 countries. CA: a
cancer journal for clinicians, 68, 394-424.
Brockwell, P. J., Davis, R. A. & Calder, M. V. 2002.
Introduction to time series and forecasting, Springer.
Carlstein, E. 1992. Resampling techniques for stationary
time series: some recent developments. IMA
VOLUMES IN MATHEMATICS AND ITS
APPLICATIONS, 45, 75-75.
Chapman, W. W., Bridewell, W., Hanbury, P., Cooper, G.
F. & Buchanan, B. G. 2001. A simple algorithm for
identifying negated findings and diseases in discharge
summaries. Journal of biomedical informatics, 34, 301-
310.
Cuturi, M. & Blondel, M. Soft-DTW: a differentiable loss
function for time-series. Proceedings of the 34th
International Conference on Machine Learning-
Volume 70, 2017. JMLR. org, 894-903.
Cuturi, M., Vert, J.-P., Birkenes, O. & Matsui, T. A kernel
for time series based on global alignments. 2007 IEEE
International Conference on Acoustics, Speech and
Signal Processing-ICASSP'07, 2007. IEEE, II-413-II-
416.
De Bruijn, B., Cherry, C., Kiritchenko, S., Martin, J. & Zhu,
X. 2011. Machine-learned solutions for three stages of
clinical information extraction: the state of the art at
i2b2 2010. Journal of the American Medical
Informatics Association, 18, 557-562.
Díaz, N. P. C., López, M. J. M., Vázquez, J. M. & Álvarez,
V. P. 2012. A machine‐learning approach to negation
and speculation detection in clinical texts. Journal of
the American society for information science and
technology, 63, 1398-1410.
Elkin, P. L., Brown, S. H., Bauer, B. A., Husser, C. S.,
Carruth, W., Bergstrom, L. R. & Wahner-Roedler, D.
L. 2005. A controlled trial of automated classification
of negation from clinical notes. BMC medical
informatics and decision making, 5, 13.
Etzioni, R., Tsodikov, A., Mariotto, A., Szabo, A., Falcon,
S., Wegelin, J., Karnofski, K., Gulati, R., Penson, D. F.
& Feuer, E. 2008. Quantifying the role of PSA
screening in the US prostate cancer mortality decline.
Cancer Causes & Control, 19, 175-181.
Gillum, R. F. 2013. From papyrus to the electronic tablet: a
brief history of the clinical medical record with lessons
for the digital age. The American journal of medicine,
126, 853-857.
Gindl, S., Kaiser, K. & Miksch, S. 2008. Syntactical
negation detection in clinical practice guidelines.
Studies in health technology and informatics, 136, 187.
Goldin, I. & Chapman, W. W. Learning to detect negation
with ‘not’in medical texts. Proc Workshop on Text
Analysis and Search for Bioinformatics, ACM SIGIR,
2003.
Gordon, T., Castelli, W. P., Hjortland, M. C., Kannel, W.
B. & Dawber, T. R. 1977. High density lipoprotein as a
protective factor against coronary heart disease: the
Framingham Study. The American journal of medicine,
62, 707-714.
Gunter, T. D. & Terry, N. P. 2005. The emergence of
national electronic health record architectures in the
United States and Australia: models, costs, and
questions. Journal of medical Internet research, 7, e3.
Henry, J., Pylypchuk, Y., Searcy, T. & Patel, V. 2016.
Adoption of electronic health record systems among US
non-federal acute care hospitals: 2008-2015. ONC data
brief, 35, 1-9.
Honnibal, M. & Johnson, M. An improved non-monotonic
transition system for dependency parsing. Proceedings
of the 2015 Conference on Empirical Methods in
Natural Language Processing, 2015. 1373-1378.
Jain, N. L. & Friedman, C. Identification of findings
suspicious for breast cancer based on natural language
processing of mammogram reports. Proceedings of the
AMIA Annual Fall Symposium, 1997. AMIA, 829.
Košmelj, K. & Batagelj, V. 1990. Cross-sectional approach
for clustering time varying data. Journal of
Classification, 7, 99-109.
Kreindler, D. M. & Lumsden, C. J. 2016. The effects of the
irregular sample and missing data in time series
analysis. Nonlinear Dynamical Systems Analysis for the
Behavioral Sciences Using Real Data. CRC Press.
Lee, C. F., Lee, J. C. & Lee, A. C. 2000. Statistics for
business and financial economics, Springer.
Lee, E. K., Wang, Y., Hagen, M. S., Wei, X., DAVIS, R.
A. & Egan, B. M. Machine Learning: Multi-site
evidence-based best practice discovery. International
Workshop on Machine Learning, Optimization, and
Big Data, 2016. Springer, 1-15.
Lee, E. K., Wang, Y., Hagen, M. S., Li, Z., Wei, X.,
DAVIS, R. A. & EGAN, B. M. A Machine Learning
Framework for Multi-site Evidence-based Best Practice
Discovery. 2019 Caterpillar & INFORMS Innovative
Applications in Analytics Award 2
nd
place. To appear
in INFORMS Journal on Applied Analytics.
Lenart, M., Mascarenhas, N., Xiong, R. & FLOWER, A.
Identifying risk of progression for patients with Chronic
Kidney Disease using clustering models. 2016 IEEE
Systems and Information Engineering Design
Symposium (SIEDS), 2016. IEEE, 221-226.
Li, L., Chase, H. S., Patel, C. O., Friedman, C. & Weng, C.
Comparing ICD9-encoded diagnoses and NLP-
processed discharge summaries for clinical trials pre-
screening: a case study. AMIA Annual Symposium
Proceedings, 2008. American Medical Informatics
Association, 404.
Liao, T. W. 2007. A clustering procedure for exploratory
mining of vector time series. Pattern Recognition, 40,
2550-2562.
Long, W. Extracting diagnoses from discharge summaries.
AMIA annual symposium proceedings, 2005. AMIA,
470.
Marlin, B. M., Kale, D. C., Khemani, R. G. & Wetzel, R.
C. Unsupervised pattern discovery in electronic health
care data using probabilistic clustering models. 2012.
ACM, 389-398.
Marteau, P.-F. 2009. Time warp edit distance with stiffness
adjustment for time series matching. IEEE
Transactions on Pattern Analysis and Machine
Intelligence, 31, 306-318.
KDIR 2019 - 11th International Conference on Knowledge Discovery and Information Retrieval
320

Miaskowski, C., Cooper, B. A., Paul, S. M., Dodd, M., Lee,
K., Aouizerat, B. E., West, C., Cho, M. & Bank, A.
Subgroups of patients with cancer with different
symptom experiences and quality-of-life outcomes: a
cluster analysis. 2006.
Mihalcea, R. & Tarau, P. Textrank: Bringing order into text.
Proceedings of the 2004 conference on empirical
methods in natural language processing, 2004.
Moyer, V. A. 2012. Screening for chronic kidney disease:
US Preventive Services Task Force recommendation
statement. Annals of internal medicine, 157, 567-570.
Mutalik, P. G., Deshpande, A. & Nadkarni, P. M. 2001. Use
of general-purpose negation detection to augment
concept indexing of medical documents: a quantitative
study using the UMLS. Journal of the American
Medical Informatics Association, 8, 598-609.
Ng, M. K., Van AS, N., Thomas, K., Woode‐Amissah, R.,
Horwich, A., Huddart, R., Khoo, V., Thompson, A.,
Dearnaley, D. & Parker, C. 2009. Prostate‐specific
antigen (PSA) kinetics in untreated, localized prostate
cancer: PSA velocity vs PSA doubling time. BJU
international, 103, 872-876.
Park, H.-S. & Jun, C.-H. 2009. A simple and fast algorithm
for K-medoids clustering. Expert systems with
applications, 36, 3336-3341.
Ramoni, M., Sebastiani, P. & Cohen, P. 2002. Bayesian
clustering by dynamics. Machine learning, 47, 91-121.
Ruch, P., Baud, R. H., Rassinoux, A.-M., Bouillon, P. &
Robert, G. Medical document anonymization with a
semantic lexicon. Proceedings of the AMIA
Symposium, 2000. American Medical Informatics
Association, 729.
Sakoe, H. Dynamic programming approach to continuous
speech recognition. 1971 Proc. the International
Congress of Acoustics, Budapest, 1971.
Settles, B. Biomedical named entity recognition using
conditional random fields and rich feature sets.
Proceedings of the International Joint Workshop on
Natural Language Processing in Biomedicine and its
Applications (NLPBA/BioNLP), 2004.
Sibanda, T. & Uzuner, O. Role of local context in automatic
deidentification of ungrammatical, fragmented text.
2006. Association for Computational Linguistics, 65-
73.
Siegel, R. L., Miller, K. D. & Jemal, A. 2019. Cancer
statistics, 2019. CA: a cancer journal for clinicians, 69,
7-34.
Singhal, A. & Seborg, D. E. 2005. Clustering multivariate
time‐series data. Journal of Chemometrics: A Journal
of the Chemometrics Society, 19, 427-438.
Sweeney, L. Replacing personally-identifying information
in medical records, the Scrub system. Proceedings of
the AMIA annual fall symposium, 1996. AMIA, 333.
Taira, R. K., Bui, A. A. & Kangarloo, H. Identification of
patient name references within medical documents
using semantic selectional restrictions. Proceedings of
the AMIA Symposium, 2002. American Medical
Informatics Association, 757.
Turchin, A., Kolatkar, N. S., Grant, R. W., Makhni, E. C.,
Pendergrass, M. L. & Einbinder, J. S. 2006. Using
regular expressions to abstract blood pressure and
treatment intensification information from the text of
physician notes. Journal of the American Medical
Informatics Association, 13, 691-695.
Waitman, L. R., Warren, J. J., Manos, E. L. & Connolly, D.
W. Expressing observations from electronic medical
record flowsheets in an i2b2 based clinical data
repository to support research and quality
improvement. AMIA Annual Symposium Proceedings,
2011. AMIA, 1454.
Wellner, B., Huyck, M., Mardis, S., Aberdeen, J., Morgan,
A., Peshkin, L., Yeh, A., Hitzeman, J. & Hirschman, L.
2007. Rapidly retargetable approaches to de-
identification in medical records. Journal of the
American Medical Informatics Association, 14, 564-
573.
Wells, B. J., Chagin, K. M., Nowacki, A. S. & Kattan, M.
W. 2013. Strategies for handling missing data in
electronic health record derived data. Egems, 1.
Zikopoulos, P. & Eaton, C. 2011. Understanding big data:
Analytics for enterprise class hadoop and streaming
data, McGraw-Hill Osborne Media.
An Efficient, Robust, and Customizable Information Extraction and Pre-processing Pipeline for Electronic Health Records
321
