
Influence of Emotions on Software Developer Productivity
Mohammed Anany, Heba Hussien, Sherif G. Aly and Nourhan Sakr
Department of Computer Science and Engineering, The American University in Cairo, Cairo, Egypt
Keywords: Software Productivity, Developer Productivity, Emotions, Affects, Evaluation, Measurement, Influence.
Abstract: The Software developer productivity is an important indicator that has attracted the attention of the industry
over the years. It has been established that improving software productivity enhances the performance of
organizations. Despite its importance, a full understanding of contextual factors and how they influence
productivity is not attained. One such important factor is the developer’s emotions. In this paper, we conduct
an experiment on 11 participants where they attempt to solve 10 ACM-style problems as we monitor their
emotions and behaviour in the background. The experiments performed achieve an accuracy of 55.4% on the
test set using a random forest classifier. There is room for multiple improvements such as increasing dataset
size, performing class balancing, and utilizing different aggregation methods for the data. This paper opens a
different track for experimentation relating to the relationship between emotions and software productivity.
Achieving a better understanding of this relationship can aid further research that would utilize it to build
context aware and pervasive systems that can automatically react to developers’ emotions when going through
a low productivity phase and orient them towards emotions that are correlated with positive productivity.
1 INTRODUCTION
Enhancing software developer productivity has
become a primary target for many corporate
organizations since it reflects on the performance and
success of the company. It is already established that
focusing on human resources can lead to improved
productivity (Boehm and Papaccio, 1988; Sampaio et
al., 2010), and this has made the industry become
more employee centric and try to enhance their work
environment. One important contextual factor is the
developer’s emotions, and this has been shown to
affect multiple work-related variables such as
decision making, motivation, meeting deadlines,
among others (Barsade and Gibson, 2007). Thus, it is
important to understand how emotions play a role in
software development. Building a better
understanding will aid further research to investigate
methods to enhance software developer productivity
through monitoring changes in emotions and trying to
orient them towards a mindset that is positively
correlated with productivity. Even better, pervasive
systems can be created that automatically suggest
content and actions to the developer based on sensors
that monitor the behavior and emotions of the
developers.
Looking at existing research in the field, few
studies have been conducted to address the impact of
emotions on developer productivity, and a consensus
has not been reached with regards to the findings
reported. Some studies correlate increased
productivity with positive emotions such as happiness
(Graziotin et al., 2013), while others reported that
some negative emotions such as anger and frustration
can lead to a boost in productivity (Wrobel, 2013).
Furthermore, assessing developers’ productivity is a
difficult task since there hasn’t been an agreement on
a unified metric by researchers (Oliveira et al., 2017).
Looking at the existing research, studies in this
area relied on different methods of capturing affective
data as well as productivity measures. Some studies
simply collected responses from developers on their
opinion concerning the relationship between
emotions and productivity through questionnaires
(Wrobel, 2013; Graziotin et al., 2017; Graziotin et al.,
2018). Other studies conducted actual experiments to
collect data and analyze them. A subset of them
utilized self-assessment as a primary method of
evaluating the software productivity of developers as
they are working on software development tasks
(Barsade and Gibson, 2007; Graziotin et al., 2014a;
Graziotin et al., 2014b; Graziotin et al., 2015).
Another group of studies tried to capture emotions
from text through sentiment analysis. The text is
usually in the form of commit logs and repository
comments (Mäntylä et al., 2016; Murgia et al., 2014;
Anany, M., Hussien, H., Aly, S. and Sakr, N.
Influence of Emotions on Software Developer Productivity.
DOI: 10.5220/0008068800750082
In Proceedings of the 9th International Conference on Pervasive and Embedded Computing and Communication Systems (PECCS 2019), pages 75-82
ISBN: 978-989-758-385-8
Copyright
c
2019 by SCITEPRESS – Science and Technology Publications, Lda. All rights reserved
75
Ortu et al., 2015; Sinha et al., 2016). Some
researchers have relied on more intrusive
technologies to monitor emotions such as biometric
sensors that participants wear during the experiments
(Fritz et al., 2014; Muller and Fritz, 2015; Müller and
Fritz, 2016; Züger et al., 2018). Few studies also tried
to induce emotions in developers before they
performed the experiment as a way of investigating
emotions’ impact on productivity (Khan et al., 2010).
Despite the available studies, inconsistencies still
exist in the findings. This can be due to the difficulties
associated with measuring emotions and software
productivity accurately. It should also be noted that
monitoring the impact of emotions on productivity
requires the ability to assess changes in productivity
in short time spans, which might not necessarily make
the existing metrics suitable. It was also observed that
facial expression analysis was not explored as an
option for evaluating emotions in the existing studies.
These points inspired us to conduct this investigation
as an attempt to further understand the influence of
emotions on the productivity of software developers.
The rest of the paper is divided into the following
sections. Section 2 provides some background
information relating to emotions and productivity.
Section 3 discusses the existing work in the field.
Section 4 discusses the method we follow to conduct
our experiment as well as the details of the setup and
data collected. Section 5 discusses the results of our
analysis. Section 6 highlights future contributions
that can build on our current progress. Finally, section
7 concludes the paper.
2 BACKGROUND
Studying the influence of emotions on software
productivity requires measuring these 2 items in order
to quantitatively assess them. There are multiple ways
to perform measurements. Looking at emotions, these
could be captured from different channels such as
facial expressions, voice, text, keystrokes and mouse
movements, biometrics, and body gestures (Garcia-
Garcia et al., 2017; Poria et al., 2017). Multiple APIs
exist that support facial expression recognition, voice
analysis, and text analysis. Little support exists for
capturing emotions from keystrokes and mouse
movements and body gestures. Biometric sensors
typically come with API support but are expensive.
There are multiple emotion representations that
exist; however, the most common ones are the
discrete model and the dimensional model. The
discrete model is derived from Darwin’s work in
“The Expression of Emotions in Man and Animals”
(Borod, 2000). Paul Ekman identified 15 “families of
emotion” that either have unique facial or vocal
expressions (Ekman, 1993). These are: amusement,
anger, contempt, disgust, embarrassment, excitement,
fear, guilt, pride in achievement, relief,
sadness/distress, satisfaction, sensory pleasure, and
shame. Inspired by them, happiness, anger, disgust,
sadness, fear, and surprise were identified as being
universal facial expressions and have been widely
used by researchers in the field of Affective
Computing (Garcia-Garcia et al., 2017; Deshmukh
and Jagtap, 2017; McDuff et al., 2016). As for the
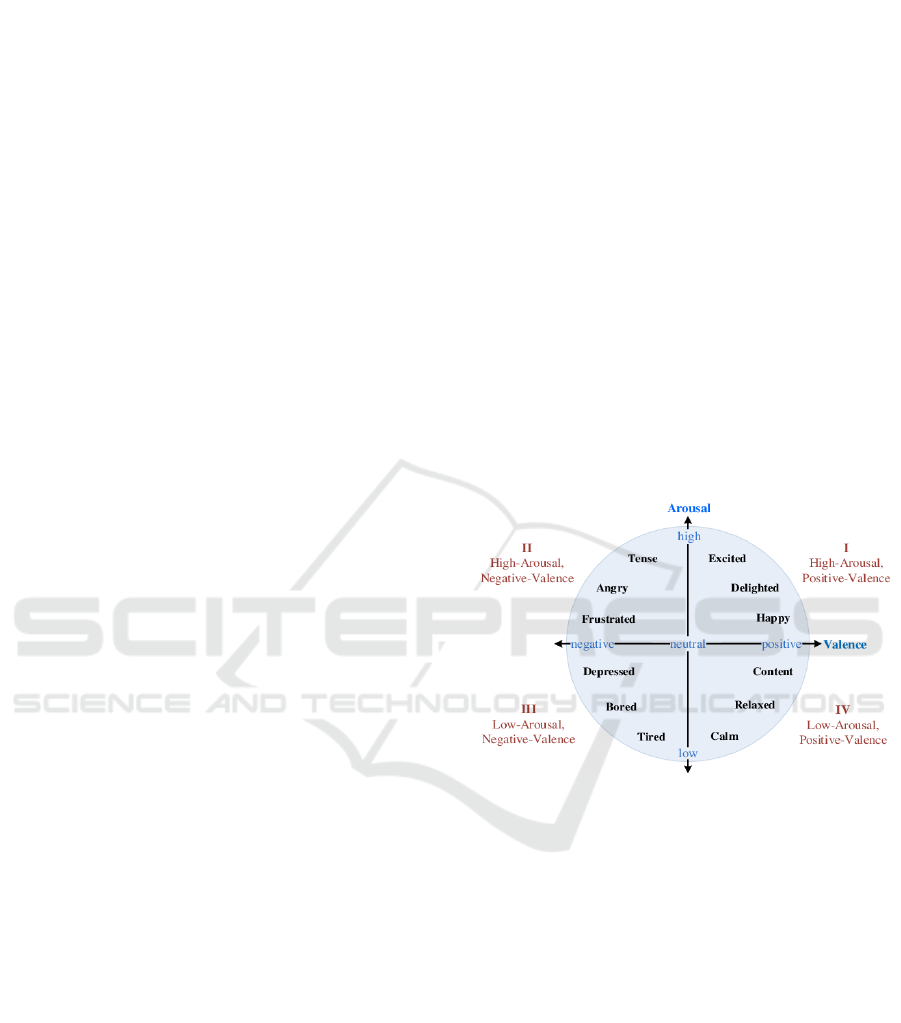
dimensional model, the most famous variation is the
valence, arousal, and dominance (VAD) one. Valence
describes the attractiveness to an experience (pleasant
or unpleasant), arousal indicates the activation level
of a person due to a stimulus (e.g. anger gives a high
arousal value and boredom gives a low arousal value),
and dominance describes the level of control the
person is feeling. Figure 1 illustrates an example of
the VA emotional space.
Figure 1: Valence-arousal emotion representation.
As for software productivity, various metrics have
been introduced over the years. The oldest and most
popular ones are the single-ratio metrics such as
Lines-of-Code (LOC) and Function Points (FP)
(Petersen, 2011). Data Envelopment Analysis (DEA)
was also another metric that was introduced that
gained some popularity in the industry (Petersen,
2011). Other metrics include number of tasks,
weighted factors methods, number of modification
requests, change points, and use case points
(Petersen, 2011; Oliveira et al., 2017). Despite the
various metrics that were introduced over the years, it
appears that classical methods such as LOC and FP
are the most adopted in the industry due to their
simplicity and ease of use.
PECCS 2019 - 9th International Conference on Pervasive and Embedded Computing and Communication Systems
76

3 RELATED WORK
This section discusses and analyses previous
contributions on the influence of emotions on the
productivity of software developers. The
contributions are grouped according to the methods
of capturing emotions and software productivity data.
3.1 Questionnaire-based
Methods that relied on collecting data explicitly from
developers usually utilized web-based questionnaires
(Wrobel, 2013), Scale of Positive and Negative
Experience (SPANE), and open-ended questions
(Graziotin et al, 2017; Graziotin et al., 2018). Reports
show that the top consequences of unhappiness
include low productivity, low code quality, lower
motivation, work withdrawal, delay, and low focus.
The top 10 for happiness include high productivity,
high motivation, high code quality, higher self-
accomplishment, and high work engagement and
perseverance (Graziotin et al., 2018).
While this method acquires direct information, the
problem with it is that experimental evaluation is not
performed, so developers report on their past
experiences which may be subject to bias and
inaccurate reporting.
3.2 Self-assessment
Self-assessment as an instrument for data collection
relies on the perception of the developer during
evaluation. Some studies solely relied on it, while
others included it for verification purposes. Self-
assessment techniques are various and include Self-
Assessment Manikin (SAM), SPANE, pre-task and
post-task interviews, observations, and email
exchanges. Experiments varied in sizes, varying from
2 participants (Graziotin et al., 2015) to 42
participants (Graziotin et al., 2014b). In most
experiments surveyed, most authors interrupted the
participants at 5 to 10-minute intervals to solve the
self-assessment questions while they are performing
the instructed tasks. Some results show that there is a
correlation between the 2 affective states (valence and
dominance) and the self-assessed productivity, but no
correlation was built for arousal (Graziotin et al.,
2013; Graziotin et al., 2014a). Other reports showed
that positive affects correlate with high productivity
while negative affects result in low productivity
(Graziotin et al., 2015).
Self-assessment is one step better than simply
querying developers since it involves actual
experiments, however it suffers from the inability to
capture a continuous stream of emotions because it is
usually performed at fixed time intervals. There is
also latency between sensing an emotion and
reporting it, which can result in confusions. Self-
assessment relies on the subjective evaluation of the
participant, which can form inconsistencies across
different individuals.
3.3 Text Analysis
Text analysis is yet another method for correlating
emotions with productivity. These are typically used
with platforms that support developer projects such as
Jira and GitHub. Most evaluation was conducted
using text sentiment analysis tools. These studies
have access to huge amount of data such as 560
thousand Jira comments (Ortu et al., 2015), 28,466
GitHub projects (Sinha et al., 2016), and 700,000 Jira
issue reports with over 2,000,000 comments (Mäntylä
et al., 2016) which is good for generalization
attempts. Some reports state that the issue fixing time
(measure of productivity utilised) was shorter for
happier developers, while negative emotions resulted
in longer issue fixing time (Ortu et al., 2015). Others
showed that negative sentiments were 10% more than
positive sentiments, with most of the sentiments
being neutral (Sinha et al., 2016).
The problem is that text analysis is an indirect way
of capturing emotions as compared to methods that
rely on physical traits, such as facial expressions.
Studying commit logs and comments is a limitation
because this category of text tends to be formal and
short and is often restricted by companies in terms of
writing style. This makes it more difficult to extract
emotions from the text, which was reflected in the
results, showing that most of the sentiments were, in
fact, neutral (Sinha et al., 2016).
3.4 Biometric Sensors
Biometric sensors have been used by researchers to
evaluate emotions in several fields, such as
psychology (Muller and Fritz, 2015). The studies
usually involved participants performing a predefined
task that usually lasted between 1 and 1.5 hours long.
The number of participants varied between 10 and 17,
and they were usually fitted with sensors such as eye
trackers, EDA and EEG sensors, wristbands, and
chest straps (Fritz et al., 2014; Müller and Fritz,
2016). Most studies reported on task difficulty and
very few addressed the issue in relation to emotions.
Studies that utilised biometric sensors suffered
from requiring an expensive setup. The technique is
also invasive since it requires the participants to wear
Influence of Emotions on Software Developer Productivity
77
wristbands and headbands. The process is also
tedious because the sensor data needs to be filtered
and cleaned. Measurement failures are also expected
because of inappropriate equipment setup or shifting
of equipment during work.
3.5 Inducing Emotions
Inducing emotions is a less popular approach towards
the investigation. A study was conducted by Khan et
al. in 2010 which tried to see the impact of mood on
debugging performance (Khan et al., 2010). The
study involved making the participants watch mood-
inducing movie clips prior to performing the tasks.
The results show that moods, particularly arousal,
affected the programmers’ performance. An increase
in arousal and/or valence resulted in an increase in the
performance of algorithm-tracing tasks.
The main problem with inducing emotions,
however, is that emotion measurements are not
actually performed. Assuming the inducing process
was successful, nothing guarantees their persistence
as the participants are working on the tasks.
4 METHODOLOGY
This section discusses the design of our experiment
with the objective of understanding the influence of
emotions on software productivity. We discuss the
experiment setup, the data that is collected, how it is
collected, and how it is prepared for analysis.
4.1 Experiment Details
The experiment involves participants attempting to
solve 10 ACM-style problems in an hour. The
problems are selected from CodeForces (Problemset,
n.d.) from the 2nd division sets with rated difficulties
of A and B only. These problems are relatively easy
and don’t require in-depth algorithmic knowledge to
be able to solve them. The complexity of the
problems was chosen to be low because the focus is
on having participants mainly spend their time on
implementation rather than critical thinking. This is
because it is easier to evaluate aspects of productivity
that are related to actual implementation rather than
thinking which isn’t easily measurable.
A unified language is chosen to control the
experiment for the sake of analysis, so participants are
instructed to develop their implementations in C++.
They are also instructed to develop on Visual Studio
Code on Windows. As they are working, a camera is
used to record the participants’ faces in order to
analyse their facial expressions. Emotion data is
captured by analysing the facial expressions, which is
performed using Affectiva’s APIs (Affectiva
Windows APIs, n.d.). Productivity and activity data
are collected by logging data in the background as the
participant is working on the computer. While the
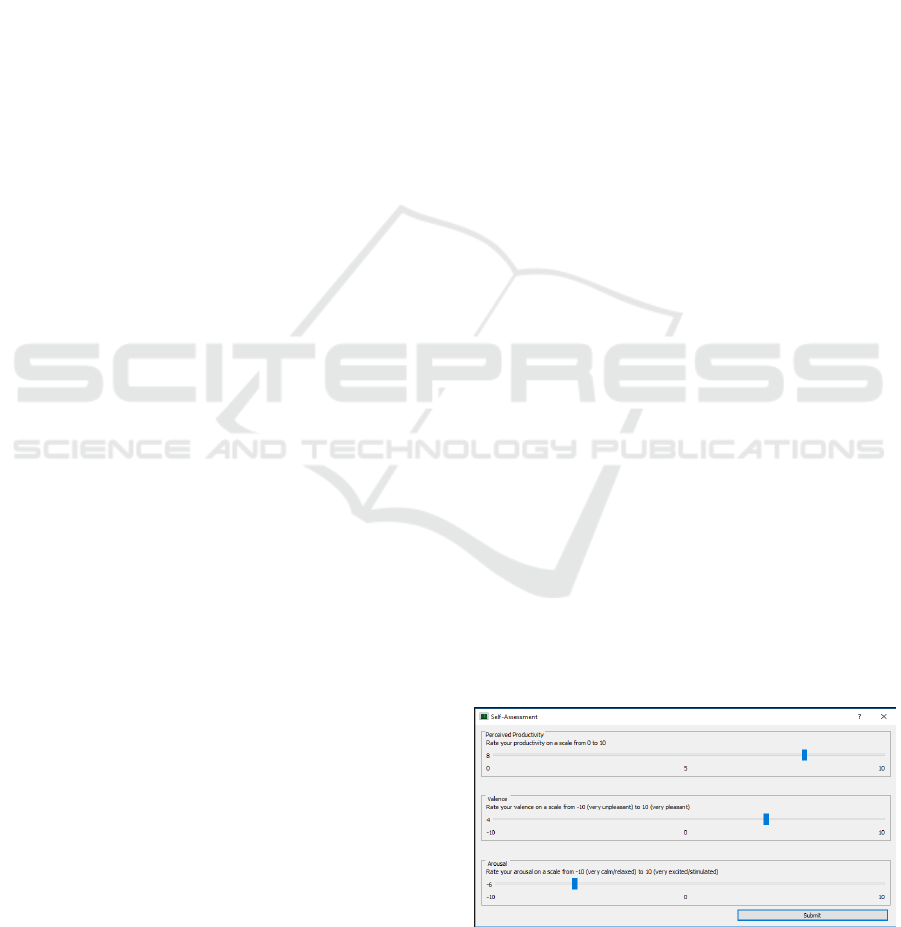
participants are working, a self-assessment window
pops up at 5-minute intervals to collect explicit
information from the participants on their
productivity and emotions. Figure 2 illustrates the
self-assessment window used.
4.2 Setup and Procedure
The participants first sign a consent form agreeing to
participate in the experiment before starting. Then
they fill out a form to collect some background
information about the participant. This information is:
name, gender, date of birth, nationality, university,
major, class standing, programming experience in
years, whether the person participated in ACM
contests previously or not, and familiarity with ACM-
style problems on a scale from 1 to 5.
Then, the participant is handed a hard copy of the
problem set and a sheet containing hints for some of
the problems. The participants are free to make use of
the hints or otherwise disregard them. Before starting,
the experiment coordinator goes through the
problems with the participants and explains the
problems to them. This is done because we want to
maximize the amount of time that participants spend
on implementation as opposed to reading or thinking.
The coordinator then explains the development
environment to the participants. This includes
familiarizing them with Visual Studio Code, how to
run the local test cases, and how to make submissions
through CodeForces to get a verdict for their
solutions. Participants are given CodeForces handles
that were prepared beforehand to be used for the
experiment. When ready, the participants are seated
at the workstations and the 1-hour experiment starts.
Figure 2: Self-assessment pop-up window. Productivity is
evaluated on a scale between 0 and 10. Valence and arousal
are evaluated on a scale between -10 and 10.
PECCS 2019 - 9th International Conference on Pervasive and Embedded Computing and Communication Systems
78
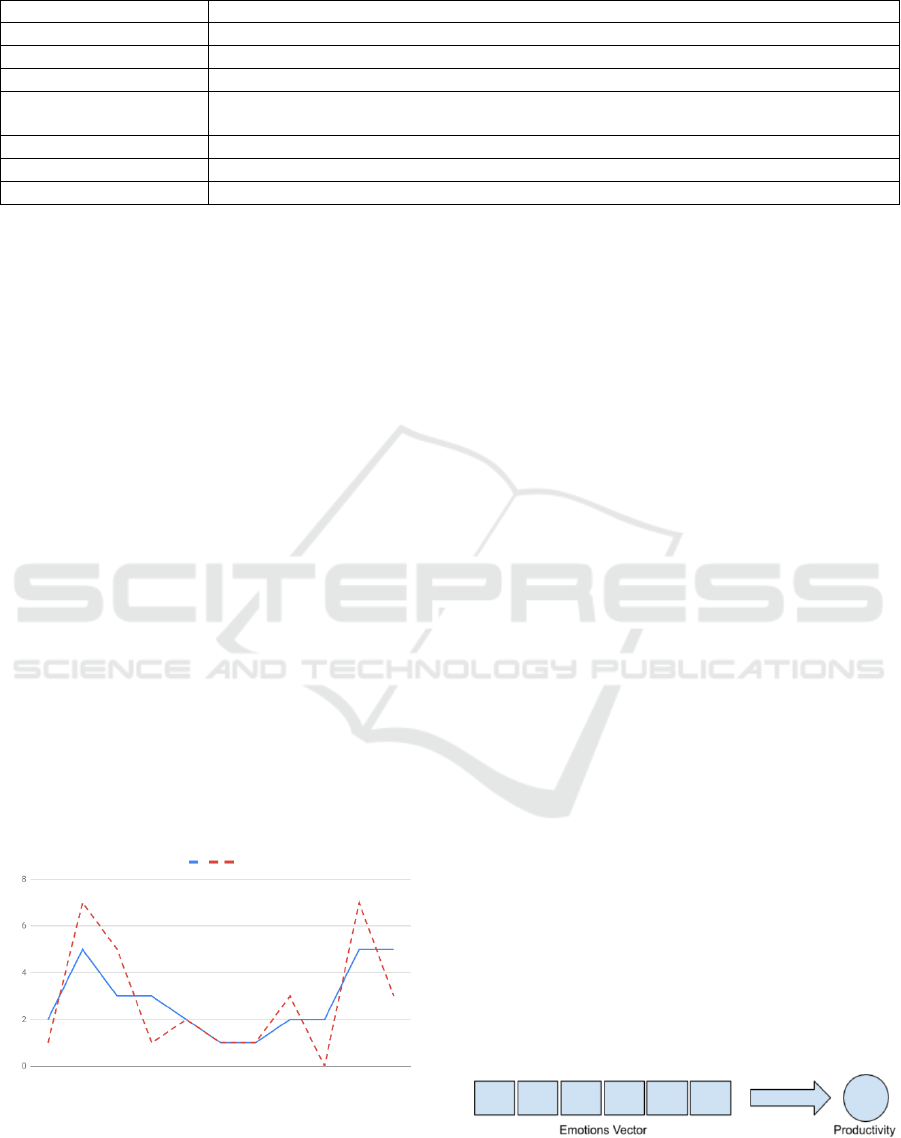
Table 1: Raw data collected.
Database Table
Data Stored
Keyboard
keystroke and timestamp
Mouse
mouse movement, click, click state, and timestamp
Active Window
window name and timestamp
Affectiva
9 emotions: [joy, fear, disgust, sadness, anger, surprise, contempt, valence, and engagement],
21 facial expressions, and timestamp
Self-assessment
productivity, valence, and arousal scores (refer to figure 2)
Lines of code changes
filename, number of lines added, number of lines removed, and total number of lines
CodeForces
verdict, number of test cases passed, time consumed, and memory consumed
4.3 Data Collected
Seven different kinds of data are collected during the
experiment. These are keystrokes, mouse activity,
active window, changes in lines of code, emotions
data from Affectiva’s API, self-assessment data, and
CodeForces verdicts on the solution submissions.
This data is stored in an SQLite database. Table 1
outlines the database tables and data collected.
5 ANALYSIS AND RESULTS
This section discusses how the raw data was
processed and the dataset was compiled. It then
discusses the experiments that were conducted, their
results, and provides analysis for the obtained results.
Of the 11 participants, 2 were females and 9 were
males. On a Likert scale of 1 to 5, the average
familiarity with ACM-style problems was 2.82. The
average number of submissions made by participants
was 9. The average number of correct submissions
was 2.82. Figure 3 shows the relationship between
familiarity with ACM problems and the number of
correct submissions made. It basically shows a direct
correlation between them.
Figure 3: ACM Familiarity (solid) and Correct Submissions
(dashed).
5.1 Dataset Preparation
Data was collected from 11 participants, each
providing 1 hour of continuous stream of data that
was mentioned in section 3.3. In its raw form, the data
is not ready for analysis and must therefore be
preprocessed. The first step is to identify a reasonable
time interval at which the data is going to aggregated.
This was chosen to be a 1-minute interval. Going
lower than 1-minute will make it difficult to obtain
meaningful data points because, intuitively, it is very
difficult to quantize developer productivity at
intervals lower than a minute.
The next step is to select the most relevant
variables to include in the analysis. These were the 9
emotions that are obtained through Affectiva,
keystrokes, lines of code changes, and submissions on
CodeForces. Mouse related activity was discarded
because it was observed that it introduces noise when
considering it with the other variables. Nonetheless,
this data was recorded because gathering it was not
difficult. Active window data was also not used;
however, it can be useful in future experiments as it
provides information relating to what the user is
working on at a certain point in time.
Given the variables, the input features are the
emotions vector, while the keystrokes, changes in
lines of code, and CodeForces submissions are used
to compute a single value that represents productivity.
The problem now becomes a matter of aggregating
the continuous stream of emotions during a minute
into a single data point and associating each data point
with a value of productivity. Figure 4 is an illustration
of a single data point.
It basically shows a direct correlation between
them.
Figure 4: A single data point. The input features are the
emotions, and the target is the productivity value.
Influence of Emotions on Software Developer Productivity
79

Focusing on the emotions vector, the aggregation
is performed by taking the mean over the whole
minute and using this value to represent the emotion
over the previous minute. This means that each data
point will have a vector of 9 means for the 9 emotions.
As for productivity, it is important to identify a
proper way of utilizing the information at hand to
come up with an appropriate metric to evaluate it.
While most existing metrics in the literature are
useful for evaluating productivity over months,
weeks, or days, they are not practical for evaluating
changes in productivity over a very short time span
such as a minute. The metric should also be suitable
to the domain of problem solving, since this was the
nature of the experiment.
The devised metric consists of 2 components:
effort and reward points. Effort represents work that
the developer performs to achieve his target, which is
solving the problem. Effort is evaluated using
keystrokes and changes in the number of semicolons
in the files. Semicolon changes were chosen as
opposed to simply changes in physical lines because
it is more indicative of productive code. Since number
of semicolon changes is more significant than the
number of keystrokes, it is given more weight in the
effort calculation. The weights assigned were 2/3 and
1/3 for the semicolon changes and keystrokes
respectively. These values were chosen through trial
and error. Equation 1 shows the calculation for effort,
where K is keystrokes and S is semicolons.
Effort = (1/3) * K + (2/3) * ΔS
(1)
Note that aggregation for keystrokes is done by
adding up the keystrokes that happen during the
minute. Similarly, semicolon changes are aggregated
by adding these changes during the minute. This
equation, however, cannot be applied directly
because the keystrokes and Δsemicolons are of
different scales. To account for this problem, the data
is normalized first.
As for the reward points, the way to gain them is
by correctly solving problems. Each problem solved
grants 100 points. As for submissions that were not
successful, the points earned are awarded according
to equation 2. PC stands for passed test cases while
TC stands for total test cases. For example, if a person
solves 3 problems successfully, and partially solves
another problem such that 10 out of 20 test cases pass,
he/she will be rewarded a total of 350 points.
Points = (PC / TC) * 100
(2)
The problem now becomes a matter of
distributing the earned points during the 1-hour
experiment time across the 1-minute interval points.
This is where effort and reward points are combined.
The process involves multiple steps. First, the
submissions are filtered by removing any
intermediate submissions that achieve an equal or
lower score than a previous submission for the same
problem. For example, given a certain problem, if the
first submission achieves 50% success, the second
achieves 30%, and the third achieves 100%, the
second submission is dropped as it doesn’t achieve
any improvements. Note that points are not double
counted in multiple submissions that belong to the
same problem, so only the percentage increase is
accounted for.
Next is the distribution process. The points earned
at each submission are distributed on the timeframe
that precedes it until the previous submission. Each
minute in this frame receives a portion of the points
earned that is directly proportional to the effort
exerted in this minute. This value basically represents
productivity for this minute. This is made clear in
figure 5.
Figure 5: S1, S2, and S3 are the submissions. T1, T2, and
T3 are the timeframes. Points earned in S1, S2, and S3 are
distributed on timeframes T1, T2, and T3 respectively.
After the previous processes, the data for each
person is sampled at 1-minute intervals and each data
point is represented by a vector of emotions as the
input features and a target value for productivity. For
each person, 10% of the points are taken into the test
set and 90% is used for the training set.
5.2 Experiments and Discussion
Two experiments were conducted and reported in this
paper. This section discusses the experiments and
their results and provides an analysis of the findings.
For both experiments, training is performed by
utilizing a random forest classifier. Class balancing
was also used to make sure that any variations in
frequency would be accounted for.
5.2.1 Experiment 1
For this experiment, the training set has 636 data
points, and the test set has 67 data points. Before
training, the productivity values were clustered into
20 classes (considering the maximum value is 100).
Upon training using the random forest classifier, the
results show an accuracy of 98.3% on the training set
PECCS 2019 - 9th International Conference on Pervasive and Embedded Computing and Communication Systems
80

and 70.2% on the test set. However, after taking a
closer look at the data, a problem was noticed. Most
of the data points had a productivity value of 0, and
this is since most participants were able to solve
around 2 problems only. The confusion matrix shows
that around 50% of the points in the test set belong to
the 0-productivity class, which were correctly
classified, hence the relatively high accuracy.
However, observing the other classes, they were few
in numbers and were wrongly classified as zeros. This
motivated the need to devise another experiment that
tackles the problems of the first one.
5.2.2 Experiment 2
For this experiment, one target was to lower the
number of data points that were oriented towards
zeros. To do this, data after the last submission that
was made for each participant was trimmed. This is
because any data points that come afterwards will
receive a productivity of zero according to the metric
used since the reward points will be zero. Doing so,
the size of the training set was 555 data points and the
test set had a size of 56 data points.
Since the dataset is small, 20 classes were too
much. To resolve this issue, 3 classes were used for
this part of the experiment. The cut off thresholds
were chosen to balance the number of data points
belonging to each class. Basically, the classes
represent low, medium, and high productivities. Upon
training, the results show an accuracy of 98.0% on the
training set and 55.4% on the test set. Despite it
achieving less than the previous experiment, the
confusion matrix in this scenario was more balanced,
and hence is less biased.
The accuracy is still considered low, given that a
random model would achieve a 33.3% accuracy. This
can be attributed to the fact that the dataset was small,
given that only 11 participants were available.
Another issue is also the low number of problems
solved, which was a primary factor that indicated
productivity according to the devised metric. Another
possibility could be that using the mean to aggregate
the emotions data is not the best way to get a
representative emotion vector at 1-minute intervals.
6 CONCLUSIONS
The influence of emotions on developer productivity
is an important relationship to investigate as it is not
fully understood in the existing literature. A few
studies were conducted that tackled this point.
Methods used include questionnaires, self-
assessment, text analysis, utilizing biometric sensors,
and inducing emotions. Each of these methods has its
own limitations. One possible direction is to capture
emotions from facial features, and this was utilized in
the experiments conducted in this paper. A metric was
designed to measure productivity over short intervals
of time which uses a measure for effort and reward
points. The first experiment achieved an accuracy of
70.2% on the test set, however, the model was biased
towards productivity values of zero because of their
dominance in the dataset. To account for this issue, a
second experiment was performed that adjusted the
dataset and balanced the classes. The second
experiment achieved an accuracy of 55.4% on the test
set. Despite this being better than a random model, it
still suffers from some problems. The dataset is small,
the number of successful submissions is low, and the
aggregation method used could possibly be changed.
This opens many possibilities for experimentation
that could be performed to achieve better results.
7 FUTURE WORK
One significant limitation in the experiments
performed was the fact that dataset size was limited.
An obvious improvement is to collect more data to
achieve better and more reliable results. This will also
help solve the issue of having low amount of data
points in the dataset that have high productivity
values. Another way to tackle this issue is also to
adjust the productivity metric such that reward points
aren’t only earned through submissions but may also
be attained through performing effort. Another option
is to experiment with different aggregation methods
for the emotions other than the mean which could
possibly lead to better results. Data panelling could
also be explored during data analysis. Some data was
also collected during the data collection phase but
were not used in the experiment such as mouse clicks
and movement, active window data, and self-
assessment data. These could be utilized in further
experiments to investigate their usefulness.
Hopefully, these could ultimately help to achieve a
better understanding of the influence of emotions on
the productivity of software developers.
REFERENCES
"Affectiva Windows APIs", Knowledge.affectiva.com,
2019. [Online]. Available: https://knowledge.
affectiva.com/docs/getting-started-with-the-emotion-
sdk-for-windows. [Accessed: 03- Apr- 2019].
Influence of Emotions on Software Developer Productivity
81

Barsade, S. and Gibson, D. (2007). Why Does Affect
Matter in Organizations?. Academy of Management
Perspectives, 21(1), pp.36-59.
Boehm, B. and Papaccio, P. (1988). Understanding and
controlling software costs. IEEE Transactions on
Software Engineering, 14(10), pp.1462-1477.
Borod, J. (2000). Neuropsychology of Emotion (Series in
affective science). Oxford University Press.
Deshmukh, R. and Jagtap, V. (2017). A survey: Software
API and database for emotion recognition. 2017
International Conference on Intelligent Computing and
Control Systems (ICICCS).
Ekman, P. (1993). Facial expression and emotion.
American Psychologist, 48(4), 384-392.
Fritz, T., Begel, A., Müller, S., Yigit-Elliott, S. and Züger,
M. (2014). Using psycho-physiological measures to
assess task difficulty in software development.
Proceedings of the 36th International Conference on
Software Engineering - ICSE 2014.
Garcia-Garcia, J., Penichet, V. and Lozano, M. (2017).
Emotion detection. Proceedings of the XVIII
International Conference on Human Computer
Interaction - Interacción '17.
Graziotin, D., Wang, X. and Abrahamsson, P. (2013). Are
Happy Developers More Productive?. Product-
Focused Software Process Improvement, pp.50-64.
Graziotin, D., Wang, X. and Abrahamsson, P. (2014a). Do
feelings matter? On the correlation of affects and the
self-assessed productivity in software engineering.
Journal of Software: Evolution and Process, 27(7),
pp.467-487.
Graziotin, D., Wang, X. and Abrahamsson, P. (2014b).
Happy software developers solve problems better:
psychological measurements in empirical software
engineering. PeerJ, 2, p.e289.
Graziotin, D., Wang, X. and Abrahamsson, P. (2015). How
do you feel, developer? An explanatory theory of the
impact of affects on programming performance. PeerJ
Computer Science, 1, p.e18.
Graziotin, D., Fagerholm, F., Wang, X. and Abrahamsson,
P. (2017). Consequences of unhappiness while
developing software. Proceedings of the 2nd
International Workshop on Emotion Awareness in
Software Engineering, [online] pp.42-47. Available at:
https://dl.acm.org/citation.cfm?id=3105568 [Accessed
13 Nov. 2018].
Graziotin, D., Fagerholm, F., Wang, X. and Abrahamsson,
P. (2018). What happens when software developers are
(un)happy. Journal of Systems and Software, 140,
pp.32-47.
Khan, I., Brinkman, W. and Hierons, R. (2010). Do moods
affect programmers’ debug performance?. Cognition,
Technology & Work, 13(4), pp.245-258.
Mäntylä, M., Adams, B., Destefanis, G., Graziotin, D. and
Ortu, M. (2016). Mining valence, arousal, and
dominance. Proceedings of the 13th International
Workshop on Mining Software Repositories - MSR '16.
McDuff, D., Mahmoud, A., Mavadati, M., Amr, M., Turcot,
J. and Kaliouby, R. (2016). AFFDEX SDK.
Proceedings of the 2016 CHI Conference Extended
Abstracts on Human Factors in Computing Systems -
CHI EA '16.
Muller, S. and Fritz, T. (2015). Stuck and Frustrated or in
Flow and Happy: Sensing Developers' Emotions and
Progress. 2015 IEEE/ACM 37th IEEE International
Conference on Software Engineering.
Müller, S. and Fritz, T. (2016). Using (bio)metrics to
predict code quality online. Proceedings of the 38th
International Conference on Software Engineering -
ICSE '16.
Murgia, A., Tourani, P., Adams, B. and Ortu, M. (2014).
Do developers feel emotions? an exploratory analysis
of emotions in software artifacts. Proceedings of the
11th Working Conference on Mining Software
Repositories - MSR 2014.
Oliveira E., Viana D., Cristo M. and Conte T. (2017). How
have Software Engineering Researchers been
Measuring Software Productivity? - A Systematic
Mapping Study.In Proceedings of the 19th
International Conference on Enterprise Information
Systems - Volume 2: ICEIS, ISBN 978-989-758-248-6,
pages 76-87.
Ortu, M., Adams, B., Destefanis, G., Tourani, P., Marchesi,
M. and Tonelli, R. (2015). Are Bullies More
Productive? Empirical Study of Affectiveness vs. Issue
Fixing Time. 2015 IEEE/ACM 12th Working
Conference on Mining Software Repositories.
Petersen, K. (2011). Measuring and predicting software
productivity: A systematic map and review.
Information and Software Technology, 53(4), pp.317-
343.
Poria, S., Cambria, E., Bajpai, R. and Hussain, A. (2017).
A review of affective computing: From unimodal
analysis to multimodal fusion. Information Fusion, 37,
pp.98-125.
"Problemset", Codeforces, 2019. [Online]. Available:
https://codeforces.com/problemset. [Accessed: 03-
Apr- 2019].
Sampaio, S., Barros, E., Aquino Junior, G., Silva, M. and
Meira, S. (2010). A Review of Productivity Factors and
Strategies on Software Development. 2010 Fifth
International Conference on Software Engineering
Advances.
Sinha, V., Lazar, A. and Sharif, B. (2016). Analyzing
developer sentiment in commit logs. Proceedings of the
13th International Workshop on Mining Software
Repositories - MSR '16.
Wrobel, M. (2013). Emotions in the software development
process. 2013 6th International Conference on Human
System Interactions (HSI).
Züger, M., Müller, S., Meyer, A. and Fritz, T. (2018).
Sensing Interruptibility in the Office. Proceedings of
the 2018 CHI Conference on Human Factors in
Computing Systems - CHI '18.
PECCS 2019 - 9th International Conference on Pervasive and Embedded Computing and Communication Systems
82
