
SmartMobility, an Application for Multiple Integrated Transportation
Services in a Smart City
Cristian Lai, Francesco Boi, Alberto Buschettu and Renato Caboni
CRS4, Center for Advanced Studies, Research and Development in Sardinia, Loc. Piscina Manna,
Edificio 1 09010 Pula (CA), Italy
Keywords: Internet of Things, Smart City, Transportation, Multimobility, MaaS.
Abstract:
In this paper, we present SmartMobility, an application for multimobility information services in a smart
city, exploiting an ecosystem of IoT devices. Such application, designed for a real case study, is extremely
heterogeneous in terms of IoT devices and implements a wide range of services for citizens. The application
aims at contributing to reducing traffic generated by private vehicles in the city besides helping drivers going
towards high traffic areas by presenting real-time mobility data from different sources. The experiments carried
out in this study have evaluated some behaviors of the application in front of different configurations, allowing
understanding how the experience varies under a wide number of devices and services, particularly in terms of
mobility alternatives offered to the final user. The research findings showed that the bus transportation service
is the most common one, while carsharing and bikesharing are not widespread and must be improved.
1 INTRODUCTION
In this paper, we present SmartMobility, an applica-
tion for multimobility information services in a smart
city, using an ecosystem of IoT devices. The applica-
tion aims at contributing to reducing traffic generated
by private vehicles in the city besides helping drivers
going towards high traffic areas by presenting real-
time mobility data from different sources.
In the recent years, the amount of connected
devices available in everyday life has significantly
grown (Hung, 2017) as crucial part of the Internet of
Things (IoT). In the IoT, the volume of devices can be
remarkable. The IoT accentuates the connectivity be-
tween physical devices and data and contributes to the
transportation systems to support the smart city vision
(Sherly and Somasundareswari, 2015). Smart cities
particularily are more and more enriched with sophis-
ticated services (Zanella et al., 2014), especially in
terms of citizens’ mobility. Multimobility combines
different modalities of transportation; private car, bus,
carsharing and bikesharing. The shift towards multi-
modal mobility is growing in popularity, especially
in urban centers with recurring problems associated
with congestion, parking, and an overall lack of space
(Shaheen et al., 2016). Driving a car is important
for people because it is the opportunity for autonomy
(Ellaway et al., 2003) (Steg, 2003). A driver going
from sparsely populated areas to a relatively big or
very big city may be motivated to park the private
car and use alternative transportation options. That is
why their main issues are related to finding a parking
slot, catching the bus on time, or choosing the suitable
alternative.
SmartMobility is a MaaS (Mobility as a Service)
application (Jittrapirom et al., 2017) (Karlsson et al.,
2016) that provides information integration. Despite
the conventional and business oriented MaaS plat-
forms, such as UbiGo (Sochor et al., 2016), Smart-
Mobility neither provides any booking or payment
services nor any travel planner functionality. To the
best of our knowledge, no application provides infor-
mation regarding parking areas occupancy. Of course,
drivers may be alerted regarding empty parking places
either by displays on street signs or by looking at
maps on the smartphone. Neverteless, SmartMobil-
ity focuses on parking areas providing firsthand in-
formation to drivers looking for a parking and wish-
ing to use an altenative tranportation option. In the
context of MaaS, the IoT acts as an enabler for the
integration of private and public transport (Giesecke
et al., 2016). Every single element of SmartMobil-
ity, i.e., parking area, bus stop, car or bike sharing
station, takes part in an extremely sophisticated net-
work of miscellaneous connected IoT devices, each
one with its own protocols, specifications, and char-
58
Lai, C., Boi, F., Buschettu, A. and Caboni, R.
SmartMobility, an Application for Multiple Integrated Transportation Services in a Smart City.
DOI: 10.5220/0008066600580067
In Proceedings of the 15th International Conference on Web Information Systems and Technologies (WEBIST 2019), pages 58-67
ISBN: 978-989-758-386-5
Copyright
c
2019 by SCITEPRESS – Science and Technology Publications, Lda. All rights reserved

acteristics. Consequently, there is a need to handle
such elements, consisting of both physical (commer-
cial instruments, custom sensor boards, etc.) and logi-
cal (other web platforms, open data services, etc.) de-
vices, independently. SmartMobility is built on top
of a microservice architecture specifically designed
for the IoT, such as a collection of independently de-
ployable and loosely coupled basic services. Each
microservice runs in its own process, communicates
with lightweight mechanisms, such as HTTP resource
API (Fowler and Lewis, 2014) (Newman, 2015) and
implements a certain feature. All the units compos-
ing the different mobility services may be considered
and managed together as a single huge component or
can be perceived as parts of a modular system that can
grow incrementally.
A real case study has been set up in the metropoli-
tan area of Cagliari. Drivers moving by private car
towards an area with high traffic volume, such as the
city centre, have the available information necessary
to elude high traffic intensity areas, avoiding time and
fuel wasting besides preventing an increase of traffic.
The experiments carried out in this study have
evaluated some behaviors of the application in front of
different configurations, allowing understanding how
the experience varies under a wide number of devices
and services, particularly in terms of mobility alter-
natives offered to the final user. The research findings
have shown that the bus transportation service is the
most common one, while carsharing and bikesharing
are not widespread and must be improved.
This paper is organized as follows. Section 2 re-
views state of the art MaaS. Section 3 details the
SmartMobility application. Section 4 explains a real
case study. Section 5 shows some experiments and re-
lated results. Finally, Section 6 provides conclusions
and future perspectives.
2 STATE OF THE ART
MaaS is an emerging transport model that conceives
mobility integrating different operators and service
providers, public and private, collective and individ-
ual services (such as trip planning, reservation, and
payments) through a single interface. The concept of
MaaS is still ambiguous because of multiple defini-
tions and several implementation schemes around the
world (Jittrapirom et al., 2017). The general concept
is a single interface of a service provider. In some
cases, users have the possibility to plan their journey
and book and pay the services that might be required
(Holmberg et al., 2016). Public transport is the most
common offered alternative. Bikesharing, carsharing
and taxi services are included in most of the cases
(Katzev, 2003). Sometimes, car rental, peer-to-peer
car rental, parking and permit to congestion charg-
ing zone are offered options. MaaS platforms are ac-
cessed mostly through smart phone apps, but rarely
via web alternatives. Most of the offered services
provide real-time information, trip planning, booking,
ticketing, and payment functionalities. Other useful
services are weather forecasting, travel history report,
invoicing, and synchronization with personal activity
calendar. Payment is usually pay-per-use, associated
with two types of tariffs; package, a monthly pay-
ment for various transport modes and fixed amount
of distance, time and destination points (e.g., SHIFT,
UbiGo), and pay-as-you-go, charged according to the
effective use of the service.
To the best of our knowledge only few MaaS plat-
forms rely on surrounded and free parking areas. Ow-
ing to their business-oriented nature, some of them in-
tegrate parking garages (e.g., SHIFT) or the payment
of parking areas through parking meters (e.g., My-
Cicero). Since all MaaS applications encourage the
use of public transport services and provide alterna-
tives to private car use (Sloman et al., 2003) (Fujii and
Taniguchi, 2005), the parking search functionality can
not be neglected. That is why we have focused on free
parking areas providing drivers firsthand information
for parking the private car.
3 SmartMobility
SmartMobility is made up of the following macro
components:
• User Interface (UI): the front-end component;
• CMC-IoT: an architectural infrastructure that al-
lows managing heterogeneous devices besides
collecting data from them (section 3.2);
• data sources: any piece of hardware or software
producing relevant data. They are not embedded
in the architecture, but they belong to the specific
smart-city case study (section 4.2) and vary ac-
cording to the available resources.
3.1 User Interface
The UI shows a map containing the geographical lo-
cation of the devices (bus stops, parking lots, traffic
sensors, bike docks, and carsharing parking) compos-
ing the different mobility services. Graphic elements
of the same kind are grouped together. The user se-
lects the services wherein he or she is interested in
from a drop-down menu (Fig. 1).
SmartMobility, an Application for Multiple Integrated Transportation Services in a Smart City
59
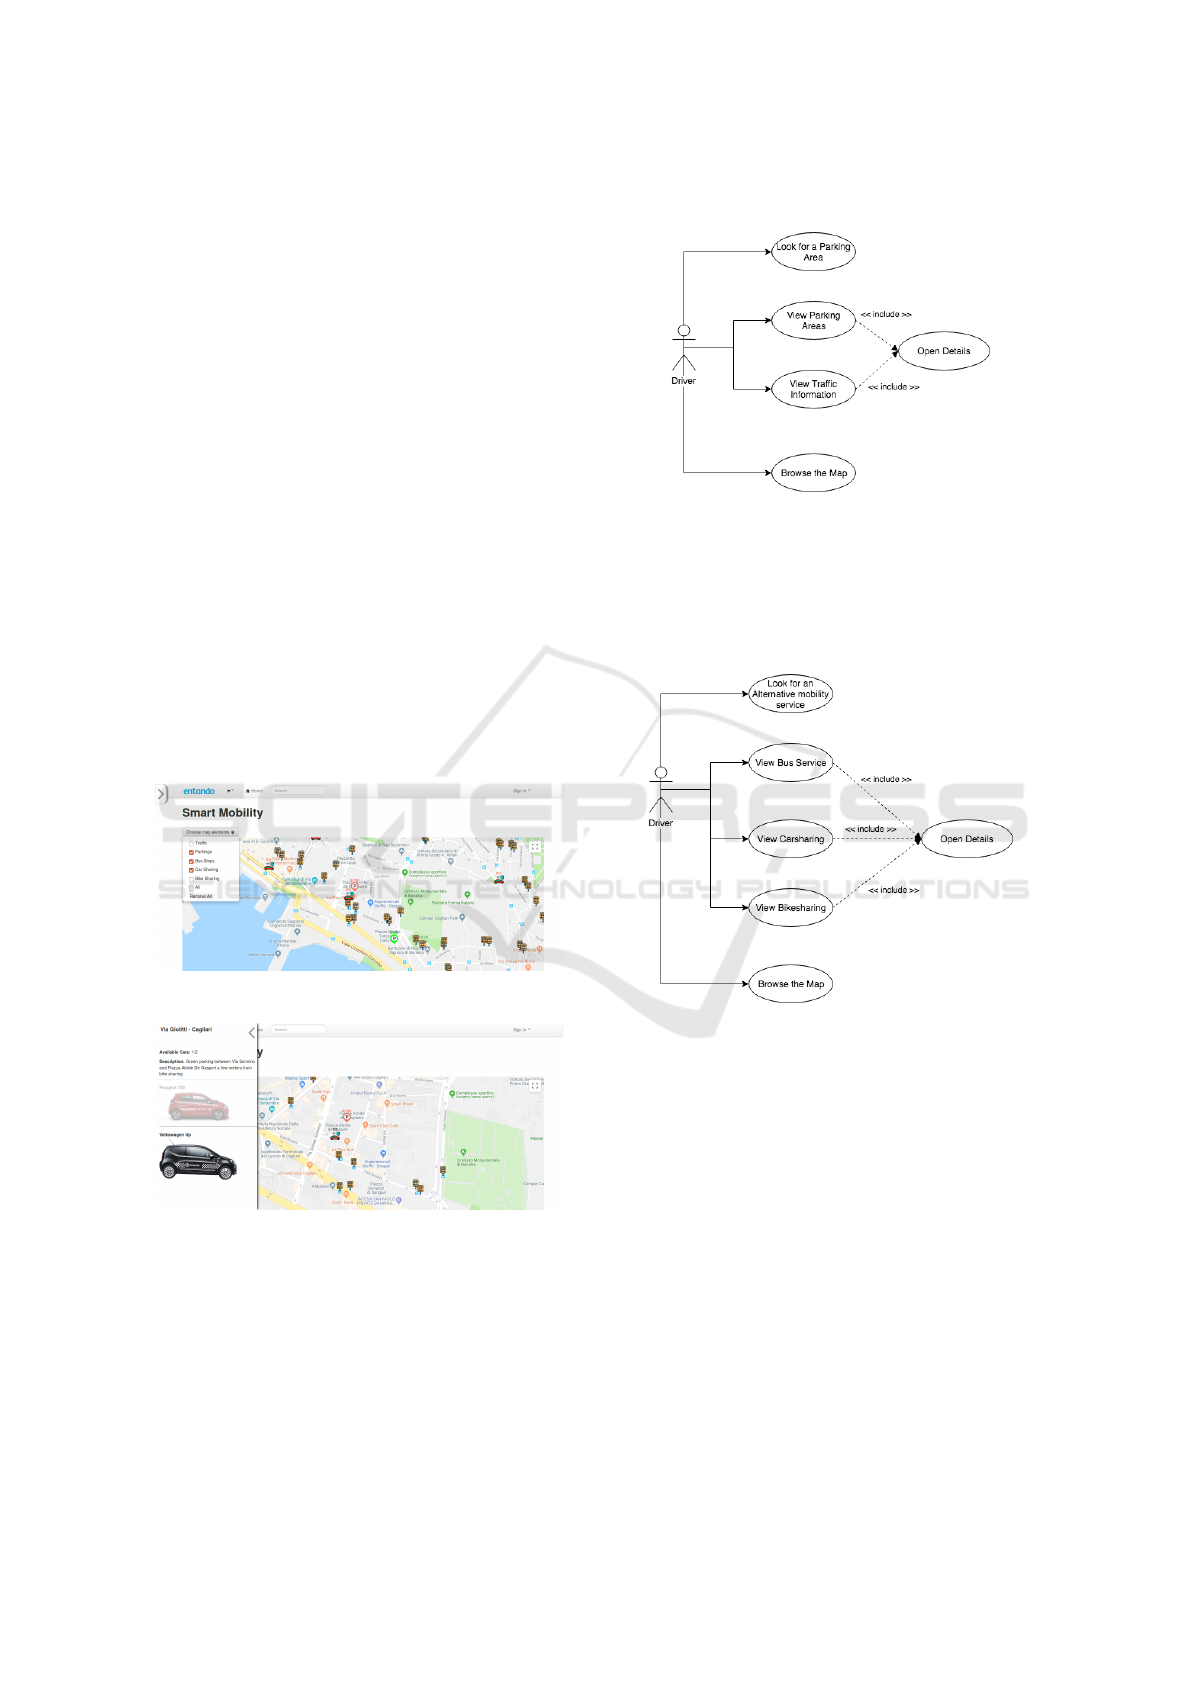
On the map, relevant elements are shown follow-
ing a layered approach, and each item presents ad-
ditional information. For example, while selecting a
parking lot, not only the overall parking capacity and
current availability, but also further information re-
lated to the other mobility services in the area close
to it are shown in real-time. Bus stop selection pro-
vides the available lines, the timeschedules, and ser-
vice reliability information. Clicking on a carsharing
or bikesharing station displays the number of avail-
able vehicles. Fig. 2 shows an example of the car-
sharing. When the user drags the map, only the ele-
ments around its new center are displayed. The UI
is developed using the enterprise open source soft-
ware Entando (Entando, 2019). Entando is an open
source Digital Experience Platform (DXP) for verti-
cal portals. The namesake enterprise is also the part-
ner of CRS4 in the project that partially supported
this work. Extensions available in the platform have
been exploited to create the software plugin modules
needed for the integration with CMC-IoT and for the
web portal development. The web portal is updated
in real-time when new data are available on CMC-
IoT. The result is a pleasant visualization of smart city
data on the graphical interface.
Figure 1: Available services in SmartMobility.
Figure 2: Additional information, carsharing.
3.1.1 Design
During the design, we considered two main use cases,
both involving the driver as actor.
In the first use case (Fig. 3) the driver browses
on the map the parking areas to check their real-time
availabilities as well as detailed information concern-
ing the current traffic flow in order to help him in the
choice of less busy roads.
Figure 3: Use case diagram: parking areas.
The second use case (Fig. 4) considers interac-
tions with the application to gather information about
the alternative mobility services available to the driver
in the surrounding area as soon as the own car has
been parked.
Figure 4: Use case diagram: other mobility services.
The graphical interface has been designed starting
from the mock-up depicted in Fig. 5. The main func-
tionality is provided by a map where the geolocated
resources are represented by dedicated icons (e.g., P
for parking areas). Different services can be shown
as well as hidden independently thanks to the adopted
modularity approach. The available services are up-
dated immediately with different colors and numeri-
cal values according to the services status. A side-
bar shared among all the services appears and disap-
pears providing detailed information as soon as the
user clicks on the map.
3.2 CMC-IoT
The microservice architecture developed for this
project, namely CMC-IoT, is able to integrate a vari-
WEBIST 2019 - 15th International Conference on Web Information Systems and Technologies
60
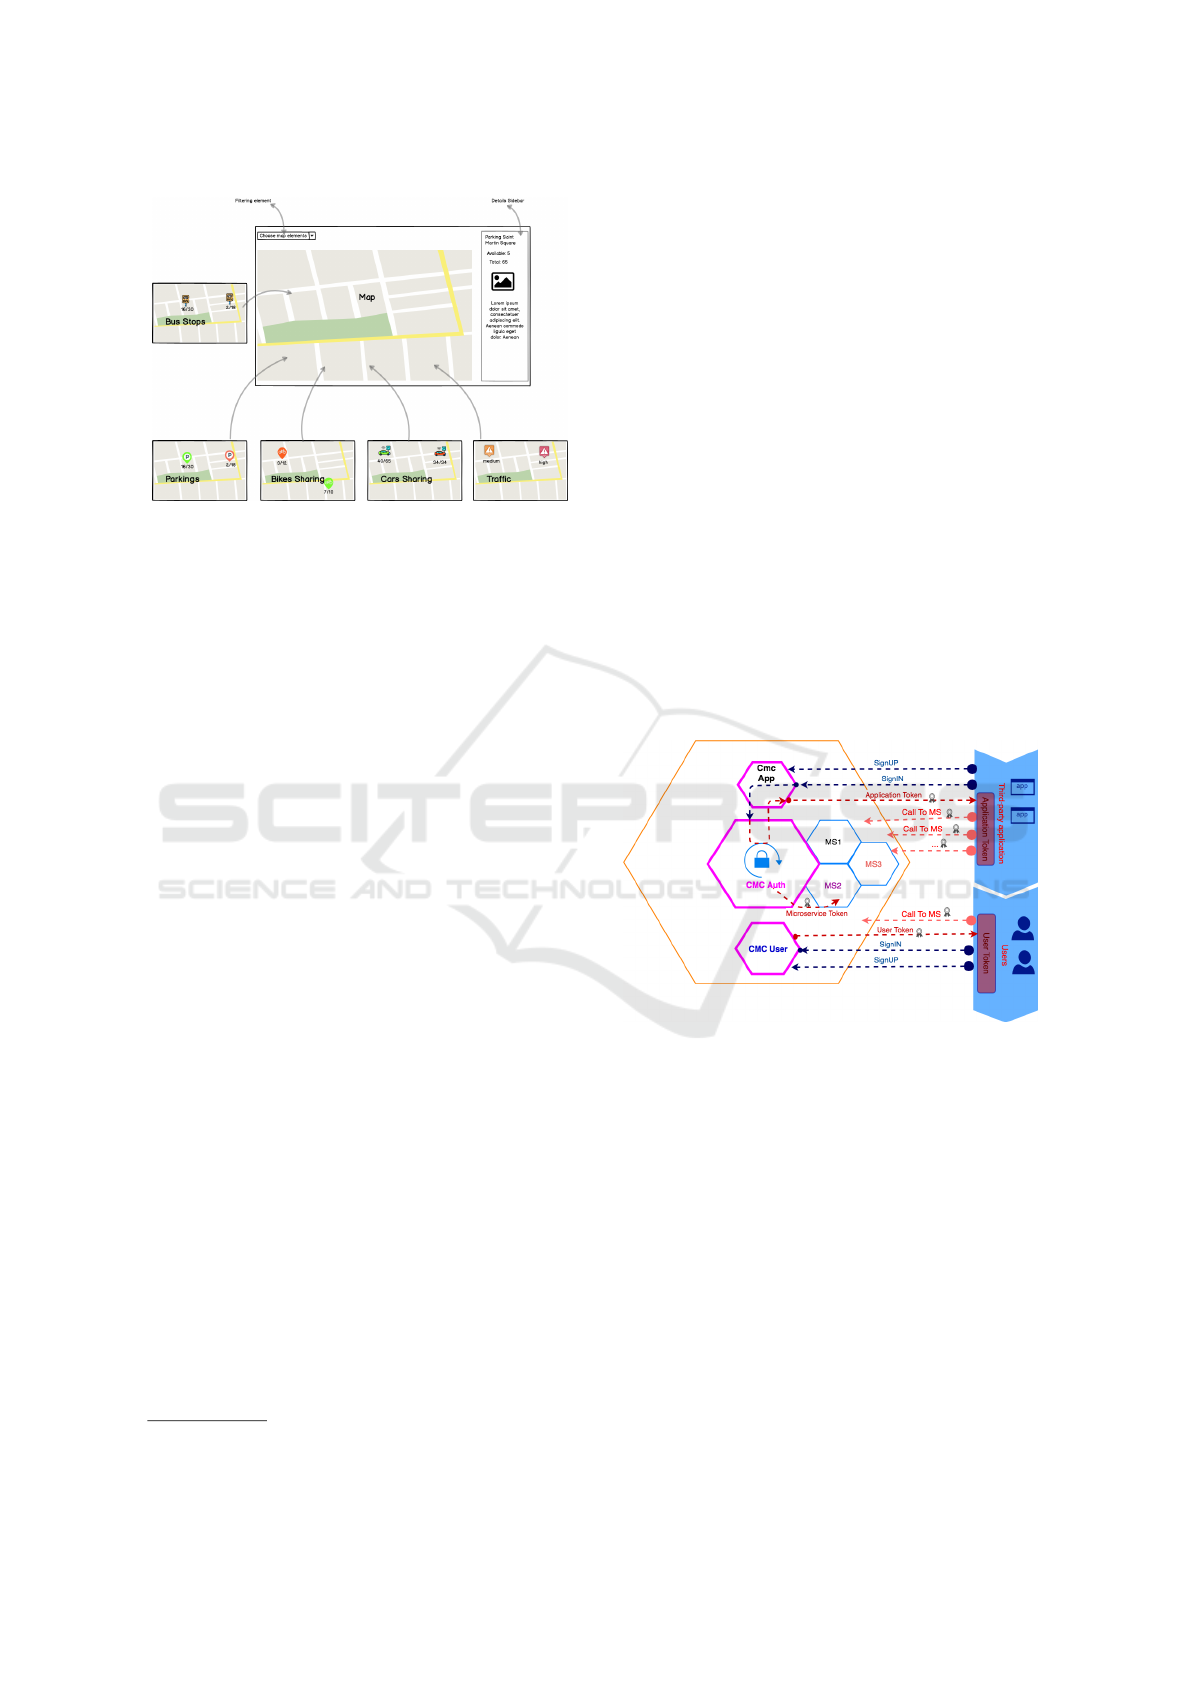
Figure 5: SmartMobility mock-up design.
ety of IoT devices and services. In the context of mo-
bility in a smart city, a service supplies the need of a
citizen that has to move from one part of the city to an-
other or provides useful information for the same pur-
pose. Typical examples are public transportation sys-
tems, sharing services, and traffic and parking mon-
itoring systems. These services are composed by
smaller entities, referred to as devices, which provide
only a part of the service functionality and have a spe-
cific location in the city. Examples of the latter are bus
stops, parking areas, and sharing stations.
CMC-IoT provides independently deployable and
loosely coupled basic services.. CMC-IoT is a fork
of and extends CMC (CRS4 Microservice Core)
1
, our
first open source project implementing a general pur-
pose microservice architecture.
3.2.1 CMC
The first set of microservices that has been designed
and developed offers token authorization functional-
ity to access protected microservices endpoints. Ac-
cording to the type of actor (another microservice,
a user, or an external application), different permis-
sions are granted. These components implement fea-
tures common to many applications, not specific for
the IoT, that can be reused in other projects as well.
The microservices composing CMC are the fol-
lowing:
• CMC Auth is a token generator that protects
microservices from unauthorized access using a
token-based authentication technique. Cmc Auth
generates different types of tokens enabling ac-
cess to specific endpoints of a protected microser-
vice. The three types of tokens that can be gener-
ated are:
1
https://github.com/smartenv-crs4
– Microservice Token, to access any resource
made available by microservices and to al-
low communication and data exchange among
them;
– User Token, to access resources for user-related
services;
– Application Token, to access resources from
general purpose third-party applications.
• CMC App manages resources and applications
sign-up and the subsequent sign-in phase. When
resources or applications sign-in, Cmc App asks
for an Application Token to Cmc Auth. Cmc
App releases the token to the applicant that con-
sequently can access any protected microservice
(see Fig. 6). Moreover, CMC Auth manages any
authorization rule to access a specific microser-
vice.
• CMC User manages user access to protected mi-
croservices. Users can sign-in with credentials to
obtain a user token. This token can be used only
by the owner of specific resources related to the
protected microservices.
Figure 6: A typical use case of CMC.
Fig. 6 shows an example of the authorization pro-
cedure. Microservices MS1, MS2 and MS3 grant ac-
cess to a third-party application. The application is
authorized to call these microservices through an Ap-
plication Token. When the token expires, the applica-
tion or user must sign-in again. The same procedure is
used to authenticate and authorize user access to one
or more microservices.
CMC offers only the presented basic function-
alities, but it can be easily extended with new fea-
tures using the available plugins. With this approach,
CMC-IoT has been developed, starting from the ar-
chitecture of CMC, to have a complete system more
suitable for IoT and smart city applications.
SmartMobility, an Application for Multiple Integrated Transportation Services in a Smart City
61
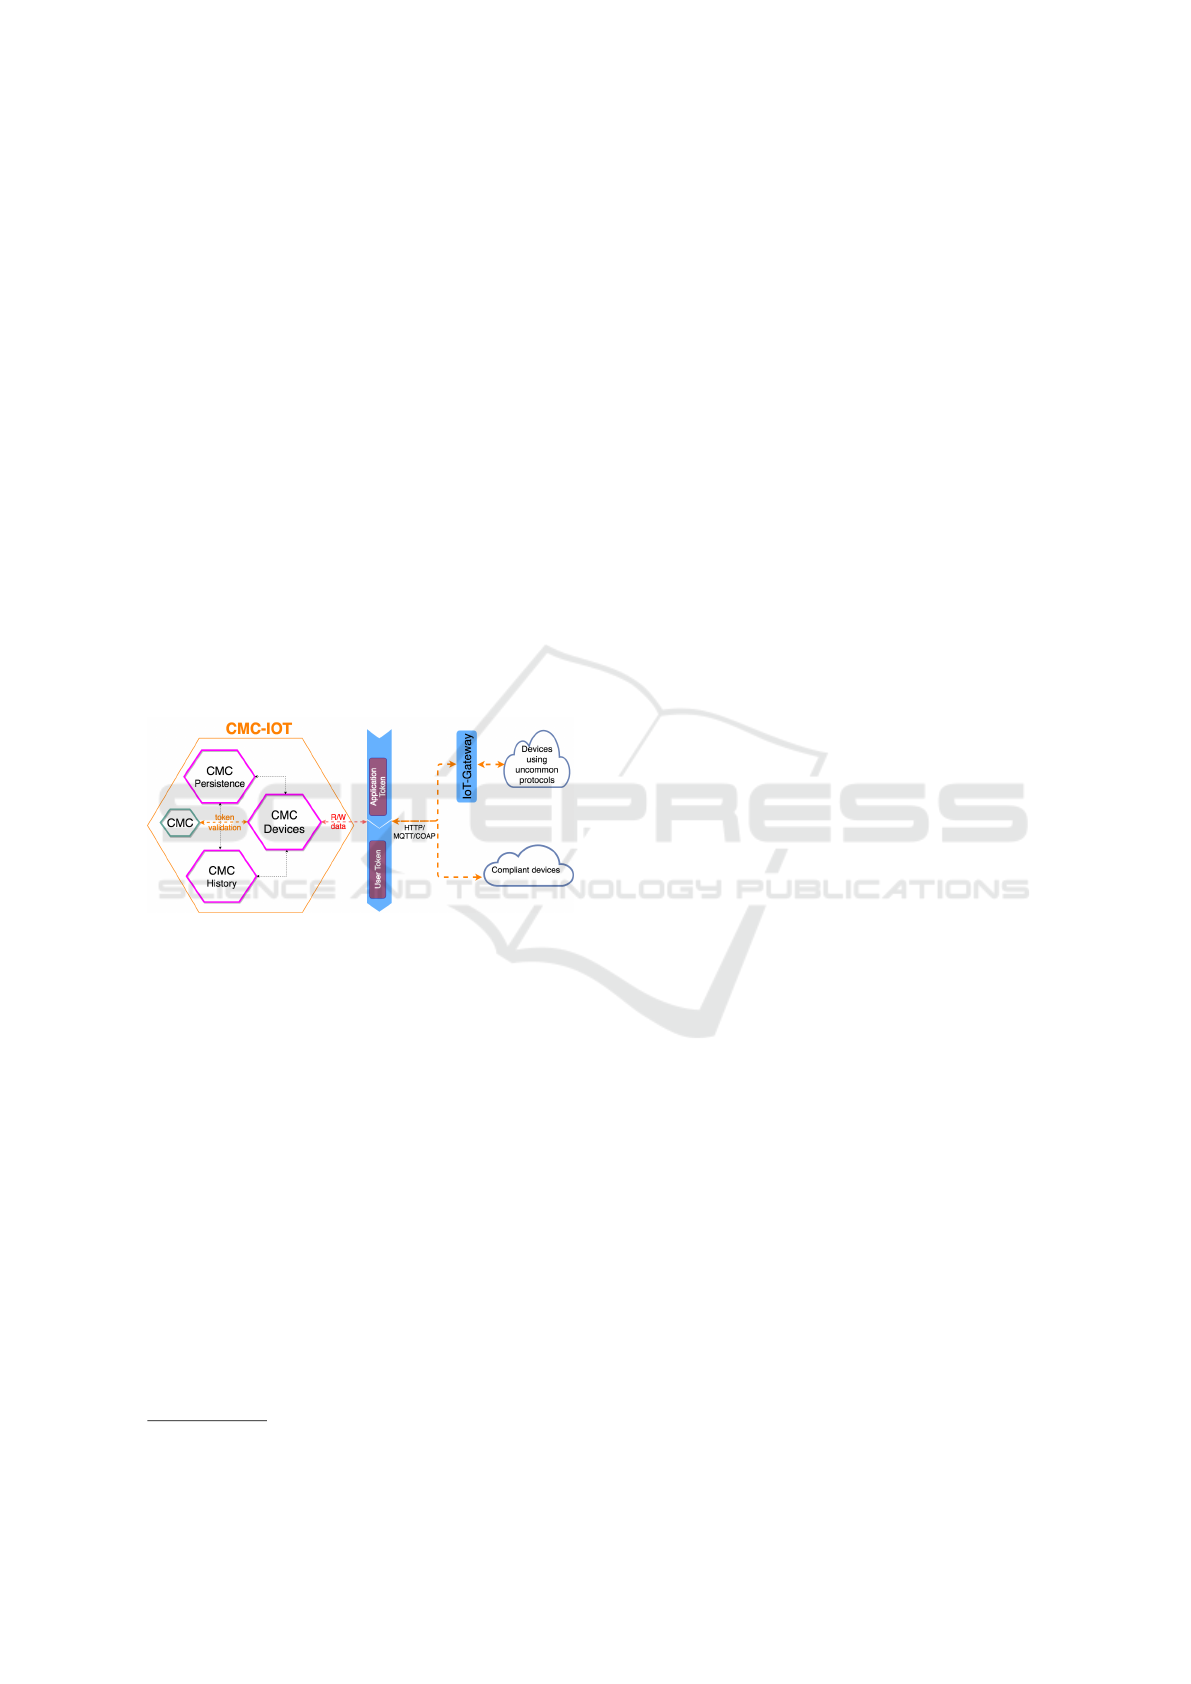
3.2.2 CMC-IoT
CMC-Iot is compound of the following additional mi-
croservices specific for the IoT:
• CMC Devices manages the device functionalities
providing the REST CRUD (Create, Read, Up-
date, Delete) operations. Each device must have
a unique ID to be unambiguously identified (for
example, the mac-address), a category, and a con-
nector. Optionally, its geolocation and a nickname
can also be specified. Devices can read from and
write to Cmc Device using a REST API.
• CMC History stores and retrieves historical data
produced by devices. Moreover, it allows to filter
and search data by device ID, time, device cate-
gory, and type of connector etc. In case of device
failure, last available data can be recovered.
• CMC Persistence is a scheduler for general pur-
pose devices that do not directly provide their data
to CMC-IoT. It performs data reading using Cmc
Devices and data saving through Cmc History.
Figure 7: CMC IoT.
A device communicates with CMC-IoT through
CMC Devices. Once a token has been released, de-
vice data can be sent or read. Cmc Devices uses
the core features of CMC to validate tokens and au-
thorize queries on registered devices. Fig. 7 shows
how devices communicate with CMC-IoT. On the one
hand, direct communication by the devices compli-
ant to the most common protocols such as HTTP,
MQTT
2
, COAP (Constrained Application Protocol)
(Thangavel et al., 2014), and others are directly sup-
ported by Cmc Devices. On the other hand, a con-
nector implements the functions of an IoT-Gateway,
such as protocol translation, when uncommon pro-
tocols are used, and data aggregation when a set of
physical sensors produces complementary data that
must be merged together to obtain complete informa-
tion.
2
http://mqtt.org
4 CASE STUDY
We have considered a real case study in the city of
Cagliari, located in the Sardinia island, Italy.
4.1 Scenario
Before entering the city centre the driver, using
SmartMobility, can check available free parking spots
in the monitored parking areas that are close to his
destination. In this way he or she does not have to
drive around the city looking for a free parking spot.
Once a parking lot has been identified and chosen,
the user can plan the fastest path to reach it according
to real-time traffic information in the main city roads
shown on SmartMobility. The driver can again check
on the application the availability of mobility services
around the parking area, such as bus stops and shar-
ing services, and their reliability so that he or she can
choose the one most suitable for his or her needs or
walk to the final destination.
4.2 Data Sources
SmartMobility collects data from different sources:
• real-time traffic information: the municipality of
Cagliari has created an infrastructure of inductive-
loop traffic detectors (commonly referred to as
traffic sensors) that can sense vehicles passing by.
These sensors are installed at the main roads con-
necting the suburbs to the city center. Data re-
turned by REST APIs contain the flow of vehicles
per unit of time and the average speed. This infor-
mation is used to estimate traffic flow at the time
the user is supposed to pass so as to have the nec-
essary information to elude high traffic zones;
• parking space vacancy detection system: it is an
automatic system installed at open-access parking
lots. Our system uses cameras and image process-
ing algorithms for detecting vacant and occupied
parking spaces. SmartMobility is constantly up-
dated regarding parking availability so that users
can directly drive to the area closest to their desti-
nation where they will most likely find a free park-
ing spot, avoiding, in this way, time and fuel wast-
ing, and reducing traffic congestion;
• public transport information: most of the public
transport companies in Cagliari and its extended
area have offered data of their bus services for this
project. Bus service information includes avail-
able bus lines, bus stops, the timeschedule and the
reliability of each line;
WEBIST 2019 - 15th International Conference on Web Information Systems and Technologies
62

• carsharing: a private company offers the fast-
growing carsharing service in the city of Cagliari.
They provide their service data through web ser-
vices. Available information includes the current
status of each carsharing parking area (number
and models of the available cars, booked reserva-
tions etc.);
• bikesharing: data, available through web services,
include the geographical position of each dock
and the number of available bikes in it.
Each data type has its own format and procedure
for being retrieved. To communicate with such het-
erogeneous data sources, CMC Devices uses differ-
ent types of connectors, one for each kind. A single
CMC Devices instance manages many devices in or-
der to avoid computational overhead. CMC Persis-
tence periodically retrieves carsharing and bikeshar-
ing data from the proper endpoints, while CMC His-
tory stores last month traffic data to predict the cur-
rent traffic flow. In our architecture, the microservices
are deployed in Docker containers
3
that provide the
needed flexibility and keep the overhead sufficiently
low as compared to traditional virtual machine solu-
tions.
5 EVALUATION
We carried out some experiments aiming at evaluating
some behaviors of the application to understand how
the experience varies in terms of mobility alternatives
offered to the end user. SmartMobility is an applica-
tion in a preliminary phase; in our opinion, not ready
for real users testing. Nevertheless, its evolution re-
quires these evaluations to tune the design and devel-
opment. For example, particular effort is required to
find a proper value for the searching radius. Assum-
ing that the user chooses a parking area, these tests
aim at finding out for each service the best searching
radius to find a decent number of results without sat-
urating the map shown on the user interface. That is
why tests were automated defining a proper algorithm
to best follow user’s behavior. Given a parking area,
tests have been defined and performed to:
• study the proper way to show the alternative mo-
bility services around it;
• find out the distribution of mobility services
around it.
We have identified a pattern of actions (runs) the
user is supposed to perform on the user interface ac-
3
https://www.docker.com
cording to the scenario (section 4.1). Such pattern is
composed of two steps:
1. Identify a parking lot.
2. Find the bus stops, carsharing, and bikesharing
stations around the identified parking lot.
5.1 Test Configuration
Tests have been configured according to the pattern
that has been translated into the Algorithm 1. Tests
consider a single working day starting from the be-
ginning to the midnight. The day has been split in
24 timeslots of one hour each. Runs vary according
to a predefined set of searching radius (expressed in
meters).
radius =
[50, 100, 150, 200, 250, 300, 350, 400, 450]
for (var r in radius) do
for p ← P do
l
bus
← get the bus stops around p
within r;
l
carsharing
← get the carsharing areas
around p within r;
l
bikesharing
← get the bikesharing areas
around p within r;
for h ← H do
count bus lines in l
bus
available
within the timeslot h;
count cars in l
carsharing
available at
the beginning of the timeslot h;
count bikes in l
bikesharing
available
at the beginning of the timeslot
h;
end
end
end
Algorithm 1: Algorithm near human behavior interac-
tion with SmartMobility. r is the searching radius, p
is a parking area among the mapped ones, and h is a
timeslot.
For each parking lot and timeslot, the algorithm
detects all the other mobility services around it and
within a maximum distance. This allows to under-
stand what are the possible options presented to the
user after he parked the car. The presented options
depend on the value of the searching radius: the larger
the radius, the more likely it is to find a device of that
type around the given geographical point, and conse-
quently the larger the number of options presented by
SmartMobility to the end user.
For all the tests, the numbers of parking areas (and
their location) and timeslots are the same:
SmartMobility, an Application for Multiple Integrated Transportation Services in a Smart City
63

• 76 parking areas;
• 24 time slots.
We have performed 9 rounds of tests, each one con-
sisting of a number of runs equivalent to the number
of mapped parking areas times the number of times-
lots.
Within the same round, the searching radius is
kept constant. In the next round, it is incremented
by 50. So, starting from 50 meters and incrementing
by 50 for 9 times, we get a maximum distance from
the parking area of 450m.
5.2 Measures
Definition 5.1. (Mobility Service) A mobility ser-
vice is a bus stop, or a carsharing station, or a bike-
sharing station.
Definition 5.2. (Mobility Element) A mobility el-
ement is a bus line, or a car (carsharing), or a bike
(bikesharing).
During these experiments, we have performed
some measures to answer the following questions:
Q1: How many mobility services are there around a
parking area (for each different radius)?
Q2: How many mobility elements are there around
a parking area (for each different radius)?
Q3: How many mobility elements are there around a
parking area during 24 hours (at different times-
lots, with a fixed radius)?
5.3 Results
For each monitored parking area we have plot three
bar charts visualising the results obtained from the de-
scribed analysis in order to answer the three questions
of 5.2.
For the first two questions, radius varies from 50
to 450 meters. In particular, the first graph (e.g., the
top graph in Fig. 8) shows the number of mobility
services, while the second (e.g., the bottom graph in
Fig. 8) shows the maximum number of mobility ele-
ments defined for each considered mobility service as
follows:
• for the bus service, it is the sum of the available
lines of each bus stop;
• for the carsharing, it is the sum of the capacities of
the carsharing parking areas that have been found;
• for the bikesharing, it is the sum of the capacities
of the bikesharing docks that have been found.
For example, if 2 bus stops are found, each one
having 3 lines, the maximum availability for the bus
service is 6. If 2 carsharing areas are found, each
with 2 parking slots, then the maximum carsharing
availability is 4, and the same holds for the bikeshar-
ing. For the bust stops, we have considered just the
number of lines, discarding the fact that the same line
might also appear in another nearby bus stop.
The third graph (e.g., Fig. 9) shows how the
number of mobility elements evolves during the 24
one-hour-long timeslots for a reasonable value of the
searching radius chosen according to the previous
analysis. In this case, the number of mobility elements
is measured for each service as follows:
• for the public bus transportation system, it is the
sum of the lines available in that timeslot;
• for the carsharing service, it is the sum of the
available cars at the beginning of each hour of the
carsharing parking areas that have been found;
• for the bikesharing, service it is the sum of the
available bikes at the beginning of each hour of
the bikesharing docks that have been found.
Examples of the three graphs are shown in Fig. 8
and Fig. 9. In the latter figure, for visualization pur-
poses, only the timeslots from 6 a.m. are shown. Dif-
ferent colors correspond to different services: blue for
the bus service, green for carsharing, and red for bike-
sharing, while in black are the values averaged over
all the parking areas considered in this study. Being
the bus service more numerous, the corresponding bar
height has been scaled by 5 for a better visualization.
In Fig. 8, we see that for small values of the ra-
dius, almost no mobility service is found. On the av-
erage, as expected, the bus transportation service is
the most common one. Note that even for a value of
the searching radius of 450m, on the average, no bike-
sharing dock is found, and only one carsharing area is
found. These values tell us that these services are not
widespread and must be improved.
During the day, the number of lines is almost con-
stant during the peak hours, while it decreases in the
early morning and late evening. During the night,
only few lines are available. The number of available
mobility elements of the carsharing and bikesharing
remains constant: it means that in Cagliari, citizens
still prefer to use the private car.
Fig. 8 and Fig. 9 have shown the case of a well-
connected parking-area with values above the aver-
age. For other parking areas, no service is found even
within a searching radius of 450m. An example is
shown in Fig. 10 presenting the mobility services and
devices of the parking area close to the stadium. This
WEBIST 2019 - 15th International Conference on Web Information Systems and Technologies
64
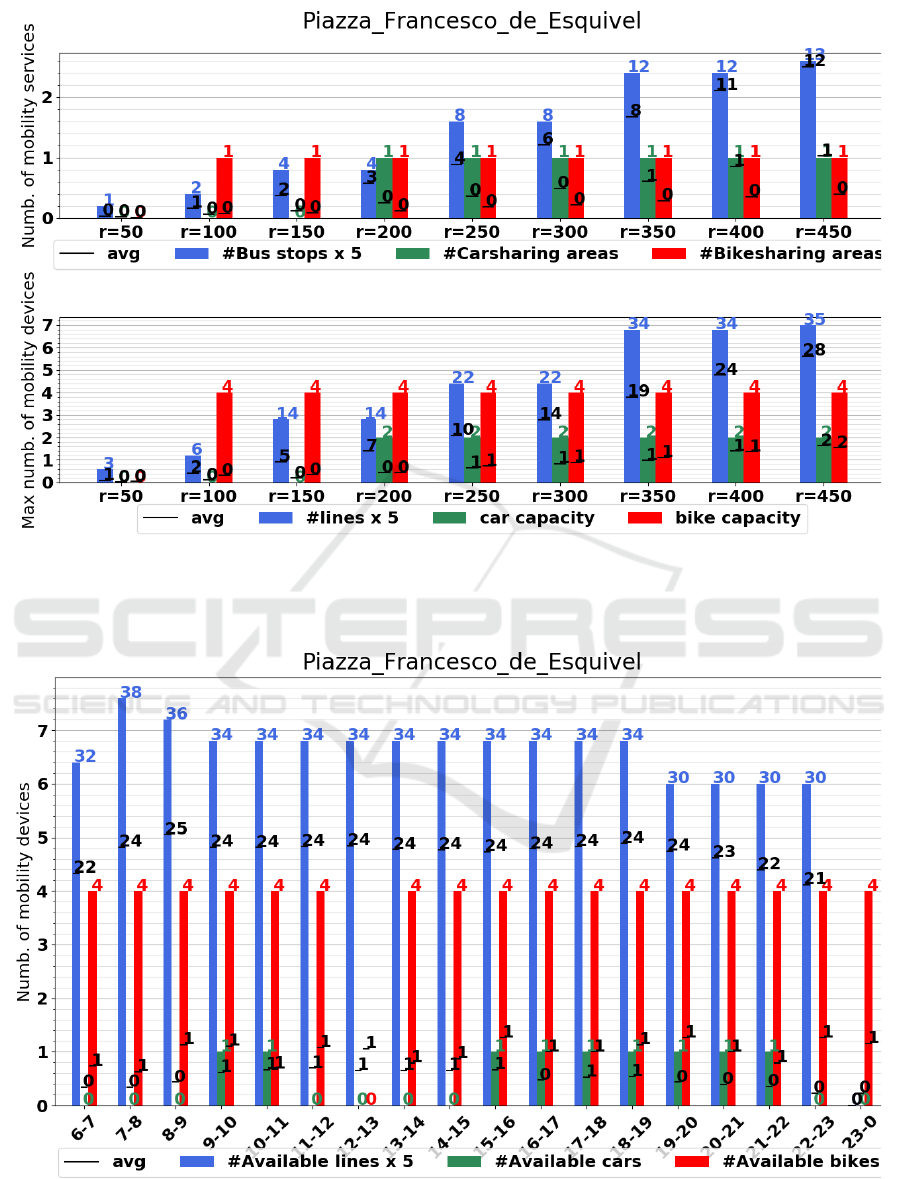
Figure 8: Mobility alternatives around a parking area for different values of the searching radius. The abscissa indicates
different values of the radius. In the graph above, on the ordinate, the numbers of bus stops (in blue), of carsharing areas (in
green) and of bikesharing dock (in red) found for different values of the searching radius. In the graph below, on the ordinate,
the maximum mobility availability of the parking area is shown. In black, the average values.
Figure 9: Mobility alternatives around a parking area for different timeslots, for a fixed value of 400m of the searching radius.
The abscissa indicates different timeslots of a day, while on the ordinate, the mobility availability of bus stops (in blue), of
carsharing areas (in green) and of bikesharing dock (in red) from the parking area found for different timeslots (taken at the
beginning of each hour). In black, the average values.
SmartMobility, an Application for Multiple Integrated Transportation Services in a Smart City
65
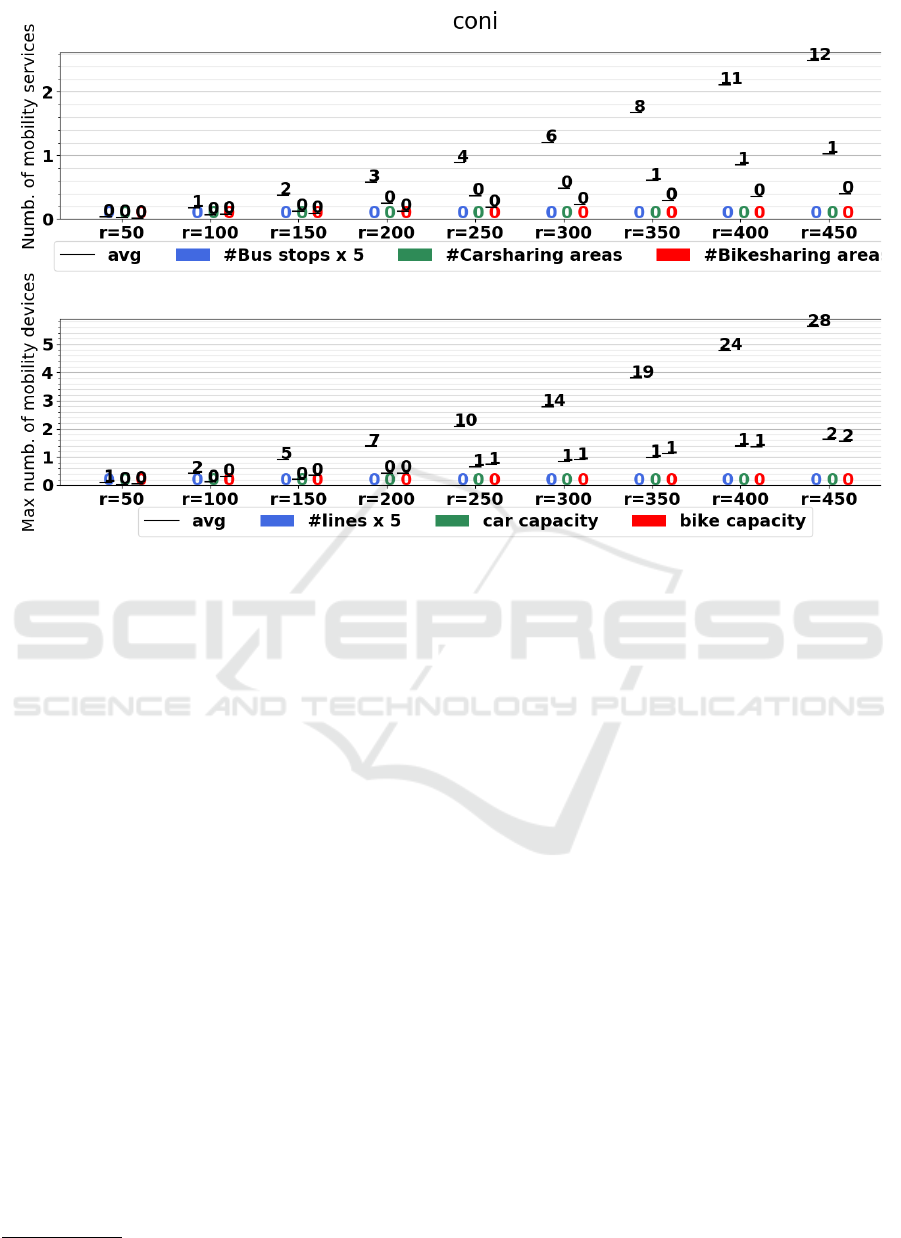
Figure 10: No mobility offers are found for the parking area close to the stadium.
is a significant example of how even areas dedicated
to host important city events are not connected.
The complete graphs of the mapped parking areas
are shown in
4
.
6 CONCLUSIONS
In this paper, we have presented SmartMobility, a
MaaS accessible as a web application which provides
information integration. The application collects a
wide range of services for citizens mobility in a smart
city. It is based on a scalable microservice architec-
ture, so as to manage an increasing amount of ser-
vices. The potential of such architecture allows to
design modular systems that can grow incrementally
without continuous redesign, development, and de-
ployment of the entire application. The system is di-
vided into small and lightweight services, purposely
built to perform a very cohesive business function.
Every single element, i.e., a parking area, a bus stop,
a car or bike sharing station, could be added as well as
removed independently, while the system can be fur-
ther enriched with new services. Both these actions
can be performed by modifying only the directly in-
terested modules without affecting the others.
4
https://smart-mobility.github.io
The study has allowed evaluating different con-
figurations of services designed for drivers going to-
wards high traffic areas and presenting in a clear way
and on the same platform real-time mobility data from
different sources. The experiments have allowed to
study some behaviors of the application in order to
understand how the experience varies in terms of mo-
bility alternatives offered to the end user. The re-
search findings have shown that the bus transporta-
tion service is the most common one, while carshar-
ing and bikesharing are not widespread and must be
improved. In other cases, no service is found even
within a searching radius of 450m from the parking
areas. This is to conclude that in our case study, 450m
is not always sufficient for finding all alternative ser-
vices.
As a follow up, SmartMobility will be redesigned
both for desktop and mobile. We have to take into
account the results of the experiments, designing the
user interface according to the suitable searching ra-
dius for each mobility service and possibly for each
timeslot and parking area. An algorithm for path plan-
ning will be studied and implemented in order to sug-
gest the user the best combination of mobility services
and streets to reach the target destination in the short-
est possible time. End user tests will be defined and
performed according to the results obtained from this
work.
WEBIST 2019 - 15th International Conference on Web Information Systems and Technologies
66

ACKNOWLEDGEMENTS
This work has been partially supported under the
PON04a2 00381 Cagliari 2020 and the ERDF (Eu-
ropean Regional Development Fund), PO Sardegna
FESR 2007-2013, PIA 2013 (project: n.295).
REFERENCES
Ellaway, A., Macintyre, S., Hiscock, R., and Kearns, A.
(2003). In the driving seat: psychosocial benefits
from private motor vehicle transport compared to pub-
lic transport. Transportation Research Part F: Traffic
Psychology and Behaviour, 6(3):217 – 231.
Fowler, M. and Lewis, J. (2014). Microservices.
Fujii, S. and Taniguchi, A. (2005). Reducing family caruse
by providing travel advice or requesting behavioral
plans: An experimental analysis of travel feedback
programs. Transportation Research Part D: Transport
and Environment, 10(5):385–393.
Giesecke, R., Surakka, T., and Hakonen, M. (2016). Con-
ceptualising mobility as a service. In 2016 Eleventh
International Conference on Ecological Vehicles and
Renewable Energies (EVER), pages 1–11.
Holmberg, P.-E., Collado, M., Sarasini, S., and Williander,
M. (2016). Mobility as a service-maas. describing the
framework (final report maas framework). Technical
report, Viktoria Swedish ICT AB, Sweden.
Hung, M. (2017). Leading the iot. Technical report, Gart-
ner.
Jittrapirom, P., Caiati, V., Feneri, A.-M., Ebrahimighare-
hbaghi, S., Gonz
´
alez, M., and Narayan, J. (2017). Mo-
bility as a service: A critical review of definitions,
assessments of schemes, and key challenges. Urban
Planning, 2(2):13–25.
Karlsson, I. M., Sochor, J., and Str
¨
omberg, H. (2016). De-
veloping the ‘service’ in mobility as a service: Expe-
riences from a field trial of an innovative travel bro-
kerage. Transportation Research Procedia, 14:3265 –
3273. Transport Research Arena TRA2016.
Katzev, R. (2003). Car sharing: A new approach to urban
transportation problems. Analyses of social issues and
public policy, 3(1):65–86.
Newman, S. (2015). Building Microservices. O’Reilly Me-
dia, Inc., 1st edition.
Shaheen, S., Stocker, A., and Bhattacharyya, A. (2016).
Multimobility and sharing economy. Technical Report
E-C120, Transportation Research Board, 500 Fifth
Street, NW, Washington, DC 20001.
Sherly, E. and Somasundareswari, D. (2015). Internet of
things based smart transportation systems. Interna-
tional Research Journal of Engineering and Technol-
ogy, 2(7).
Sloman, L., Cairns, S., and Goodwin, P. (2003). The in-
fluence of soft factor interventions on travel demand:
summary report.
Sochor, J., Karlsson, I. C. M., and Str
¨
omberg, H. (2016).
Trying out mobility as a service: Experiences from a
field trial and implications for understanding demand.
Transportation Research Record, 2542(1):57–64.
Steg, L. (2003). Can public transport compete with the pri-
vate car? IATSS Research, 27(2):27 – 35.
Thangavel, D., Valera, A. C., Tan, H.-X., and Tan, C. K.-Y.
(2014). Performance evaluation of mqtt and coap via a
common middleware. 2014 IEEE Ninth International
Conference on Intelligent Sensors, Sensor Networks
and Information Processing (ISSNIP), pages 1–6.
Zanella, A., Bui, N., Castellani, A., Vangelista, L., and
Zorzi, M. (2014). Internet of things for smart cities.
IEEE Internet of Things Journal, 1(1):22–32.
SmartMobility, an Application for Multiple Integrated Transportation Services in a Smart City
67
