
The Reduction of 1.06-m Emission in a Double Cladding Tellurite
All-solid Photonic Bandgap Fiber Doped with Neodymium Ions
Tong Hoang Tuan, Kohei Suzaki, Nobuhiko Nishiharaguchi, Takenobu Suzuki and Yasutake Ohishi
Toyota Technological Institute, 2-12-1 Hisakata, Tempaku-ku, Nagoya, 468-8511, Japan
Keywords: Neodymium Doped Fiber, All-solid Photonic Bandgap Fibers, Tellurite Fibers, Fiber Fabrication.
Abstract: In order to take advantage of the 1.33-µm emission from
4
F
3/2
→
4
I
13/2
transition of Nd
3+
ions to realize many
potential applications in this telecommunication band, it is important to filter out the intense 1.06-µm
emission from the
4
F
3/2
→
4
I
11/2
transition. In this work, a new tellurite all-solid photonic bandgap fiber with
double cladding layer was proposed. In addition, 8 high-index rods and an Nd
3+
-doped core were arranged
in a horizontal line and located in the center of the fiber. Numerical calculation was carried out to study the
properties of the propagation modes at 0.8, 1.06 and 1.33 µm. By controlling the diameters of the core and
high-index rods, it is possible to reduce the intensity of the 1.06-m light, but maintain the intensity of the
lights at 0.8 and 1.33 µm when they propagate in the fiber core.
1 INTRODUCTION
In recent years, the demands of optical amplifiers
and lasers which can operate at various wavelengths
in telecommunication bands to develop broadband
optical systems for global telecommunication are
rapidly raising. By using Erbium-doped fiber
amplifiers (EDFA) as gain media for wavelength
division multiplexing (WDM) systems, gain
bandwidths from 1530 to 1560 nm (Jose, 2015) can
be achieved but they are as narrow as 30 nm.
Among several active rare-earth ions that have
been investigated for optical fiber amplifiers and
lasers in the telecommunication band, Neodymium
ion (Nd
3+
) is an attractive candidate as 1.3-µm
optical amplification active ions due to its
4
F
3/2
→
4
I
13/2
transition (Miniscalco, 1988; Wang, 1994;
Naftaly, 2000). However, when it is excited by
pumping at 0.8 µm, the presence of the intense
amplified spontaneous emission (ASE) at 1.06 µm
has become a major problem. This ASE is attributed
to the
4
F
3/2
→
4
I
11/2
transition whose branching ratio is
about 5 times larger than that of the
4
F
3/2
→
4
I
13/2
transition for the ASE at 1.33 µm. To take full
advantage of the 1.33-µm ASE, it is necessary to
filter out the intense 1.06-m ASE by using a
continuous distributed filter (Naftaly, 2000).
In this work, we proposed a new tellurite all-
solid photonic bandgap fiber (ASPBF) as a
promising solution. The fiber consists of an Nd
3+
-
doped core in the center, a horizontal line of 8 high-
index rods and double cladding layers. The
propagation of the lights at 0.8, 1.06 and 1.33 m in
the fiber core was investigated. By controlling the
fiber parameters, the transmission of the 1.06-m
light can be reduced and becomes weaker as
compared to the others.
2 MATERIAL PROPERTIES
A conventional ASPBF usually consists of an
arrangement of isolated high-index rods located in a
low-index cladding (Knight, 2006). In this work, a
step-index cladding profile was designed by using
two cladding layers with different refractive index.
The materials for the core, rod, inner cladding and
outer cladding were developed by using tellurite
glasses. The core material was TeO
2
-ZnO-Na
2
O-
La
2
O
3
which was doped with 0.5 wt% of Nd
3+
ions
(TZNL-Nd-doped). The tellurite glass TeO
2
-Li
2
O-
WO
3
-MoO
3
-Nb
2
O
5
(TLWMN) was used for high
index rods and the TeO
2
-ZnO-Na
2
O-La
2
O
3
(TZNL)
and TeO
2
-ZnO-Li
2
O-K
2
O-Al
2
O
3
-P
2
O
5
glasses were
used for the cladding materials, respectively. High
purity TeO
2
powder (99.999%) and an electric
furnace with dry gas flows of argon and oxygen
were used to avoid the OH-contamination. After
Tuan, T., Suzaki, K., Nishiharaguchi, N., Suzuki, T. and Ohishi, Y.
The Reduction of 1.06-m Emission in a Double Cladding Tellurite All-solid Photonic Bandgap Fiber Doped with Neodymium Ions.
DOI: 10.5220/0007957302650268
In Proceedings of the 16th International Joint Conference on e-Business and Telecommunications (ICETE 2019), pages 265-268
ISBN: 978-989-758-378-0
Copyright
c
2019 by SCITEPRESS – Science and Technology Publications, Lda. All rights reserved
265
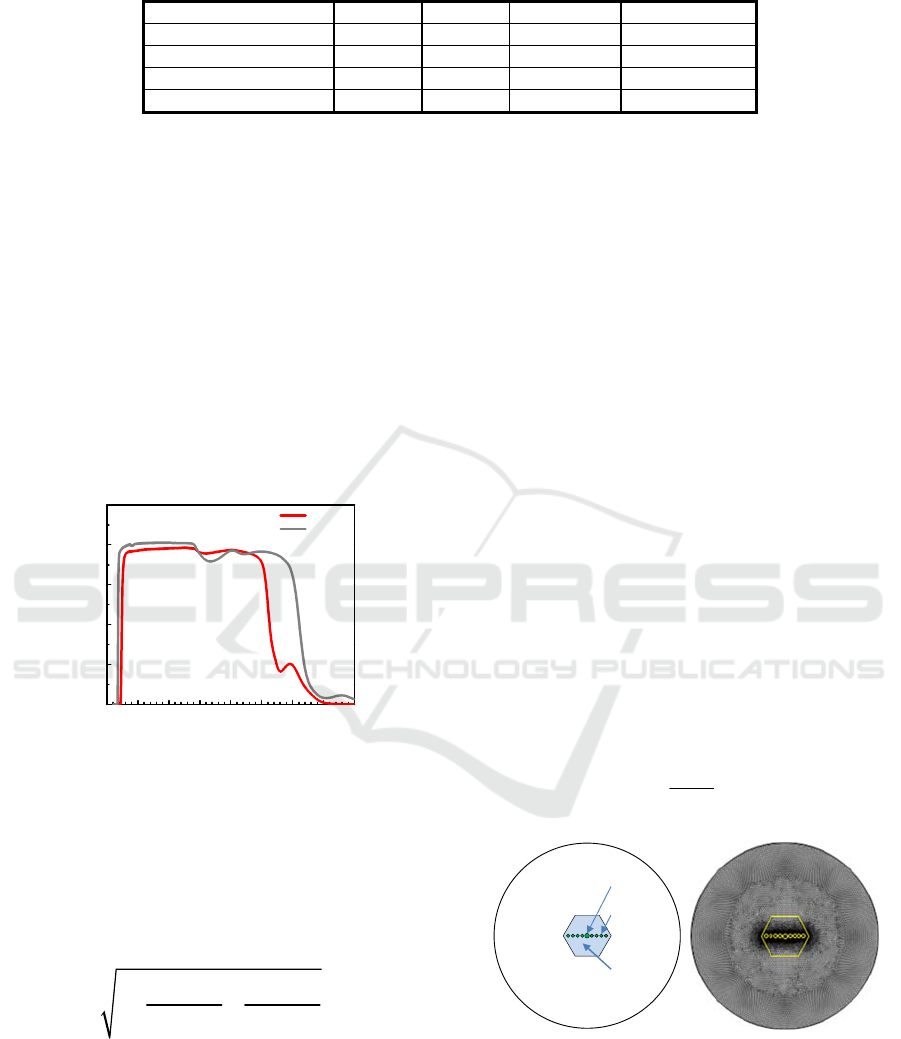
Table 1: Fitted Sellmeier coefficients for tellurite glasses TLWMN, TZNL-Nd-doped-0.5, TZNL and TZLKAP.
A
1
A
2
B
1
B
2
TLWMN 3.2604 1.5796 190.0044 12704.1262
TZNL-Nd-doped-0.5 2.9259 0.0000 181.3663 31152.5524
TZNL 2.8614 0.0000 182.6837 7727.8810
TZLKAP 1.5729 2.3188 118.0236 18278.9797
quenching to room temperature, glass samples were
cut into 1-mm-thick glass slides and polished
carefully for the measurement of transmission and
refractive index.
Transmission spectra of TLWMN (high-index
rod material) and TZNL (inner cladding materials)
were measured by an UV/VIS/NIR Spectrometer
(Perkin Elmer, Lambda 900) and an FT-IR
spectrometer (Perkin Elmer, Spectrum 100) and
plotted in Fig. 1. Both TLWMN and TZNL glasses
have high transmittance more than 70% covering a
wide range from 0.5 to 5.0 µm. In addition, the
transmission range of TZNL glass can extend up to
6.0 µm.
Figure 1: Measured transmission spectra of TLWMN and
TZNL glasses.
The refractive indices of tellurite glasses at four
wavelengths 633, 974, 1320 and 1544 nm were
measured by a prism coupler system (Metricon
2010). They were fitted to Sellmeier equation as
given in Eq. (1) in which A
1
, A
2
, B
1
and B
2
are
Sellmeier coefficients and are shown in Table 1.
22
12
22 22
12
1
AA
n
BB
(1)
The wavelength dependent refractive indices of
TLWMN, TZNL-Nd-doped-0.5, TZNL and
TZLKAP tellurite glasses obtained from Eq. (1)
were used to calculate the light propagation and
bandgap properties of the fiber by the Comsol
Multiphysics software.
3 NUMERICAL CALCULATION
AND DISCUSSION
A schematic image of the fiber structure was plotted
in Fig. 2. The fiber was designed with an outer
circular cladding (Clad 2) made of the TZLKAP
glass and an inner hexagonal cladding (Clad 1) made
of the TZNL glass. Inside the Clad 1, a solid rod of
the TZNL-Nd-doped-0.5 was placed at the center as
the fiber core and it was horizontally surrounded by
two sets of 4 high index rods made of the TLWMN
glass. The core diameter and the rod diameter were
D
core
and D
rod
, respectively. The filling fraction (FF)
is defined by the ratio between the rod diameter and
the distance between two adjacent rods (p) as given
in Eq. (2). The numerical technique Finite Element
Method (FEM) and the perfectly match layer
boundary condition were used. The size of the mesh
was automatically optimized to maintain the
calculation accuracy but reduce the calculation time.
In the center of the fiber, the mesh was as small as
0.0018 µm. The size of the mesh became larger at
the outer cladding and was as large as 0.9 µm. The
mesh distribution for the calculation was
schematically plotted in Fig. 2.
rod
D
FF
p
(2)
Figure 2: Schematic image of the fiber structure (left-side)
and of the mesh distribution (right-side).
The target of this work is to realize fiber
structures which allow high intensity lights to
propagate in the core at 0.8 and 1.33 µm but hinder
the transmission of the light at 1.06 µm. The
calculation was first carried out when D
core
was 3.0
012345678
0
20
40
60
80
100
Transmittance (%)
Wavelength (
m)
TLWMN
TZNL
Core
Rod
Clad 1
Clad 2
OPTICS 2019 - 10th International Conference on Optical Communication Systems
266
µm, D
rod
was 2.5 µm and FF was 0.75. Figure 3
shows the effective refractive index spectrum of the
modes which can propagate in the core of the
designed fiber in the vicinity of 0.8, 1.06 and 1.33
µm. The wavelength interval was 0.1 µm. At each
wavelength, the red dot represents the fundamental
mode or the mode which has highest intensity in the
core. On the other hand, the blue dots show modes
which were weakly confined in the core and their
energy leak out to the surrounding region due to the
photonic bandgap properties. It can be inferred that
when the red dot overlaps with the blue dot, the light
confinement in the core of that mode becomes weak.
In other words, the intensity of the light which
propagates in the core at that wavelength reduces.
Provided that the red dot overlaps with the blue at
1.06 µm, the 1.06-m ASE of Nd
3+
ions will be
weakly confined in the core, but the pump at 0.8 µm
and the 1.33-µm ASE can still propagate in the core
with high intensity if the red dot does not overlap the
blue at 0.8 and 1.33 µm at the same time. That is to
say, it is possible to filter out or reduce the 1.06-m
ASE continuously along the fiber as we expected by
controlling the fiber parameters and the bandgap
properties to satisfy the above conditions.
In order to confirm this feature, the intensity
distribution of the mode fields which correspond to
red dots at 0.8, 1.06 and 1.33 µm were calculated
and shown in Figs. 3b, 3c and 3d. Because the red
dots at those wavelengths do not coincide with the
blue dots as can be seen in Fig. 3a, lights at those
wavelengths are strongly confined in the core.
Notably, the intensity of the light at 1.06 µm is about
two times higher than that of the light at 1.33 µm as
shown in Figs. 3c and 3d. It gives a chance for the
1.06-µm ASE to be dominant in the emission
spectrum.
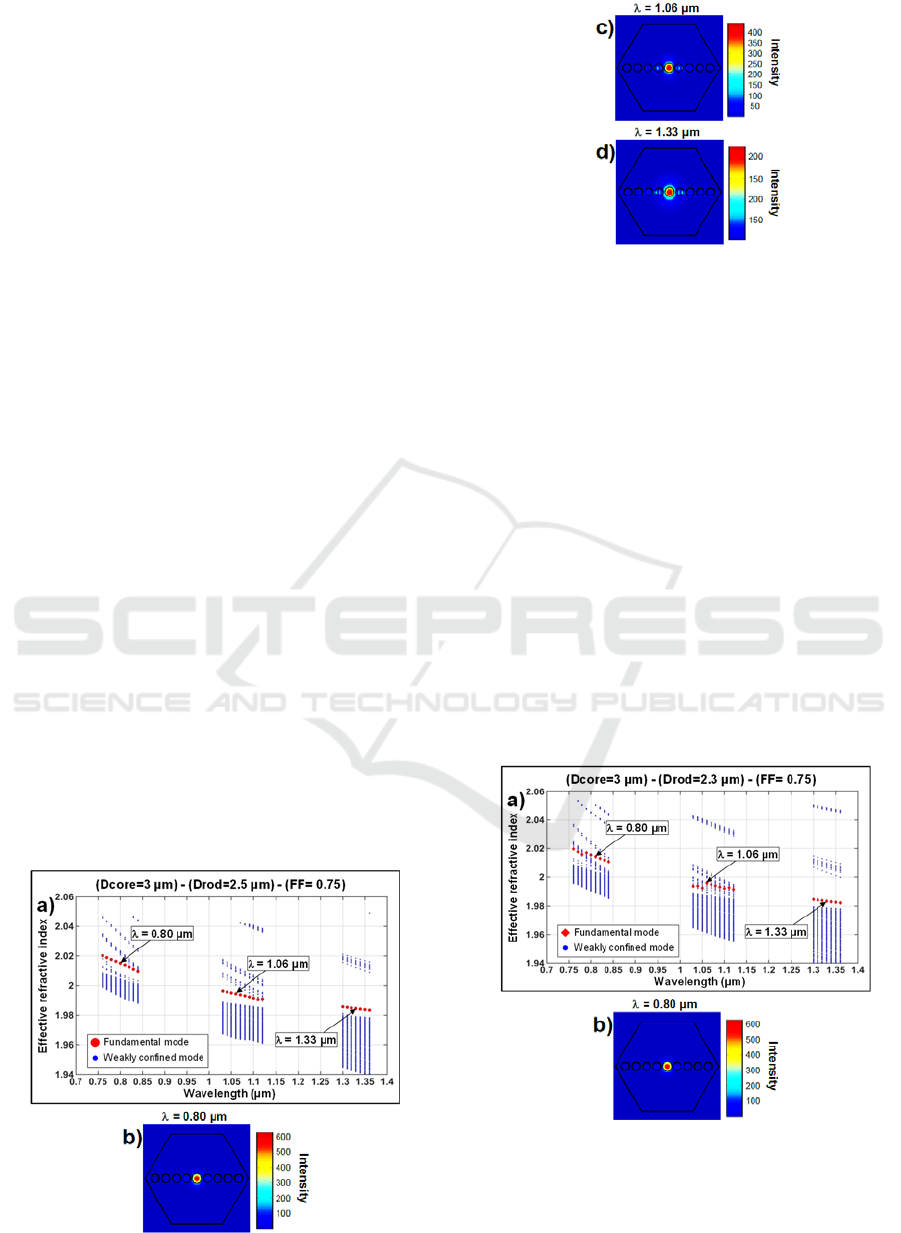
Figure 3: (a) Calculated effective refractive index of
modes which can propagate in the fiber core when D
core
was 3.0 µm, D
rod
was 2.5 µm and FF was 0.75. (b), (c)
and (d) are intensity distribution of modes which
correspond to red dots at 0.8, 1.06 and 1.33 µm,
respectively.
In order to investigate the effect of D
rod
, similar
calculations were done when it decreased from 2.5
µm to 2.3 µm and the results were shown in Fig. 4.
Figure 4a shows that the red dot at 1.06 µm started
to overlap the blue dot, but the red dots at 0.8 and
1.33 µm were still out of the blue dot range. In
agreement with Fig. 4a, a Gaussian-like distribution
of light intensity was recognized at 0.8 and 1.33 µm
as shown in Figs. 4b and 4d, but it was not obtained
at 1.06 µm as shown in Fig. 4c. Compared to the
mode at 1.33 µm in Fig. 4d, the highest intensity of
the mode at 1.06 µm in Fig. 4c becomes about 5
times lower. To put it another way, it is successful to
reduce the intense 1.06-µm ASE but maintain the
1.33-µm ASE by using this ASPBF’s structure.
Figure 4: (a) Calculated effective refractive index of
modes which can propagate in the fiber core when D
core
was 3.0 µm, D
rod
was 2.3 µm and FF was 0.75. (b), (c)
and (d) are intensity distribution of modes which
correspond to red dots at 0.8, 1.06 and 1.33 µm,
respectively.
The Reduction of 1.06-m Emission in a Double Cladding Tellurite All-solid Photonic Bandgap Fiber Doped with Neodymium Ions
267
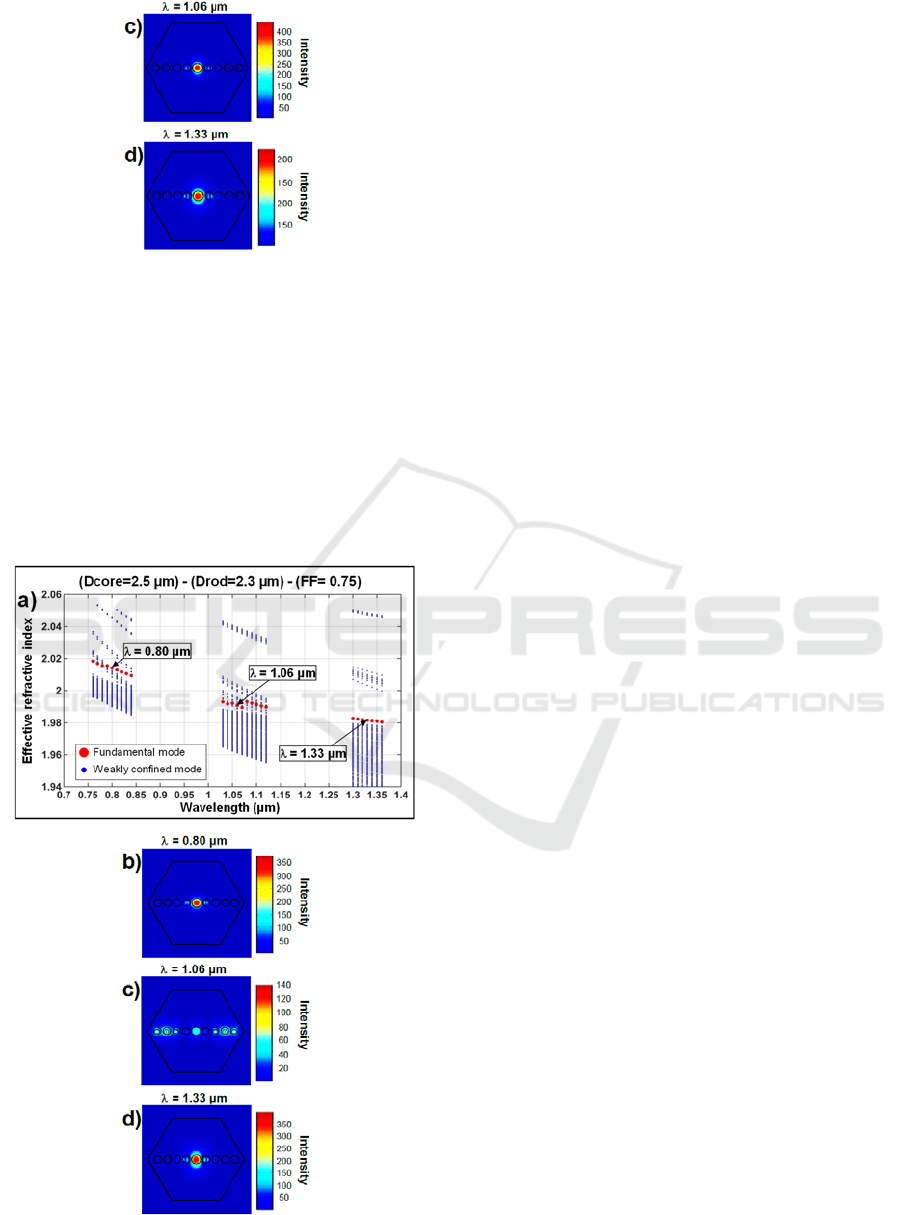
Figure 4: (a) Calculated effective refractive index of
modes which can propagate in the fiber core when D
core
was 3.0 µm, D
rod
was 2.3 µm and FF was 0.75. (b), (c)
and (d) are intensity distribution of modes which
correspond to red dots at 0.8, 1.06 and 1.33 µm,
respectively. (cont.)
When D
core
decreases from 3.0 to 2.5 µm, the red
dot at 1.06 µm moves deeper to the blue dot range as
shown in Fig. 5a. Although the light at 1.06 µm can
propagate in the core with a Gaussian-like
distribution as shown in Fig. 5c, its highest intensity
is about 3 times lower than that at 1.33 µm.
Figure 5: (a) Calculated effective refractive index of
modes which can propagate in the fiber core when D
core
was 2.5 µm, D
rod
was 2.3 µm and FF was 0.75. (b), (c)
and (d) are intensity distribution of modes which
correspond to red dots at 0.8, 1.06 and 1.33 µm,
respectively.
4 CONCLUSIONS
It was demonstrated in this work that by controlling
fiber parameters of a new tellurite double-cladding
ASPBF such as the filling fraction, the core and
high-index rod diameters, the photonic bandgap
properties were modified and the intense 1.06-m
emission peak due to the
4
F
3/2
→
4
I
11/2
transition of
Nd
3+
ions was greatly reduced as compared to the
1.33-µm ASE caused by the
4
F
3/2
→
4
I
13/2
transition.
This feature is benefit to realize many potential
applications employing the 1.3-m emission of Nd
3+
ions such as optical fiber amplifiers, display
technologies, laser therapeutics and biomedical
applications.
ACKNOWLEDGEMENTS
This work is supported by the Japan Society for the
Promotion of Science (JSPS) KAKENHI (Grant
Number 15H02250, 17K18891 and 18H01504) and
the JSPS-CNRS joint research program.
REFERENCES
Jose, T. and Narayanan, V.,2015. Design of a gain
flattened doped fiber amplifier with stabilized power
output for WDM transmissions, 2015 International
Conference on Microwave, Optical and
Communication Engineering (ICMOCE), 193-196.
Miniscalco, W. J. and Andrews, L. J.,1988. Fiber Optic
Lasers and Amplifiers for the Near-Infrared, Mater.
Sci. Forum, 32-33, 501-510.
Wang, J. S., Vogel, E. M., Snitzer, E., Jackel, J. L.,
Dasilva, V. L. and Silberberg, Y., 1994. 1.3-µm
emission of Neodymium and Praseodymium in
Tellurite-based glasses, J. Non-cryst. Solids, 178, 109-
113.
Naftaly, M. and A. Jha,2000. Nd
3+
-doped fluoroaluminate
glasses for a 1.3-µm amplifier, J. Appl. Phys., 87,
2098-2104.
Knight, J. C., Luan, F., Pearce, G. J., Wang, A., Birks, T.
A. and Bird, D. M.,2006. Solid photonic bandgap
fibres and applications, Jpn. J. Appl. Phys., 45, 6059-
6063.
OPTICS 2019 - 10th International Conference on Optical Communication Systems
268
