
Automatic Offset Detection in GPS Time Series by Change Point
Approach
Giuseppe Nunnari
1 a
and Flavio Cannavo
2 b
1
Dipartimento di Ingegneria Elettrica, Elettronica e Informatica, Universit
´
a degli Studi di Catania,
Viale A. Doria, 6, 95125 Catania, Italy
2
Istituto Nazionale di Geofisica e Vulcanologia - Sezione di Catania, Piazza Roma 2, Catania, Italy
Keywords:
Change Point Detection, Offsets, GPS Time Series, De-trending, Warning Systems, Volcano Monitoring.
Abstract:
This paper deals with the problem of automatic detection of offsets in GPS time series, which is of interest both
in active volcanic and tectonic areas, where they often signal either the opening of eruptive fissures or seismic
and aseismic dislocations. The problem is tackled by using the Change Point Detection (CPD) approach.
Results show that CPD algorithms are suitable both in off-line and on-line frameworks. In particular, we show
that CPD algorithms could contribute to the implementation of a warning system of volcanic intrusive activity.
1 INTRODUCTION
The Global Positioning System (GPS) has become an
essential tool for ground deformation monitoring in
areas subject to the risks of natural disasters, such as
active volcanic and tectonic ones. Detection of poten-
tially hazardous events (such as earthquakes and vol-
canic eruptions), as quickly as possible, can be use-
ful for safeguarding human lives and infrastructures.
However, data available in real time by GPS moni-
toring networks are not themselves enough for a re-
liable evaluation of the phenomena in progress, un-
less appropriate analysis tools be available too. One
of the problems that prevent an effective use of GPS
sub-daily solutions for real time applications, is that
they are usually affected by a significant amount of
noise. In particular, the shorter is processed period,
the higher is the level of noise affecting the GPS so-
lutions. Thus, the algorithms for detecting true dis-
placement transients must be as robust as the sam-
pling time is lower. Due to the large number of noise
sources, often not well known, GPS noise is gener-
ically modeled as a mixture of white noise, flicker
noise and random walk noise (Mao et al., 1999).
Offsets are one of the components of GPS time
series, sometimes considered as a source of noise,
which could contribute to degrade the accuracy of
GPS time series. They can be due to the equipment
a
https://orcid.org/0000-0002-7117-3174
b
https://orcid.org/0000-0001-7550-8579
problems, such as antenna or receiver changes, but
also to natural phenomena, such as post seismic ef-
fects of earthquakes and, in volcanic areas, to the
opening of eruptive fissures. Offsets can have vari-
ous sizes, from very small, which are very difficult to
detect in presence of noise, to quite large, which, on
the contrary, can be easily detected. In Gazeaux et al.
(2013) results of a competition, launched to various
research teams, with the purpose of assessing the ef-
fectiveness of methods to detect and remove offsets,
are reported. In the competition, the data set, con-
sisting of simulated GPS time series, was made avail-
able to the GPS analysis community without reveal-
ing the offsets, and several groups conducted blind
tests with a range of detection approaches. The re-
sults of this experiment showed that manual meth-
ods, where offsets are hand-picked, almost always
give better results than automated or semi-automated
methods. However, while hand picked methods can
be considered for off-line applications, they have no
utility for monitoring purposes, where automatic ap-
proaches are mandatory.
This paper deals with the problem of automatic
detection of offset both in daily and high rate (sub-
daily) GPS time series, reporting a case study con-
cerning offset detection in data recorded at the Mount
Etna volcanic area. The task was tackled by using
the Change Point Detection (CPD) approach, already
widely described in literature. A recent survey of
methods for CPD can be found in Aminikhanghahi
and Cook (2017). This paper is organized as follows:
Nunnari, G. and Cannavo, F.
Automatic Offset Detection in GPS Time Series by Change Point Approach.
DOI: 10.5220/0007951503770383
In Proceedings of the 16th International Conference on Informatics in Control, Automation and Robotics (ICINCO 2019), pages 377-383
ISBN: 978-989-758-380-3
Copyright
c
2019 by SCITEPRESS – Science and Technology Publications, Lda. All rights reserved
377

in section 2 a general model of GPS time series is
described, while in section 3 the mathematical back-
ground about change point detection algorithms is re-
ported. In section 4 the off-line CPD approach was
applied to detect offsets in daily GPS time series. In
section 5, the results of a case study concerning on-
line transient detection in sub-daily GPS time series
at Mount Etna is reported. Finally, the conclusions
are drawn in section 6.
2 A GENERAL MODEL OF GPS
TIME SERIES
In order to describe more precisely what is referred to
as offset in GPS time series, it can be useful to know
that GPS time series can be modeled as described in
equation (1).
x(t
i
) = x
0
+ bt
i
+
l
∑
j=1
a
j
H(t
j
− T
j
)+
m
∑
n=1
A
n
sin(ω
n
t + ϕ
n
) + n
i
(t
i
) (1)
where, for the epoch t
i
:
• the first term x
0
is the site coordinate,
• the second term bt
i
is the linear rate,
• the third term, consists by a sum of l Heaviside
step functions H(t
j
− T
j
), each having amplitude
a
j
.
• the fourth term consists of m periodic compo-
nents, mainly the annual and semiannual signals,
where ω
n
= 2
2π
n
rad/year
• the final term, n
i
(t
i
), is the noise component of the
GPS times series.
The first four terms of this model, which represent
the deterministic part of the model, are easy to un-
derstand. In particular, the Heaviside step functions
a
j
H(t
j
− T
j
) attempt to model what are referred in
this paper as offsets. The noise term, which is the
stochastic model term, is some time obscure, since it
attempts to model the effects of several phenomena,
such as propagation effects of GPS signals, multi-
path etc. Several papers have been devoted in liter-
ature to characterize the noise term, based on the ap-
proaches described in Mao et al. (1999) and Williams
et al. (2004). These approaches, applied also recently
(Birhanu et al., 2018), consist in characterizing the
term n
i
(t
i
) as a combination of white noise, fliker
noise, with a spectral density proportional to 1/ f , and
random walk noise, with a spectral density propor-
tional to 1/ f
2
, being f the frequency. However, since
this aspect is outside the scope of this paper, we do
not enter into more details.
3 CHANGE POINT DETECTION
A change point represents a transition between differ-
ent states in a process that generates the time series.
Change point detection can be defined as the prob-
lem of choosing between two alternatives: no change
occurred and the alternative hypothesis, a change oc-
curred. CPD algorithms are traditionally classified
as online or offline. Offline algorithms consider the
whole data set at once and try to recognize where the
change occurred. Thus, the objective, in this case is
to identify all the sequence change points in batch
mode. In contrast, online, or real-time, algorithms
run concurrently with the process they are monitor-
ing, processing each data point as it becomes avail-
able, with the goal of detecting a change point as soon
as possible, after it occurs, ideally before the next data
point arrives. In practice, no CPD algorithm oper-
ates in perfect real time because it must wait for new
data before determining if a change point occurred.
However, different online algorithms require differ-
ent amounts of new data before a change point can be
detected. Based on this observation an on-line algo-
rithm which needs at least ε samples in the new batch
of data to be able to find a change is usually denoted
as ε-real time. Therefore, off-line algorithms can then
be viewed as ∞-real time while the best on-line algo-
rithm is 1-real time, because for every data point, it
can predict whether or not a change point occurs be-
fore the new data point. Smaller ε values may lead
to stronger, more prompt change point detection al-
gorithms.
To find a change point in a time series, a global
optimization approach can be employed on the fol-
lowing basic algorithm:
1. Choose a point and divide the signal into two sec-
tions.
2. Compute an empirical estimate of the desired sta-
tistical property for each section.
3. At each point within a section, measures how
much the property deviates from the empirical es-
timate and at the end, add the deviation for all
points.
4. Add the deviations section-to-section to find the
total residual error.
5. Vary the location of the division point until the
total residual error attains a minimum.
As mentioned above, the search for a change point k
can be formulated as an optimization problem where
ICINCO 2019 - 16th International Conference on Informatics in Control, Automation and Robotics
378

the cost function J(k) to minimize can be written, in
the general case as
J(k) =
k−1
∑
i=1
∆(x
i
;χ([x
1
,...,x
k−1
]))+
N
∑
i=k
∆(x
i
;χ([x
k
,. ..,x
N
])) =
(2)
where {x
1
,x
2
,. ..,x
N
} is the time series, χ is the cho-
sen statistic and ∆ is the deviation measurement. In
particular, when χ is the mean, the cost function as-
sumes the following form:
J(k) =
k−1
∑
i=1
(x
i
− hxi
k−1
1
)
2
+
N
∑
i=k
(x
i
− hxi
N
k
)
2
(3)
where the symbol h·i indicates the mean operator.
Another aspect to be considered, when formulating
the optimization problem, is that signals of practical
interest have more than one change point. Further-
more, the number of change points K is often not
known a priori. To handle these features, the cost
function can be generalized as
J(K) =
K−1
∑
r=0
k
r+1
−1
∑
i=k
r
∆(x
i
;χ([x
k
r
,. ..,x
k
r+1
−1
])) + βK
(4)
where k
0
and k
K
are respectively the first and the last
sample of the signal. In expression (??) the term βK
is a penalty term, linearly increasing with the num-
ber of change points K, which avoid the problem of
overfitting. Indeed, in extreme case (i.e. β = 0), J(K)
reaches the minimum value (i.e. 0) when every point
becomes a change point (i.e. K = N). The CPD
algorithm considered in this work was implemented
in Matlab following the description given by Killick
et al. (2012) and Lavielle (2015). Recent develop-
ments concerning algorithms for CPD can be found
in Soh and Chandrasekaran (2017) and Celisse et al.
(2018).
4 OFF-LINE DETECTION OF
OFFSETS
To the purposes of this paper, both daily and 10-
minute sampled GPS time series recorded by the GPS
monitoring network (Figure 1) have been considered.
As for the daily solutions, the used GPS time series
were recorded from January 2011 to November 2018
by five stations, referred to as ECNE, ECPN, EINT,
EPDN and EPLU (see the map in Figure 1), all lo-
cated in the summit area of the volcano.
Figure 1: The GPS measuring network managed by INGV.
Figure 2: East, North and Up daily GPS components
recorded at five stations.
As concerning 10-minute sampled data, they were
recorded at 19 stations from August 2018 to Decem-
ber 2018.
The data set of daily GPS data, without any pre-
processing, except filling missing data by linear in-
terpolation, is shown in Figure 2. As it can be seen,
offsets are evident in the East and North components,
while periodic fluctuations, mainly due to mass load-
ing, are particularly evident on the Up component,
i.e. in direction of the gravity field Liu et al. (2017).
Thus, it is a common practice to process separately
the horizontal (i.e. the East and North) and the ver-
tical components. Moreover, in order to just detect
offsets in time series of displacements, it is suitable
to reduce the data dimensionality by neglecting the
displacement direction, thus composing the east and
north components into the horizontal displacement
strength. The CPD algorithms can operate both by
fixing the maximum number of change points to be
detected (K), or the maximum acceptable residual er-
ror (i.e. fixing a threshold on J(K)). The first choice is
appropriate when operating off-line, since one can es-
timate the number of offsets, for instance by visual in-
spection of the time series. If this choice is performed,
the indicated number of offsets will be detected and
ordered by amplitude from larger to smallest. The
choice of operating by threshold is instead more ap-
propriate when an estimation of the number of offsets
in the GPS time series cannot be easily performed. As
an example, in order to detect only the most signifi-
cant offset in the whole time interval, from January
Automatic Offset Detection in GPS Time Series by Change Point Approach
379
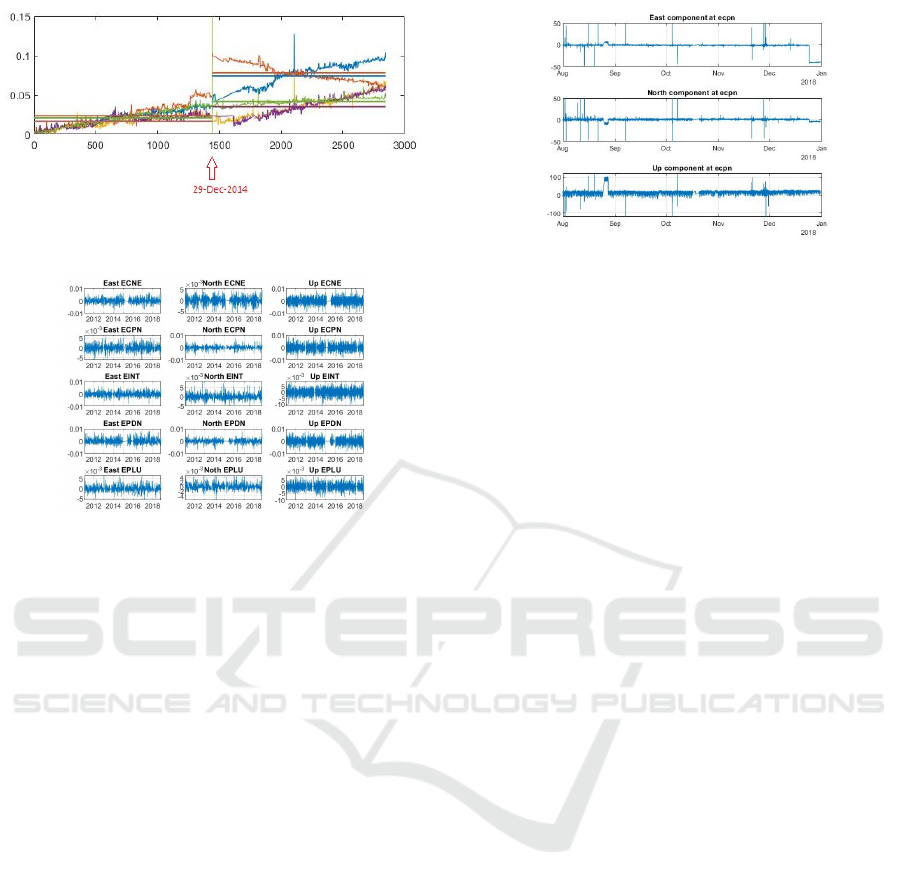
Figure 3: Off-line detection of the largest offset in the GPS
displacement strength daily component.
Figure 4: Residuals, after removing the linear trends.
2011 to November 2018, we can set to 1 the maxi-
mum number of change points, thus obtaining the re-
sult shown in Figure 3. It can be interesting to ob-
serve that the time stamp associated with this offset
was 29-Dec-2014, which corresponds to the day after
the starting of the eruptive event occurred at Mount
Etna on 28-Dec-2014 Gambino et al. (2016). There-
fore, the off-line CPD algorithm was able to detect the
offset due to the eruption event.
Running the CPD algorithm with an appropriate
maximum number of offsets, or specifying a maxi-
mum threshold on the cost function, can be very use-
ful for off-line detrending of GPS time series. Indeed,
after offsets are detected, the linear trends obtained
interpolating samples between consecutive change
points, can be removed, giving the results shown in
Figure 4. Residuals from detrending can then be used
to characterize the noise source for the study area
by using strategies described in Mao et al. (1999),
Williams et al. (2004), or Birhanu et al. (2018).
5 ON-LINE DETECTION OF
OFFSETS
Daily GPS time series, considered in the previous sec-
tion, are not appropriate to the purpose of implement-
ing a warning systems based on offset detection, since
1 day is a quite long time for detecting very fast phe-
Figure 5: The East, North and Up GPS component mea-
sured at the ECPN stations.
nomena such as the opening of an eruptive fissure,
which may onset in times of the order of a few tens
of minutes. For this purpose, we used the time series
coming from 10-minute kinematic GPS solutions to
detect possible offsets. To this end, one of the main
problems to deal with is the pervasive presence of out-
liers due to the quite poor geodetic quality of real time
GPS positioning. As an example, we report in Figure
5 the GPS components measured at one of the summit
stations referred to as ECPN. As it is possible to see,
the time series are affected by a considerable number
of outliers, whose value may exceed several times the
variance of the signal. A strategy to deal with out-
liers is, obviously, to detect them and remove or re-
place. As for outlier detection purposes, several cri-
teria have been proposed, as for instance to consider
outliers the samples which exceed more than a multi-
ple of standard deviation from the mean of the series.
As concerning the replacement criteria, a variety of
approaches there exists such as filling with a specified
scalar value or with the center value or with the previ-
ous non-outlier value etc. For instance, the results of
detecting and filling outliers, in a off-line framework,
at the ECPN station by using the criterion of consider-
ing outliers the samples exceeding three standard de-
viations from the mean and filling them with the cen-
ter values, gives the result shown in Figure 6. It is
possible to see that the algorithm efficiently removes
and fill the outliers that satisfy the mentioned criteria.
Of course, for on-line offset detection, the filling out-
liers algorithm must be according implemented. This
means that a new sample will be added to a batch of
data after processing it to see it it is an outlier.
To measure the performances of the on-line CPD
algorithm, we considered the ε index (see section 3),
i.e. the number of samples in the new batch of data
required by the algorithm to detect an offset. More-
over, we have identified as target the offset mentioned
above, occurred on 24-Dec-2018, which, based on
information issued by the Istituto Nazionale di Ge-
ofisica e Vulcanologia AA.VV (2018), responsible for
ICINCO 2019 - 16th International Conference on Informatics in Control, Automation and Robotics
380
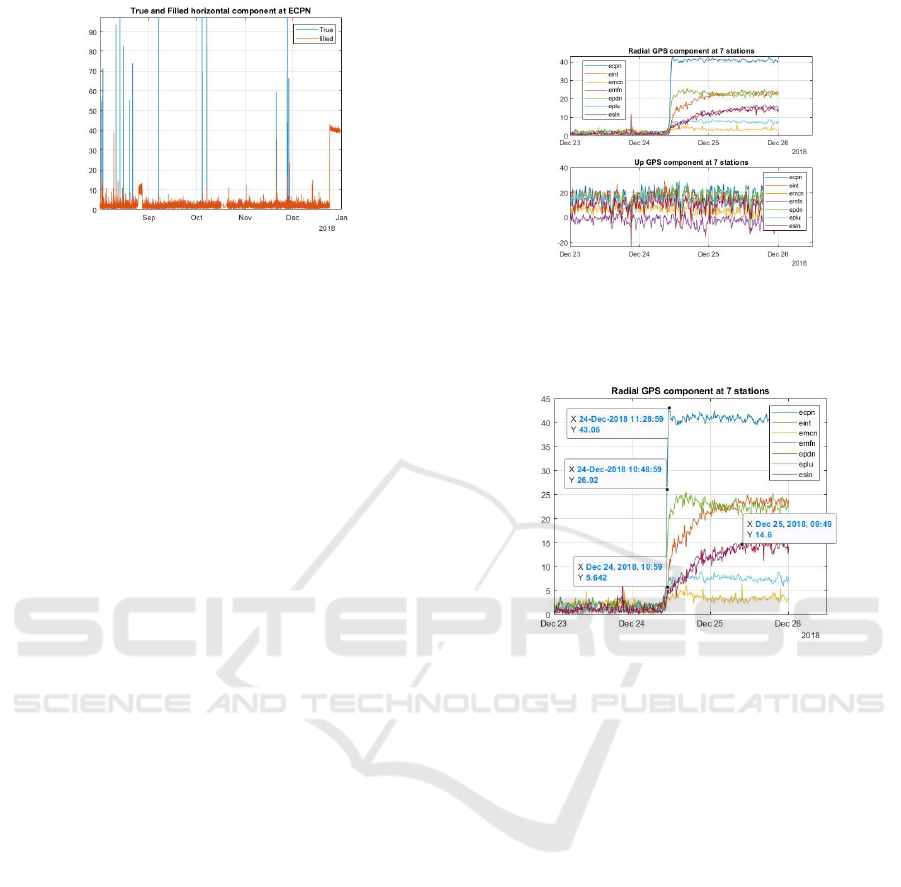
Figure 6: True and filled GPS displacement strength com-
ponent at the ECPN station.
studying and monitoring Mount Etna, can be asso-
ciated to an eruptive event. A description of such
event is summarized as follows. Shortly after 11:00
(hereinafter all the times are expressed in GMT), an
eruptive fissure opened up at the southeastern base
of the New Southeast Crater, from which a violent
Strombolian activity emerged, which rapidly formed
a gaseous plume rich in dark ash. A second small
eruptive fissure simultaneously opened slightly more
to the north, between the New Southeast Crater and
the Northeast Crater, which produced only a weak
Strombolian activity, lasting a few tens of minutes.
At the same time, also the Northeast Crater and the
Bocca Nuova produced a continuous Strombolian ac-
tivity of variable intensity. Overall, the ash cloud gen-
erated by the eruptive vents produced a very consis-
tent dark ash plume, driven by the wind in the south-
easter quadrant of the volcano. In the following two
hours the eruptive fissure spread south-eastwards, ex-
ceeded the edge of the western wall of the Valle del
Bove, until it reaches a minimum altitude of about
2400 meters above sea level. From this description
it is possible to understand the complexity of the in-
volved phenomena. The effects of this eruptive event
on the GPS signal can be recognized in both the east
and north components, mainly at seven of the nine-
teen recording stations, as shown in Figure 7. For
the sake of simplicity, the east and north components
were merged to obtain the displacement strength. The
Figure shows that among the nineteen stations, the
first and most intense offset is recorded by the ECPN
station. Of the remaining stations, only six others
record the ground breaking phenomenon in various
ways, and in any case with some delay, compared to
the ECPN station. It could be interesting to know that
there are no appreciable evidences of the occurring of
the eruptive event in the Up components (see Figure
7, at the bottom). Thus, if we want to make a hand-
picking of the phenomenon, putting ourselves in the
best conditions, we must consider the recording of the
ECPN station. The data tips shown in Figure 8, al-
lows to place the phenomenon as occurred starting at
10:59. For the purposes of this paper it was impor-
Figure 7: Horizontal displacement strength and up compo-
nents at seven stations, immediately before and after the
starting of the eruptive event occurred on December 24,
2018.
Figure 8: Horizontal displacement strengths at 7 stations,
with data tips.
tant to evaluate the delay with which the online CPD
algorithm indicated the offset, compared to the hand-
picking we carried out. To this end, we set up the
following procedure:
1. Consider the longest batch of data prior to the
hand-picking, ending at the sample before the
hand-picking date and verify that the CPD algo-
rithm does not detect any offset.
2. Add to the batch of data one sample and test if the
on-line CPD algorithm detects the event.
3. If the offset is found, the procedure stops and the
number of samples supplied is assumed as the ε
index values, otherwise go back to step 2.
For making the experiment, we have considered data
recorded not only at the seven stations were the phe-
nomenon is quite evident, but at all the nineteen avail-
able stations, since in general we must presume that
we do not know what stations will provide useful in-
formation to detect an event. For warning purposes,
it is important to recognize the incoming of the phe-
nomena as soon as possible, but this capability de-
pends on both the features of the CPD algorithm and
the level of noise affecting the data. As a general rule
Automatic Offset Detection in GPS Time Series by Change Point Approach
381

Figure 9: Detection delay versus the windows length.
Figure 10: On-line detection by using a batch of data with
w = 1000.
the length of the data batch should be a compromise
between the sensitivity and specificity of the CPD al-
gorithm, i.e. the need of having a prompt detection
and that of avoiding false offsets. In order to de-
termine the length w of the batch that provides the
lowest delay value ε, we performed numerical sim-
ulations whose results are shown in Figure 9. From
data tips it is possible to see that with a batch length
w of about 1000 samples the detection delay is the
shortest possible (ε = 1), which becomes ε = 3 with
a batch of about 9000 samples. For larger w the delay
increases almost exponentially. Thus we have consid-
ered w = 1000. Following this choice, the considered
batch of data and the time of detection are shown in
Figure 10. A detail of the CPD output is shown in Fig-
ure 11, where it is possible to appreciate the prompt-
ness of the CPD algorithm as the level of the recorded
signal changes. Therefore, we can conclude that the
on-line CPD algorithm detected the offset with no de-
lay, compared with the hand-picking performed in the
best conditions, i.e. by using data recorded by the sta-
tion that detected the event as first.
Figure 11: A detail of the CPD offset detection.
6 CONCLUSIONS
In this paper we proposed the use of CPD algorithms
for automatic detection of offsets in GPS time series.
These algorithms have been considered both in off-
line and on-line frameworks. The off-line use of CPD
algorithms allows an effective detection of offsets and
therefore the removal of linear trends. This task is
preliminary in order to analyze the features of the
noise source in a given area. Furthermore, it is to bear-
ing in mind that a manual detrending of GPS time se-
ries, is quite tedious and time consuming. Despite this
undoubted advantage, the most interesting application
of the CPD algorithms seems to be their use for on-
line detection of offsets. Indeed, in this framework,
they can significantly contribute to the implementa-
tion of a warning system for monitoring volcanic ac-
tivity, in the wake of what was proposed by Cannavo
et al. (2017) and Hajian et al. (2018). Indeed, exper-
imental results, despite limited to an individual case
study, show that on-line CPD algorithms are promis-
ing tools for monitoring the opening of eruptive fis-
sures, in useful time to the onset of such a rather com-
plex phenomenon.
ACKNOWLEDGEMENTS
This work was supported by the University of Cata-
nia under the project Piano della Ricerca 2016-2018,
Linea Intervento 2.
REFERENCES
AA.VV (2018). Etna weekly bulletin n. 52/2018. Istituto
Nazionale di Geofisica e Vulcanologia, 52:1–11.
Aminikhanghahi, S. and Cook, D. J. (2017). A survey
of methods for time series change point detection.
Knowledge Information Systems, 51:339–367.
Birhanu, Y., Williams, S., Bendick, R., and Fisseh, S.
(2018). Time dependence of noise characteristics in
continuous gps observations from east africa. Journal
of African Earth Sciences, 144.
Cannavo, F., Cannata, A., Cassisi, C., Grazia, G. D., Mon-
talto, P., Prestifilippo, M., Privitera, E., Coltelli, M.,
and Gambino, S. (2017). A multivariate probabilistic
graphical model for real-time volcano monitoring on
mount etna. J. Geophys. Res.Solid Earth, 122:3480–
3496.
Celisse, A., Marot, G., Pierre-Jean, M., and Rigaill, G.
(2018). New efficient algorithms for multiple change-
point detection with reproducing kernels. Computa-
tional Statistics and Data Analysis, 128:200–220.
Gambino, S., Cannata, A., Cannav
`
o, F., Spina, A. L.,
Palano, M., Sciotto, M., Spampinato, L., and Barberi,
ICINCO 2019 - 16th International Conference on Informatics in Control, Automation and Robotics
382

G. (2016). The unusual 28 december 2014 dike-fed
paroxysm at mount etna: Timing and mechanism from
a multidisciplinary perspective. Journal of Geophysi-
cal Research: Solid Earth, 121(3):2037–2053.
Gazeaux, J., Williams, S., King, M., Bos, M., Dach, R.,
Deo, M., Moore, A. W., Ostini, L., Petrie, E., Rog-
gero, M., Teferle, F., Norman, O., German, W., and
Frank, H. (2013). Detecting offsets in gps time series
- first results from the detection of offsets in gps exper-
iment. Journal of Geophysical Research Solid Earth,
118:2397–2407.
Hajian, A., Cannavo, F., Greco, F., and Nunnari, G.
(2018). Classification of mount etna (italy) volcanic
activity by machine learning approaches. Annals of
Geophisics, 61.
Killick, R., Fearnkead, P., and Eckley, I. (2012). Optimal
detection of changepoints with linear computational
cost. Journal of the American Statistical Association,
107:1590–1598.
Lavielle, M. (2015). Using penalized contrasts for the
change-point problem. Signal Processing, 85:1501–
1510.
Liu, B., Dai, W., and Liu, N. (2017). Extracting seasonal de-
formations of the nepal himalaya region from vertical
gps position time series using independent component
analysis. Advances in Space Research, 60:2910–2917.
Mao, A., Harrison, C. A., and Dixon, T. (1999). Daily clear-
ness index profiles cluster analysis for photovoltaic
system. Journal of Geophysical Research, 104:2797–
2816.
Soh, Y. S. and Chandrasekaran, V. (2017). High-
dimensional change-point estimation - combining fil-
tering with convex optimization. Applied and Compu-
tational Harmonic Analysis, 43:122–147.
Williams, S. P., Bock, Y., Fang, P., Jamason, P., Nikolaidis,
R. M., Prawirodirdjo, L., Miller, M., and Johnson,
D. J. (2004). Error analysis of continuous gps posi-
tion time series. , J. Geophys. Res., 109.
Automatic Offset Detection in GPS Time Series by Change Point Approach
383
