
A Data Mining Study on Pressure Ulcers
Francisco Mota
1
, Nuno Abreu
2
, Tiago Guimarães
1
and Manuel Filipe Santos
1
1
Algoritmi Research Centre, University of Minho, Portugal
2
Centro Hospitalar e Universitário do Porto, Portugal
Keywords: Data Mining, Classification, CRISP-DM, WEKA, Pressure Ulcers.
Abstract: Nurses follow well-defined guidelines in order to avoid the occurrence of pressure ulcers (pU) in patients
under their care, not being always successful. This work intends to produce prediction models using Data
Mining (DM) techniques in order to anticipate uP treatment. The work was conducted in the Oporto Hospital
Center (CHP). For the construction of this DM study, the phases of the CRISP DM methodology were taken
into account. In particular, the DM focus is to show that the time factor and frequency of interventions may
influence the prediction of pU classification models. To prove this, we used a data set (containing 1339
records) where different classification techniques were applied using WEKA tool. Through the classification
technique (decision tree), it was possible to create a guideline that contains all the scenarios and instructions
that the professional can use in order to avoid patients to develop pU. For its construction we used the model
that presented a higher percentage of sensitivity (number of positive cases correctly classified as "NO"
developed pU). The conclusions were: the factors studied are good predictors of PU and the guideline
obtained, through automatic techniques, can help professionals apply care to the patient more quickly.
1 INTRODUCTION
Pressure ulcers (pU) are injuries that in addition to
causing enough morbidity and mortality in the
bearers have associated great financial expenses for
the institutions, such as spending on medication,
treatment material, nurses, plastic surgeries, among
others. Taking into account the reasons given, this
study was considered a priority for the Oporto
Hospital Center (CHP) because it will allow
professionals to make the right decisions, to optimize
the response time and to reduce the financial costs
inherent to pU.
This work is focused on obtaining knowledge
about the pU process, using Data Mining (DM)
techniques. Here we will understand the relationship
between the concepts associated with the pU process,
more precisely how the time factor and the frequency
of interventions influence the prediction process of
pU classification models. This will allow automatic
knowledge to be provided to professionals. To study
the influence of these factors different classification
models as Decision Tree and Naive Bayes have been
developed and assessed using evaluation metrics as
Accucary, Precision, Sensitivity and Specificity. In
particular, the decision tree made possible the
creation of a guideline. This guideline contains all the
scenarios and instructions that the professional can
use so that the patients do not develop pU. The
construction of this guideline is based on the rules
(tree branches) that presented a greater percentage
regarding the metric "Sensitivity", because this metric
is related to the number of cases that do not develop
pU. To use these techniques and apply them to the
data set provided by CHP, the Weka tool was used,
not only because it is very intuitive but also because
it produces results in an automatic way. In order for
development to proceed in a structured manner, Cross
Industry Standard Process for Data Mining (CRISP-
DM) methodology was used.
This paper is divided into six chapters:
Introduction; Background and Related Work,
Methods and Tools, Case Study, Discussion and
Conclusion and Future Work.
2 BACKGROUND AND RELATED
WORK
2.1 Pressure Ulcers
Pressure Ulcers (pU) are a localized lesion on the skin
and / or underlying tissue, usually on a prominent
Mota, F., Abreu, N., Guimarães, T. and Santos, M.
A Data Mining Study on Pressure Ulcers.
DOI: 10.5220/0007930002510258
In Proceedings of the 8th International Conference on Data Science, Technology and Applications (DATA 2019), pages 251-258
ISBN: 978-989-758-377-3
Copyright
c
2019 by SCITEPRESS – Science and Technology Publications, Lda. All rights reserved
251

bone, resulting from a combination of frictional
forces (pressure, friction and shear). There are also
some contributing and confounding factors
associated with pU, which, even with advances in
health care, remain unclear as to their role (NPUAP
et al. 2014). These injuries affect the worldwide
population and are a serious public health problem. In
one study it was possible to verify that the increase in
the risk of death for the patients who developed pU is
4.5 times higher compared to the patients who did not
develop it (Brandeis et al., 1990). These lesions have
a major impact on quality of life of the patient and the
respective family. If not treated in advance or in the
most correct way, represented for the health
institution and investors an unnecessary significant
cost (Bennett et al. 2004).
For example, in a study by Bennett et al. (2004) it
was possible to verify that in the United Kingdom the
costs associated with the treatment of the pU took
between: 1,064 pounds to 10,551 pounds. This
difference in prices is due to the different complica-
tions and healing times that vary between categories.
The researchers added that the cost of prevention is 38
pounds per patient, while the cost of treatment is
between 42 and 196 pounds. Converting these amounts
to annual costs, spending is between 1.4 and 2.1 billion
pounds (4% of the national service spending English
National health) (Bennett et al. 2004).
2.2 Data Mining
The health sector is responsible for large amounts of
information, generated on a daily bases in a variety of
ways (diagnostics, diagnostic results, images, records
among others). Due to the large amount of data it
becomes difficult for the human to be able to, through
their cognitive abilities, process that amount of data
and get the most from it without useless information
being wasted (Witten and Frank, 2005). To combat
these aspects and optimize exploitation techniques,
institutions have been investing in the development of
information technologies that allow, through low
level information and in a context of large quantities
obtain high-level knowledge as output and in a more
rapid way emerging the term Knowledge Discovery
in Databases (KDD) (Caetano, 2013). During this
study we will analyze the main responsible for the
process KDD, Data Mining (DM). DM is a process
that uses mathematics, statistics, artificial intelligence
and learning techniques, that is, to intelligent methods
with the objective of identifying useful information
involving them in an algorithm for the extraction and
determination of patterns observed in the data, being
considered one of the essential steps for the discovery
of knowledge (Turban et al., 2007) It is a process that
identifies patterns, relationships, or models implicit in
stored data (Bose and Mahapatra, 2001). In DM there
are two methods, oriented to the discovery, that affect
the choice of algorithms to use. The descriptive
method, also known as unsupervised learning, aims
to understand how the data relate. The predictive
method, supervised learning, have the ability to
through input data, predict future values and return
patterns that form the knowledge discovery easy to
use (Rokach and Maimon, 2005).
2.3 Related Work
In 2018 a Knowledge Based System was developed
on the pU process. This KBS prototype allowed to
transform ambiguous and disorganized information
into treated and organized information in an
automated way, allowing health professionals and
managers to extract knowledge and new perspectives
on the pU in real time. This knowledge is shared
through an interface that has a set of reports generated
from tests performed on concepts associated with pU,
tests of comparison of concepts in different
conditions and general data about concepts related to
pU. This set of reports and general data enabled
health professionals and CHP managers to gain
insight into the pU process and thereby respond to the
needs, situations that CHP professionals and
managers face in their daily lives in real time. This
prototype also allowed the manager to create new
policies or to make more detailed decisions on certain
aspects through shared knowledge, which could mean
that the waste / expense associated with bad decisions
could be reduced. This work resorted to manual rules
of knowledge acquisition. Here in this paper will be
analyzed the same process, however through
automatic knowledge acquisition techniques. The
combination of the tool and the techniques will allow
obtaining relevant knowledge to assist the health
professionals.
3 METHODS AND TOOLS
In order to develop the project as well as possible and
to obtain the best answers to the specific problem, two
methodological approaches were used: Design
Science Research (DSR) and Cross Industry Standard
Process for Data Mining (CRISP DM). DSR is a
research methodology that was used to conduct the
research process, to present the results in a transparent
way and to be very flexible in the follow-up of its
phases (Peffers et al., 2007). The developed practical
DATA 2019 - 8th International Conference on Data Science, Technology and Applications
252

project is inserted in phase 3 of the DSR (“Conception
and Development”). The CRISP-DM is a globally
accepted methodology for this type of projects and is
considered neutral, that is, it is not associated with
any type of technology (Rokach and Maimon, 2005).
CRISP-DM consists of six phases: Business
Understanding, Data Understanding, Data
Preparation, Modeling, Evaluation and Deployment.
Next is described the role of each phase taking into
account the design of this article:
• Business Understanding: Define the problem of Data
Mining and the work plan (techniques, algorithms,
procedures, metrics to be used to evaluate).
• Data Understanding: An exploration of the data
provided by the CHP in order to obtain a familiarity
of the data and to identify anomalies, if there were.
This familiarization made it possible to verify that the
data provided did not fit the objective of the DM
process, nor with the requirements that the techniques
require for the models to be generated.
• Data Preparation: Essential transformations in the
data, so that they were treated and could be used to
achieve the DM goal. The transformations were:
elimination of attributes and creation of new
attributes.
• Modelling: Application of the classification
techniques (Decision Tree and Naive Bayes) to the
final dataset (dataset after the data preparation phase).
The various templates were created in the Weka tool.
• Evaluation: Discussion of the results obtained from
the various models generated, taking into account the
objectives initially drawn.
• Deployment: The DM objective of this study did not
imply the implementation of the process in the CHP.
The tool chosen to execute the various designed
models was WEKA. This open-source tool was
developed in the Java programming language, which
allowed it to run on multiple platforms (Witten and
Frank, 2005). According to Caetano (Caetano, 2013),
this tool in addition to providing a wide range of
techniques, has a set of pre-processing functionality
which is quite captivating to use it because this tool
can mean two in one. This tool has another advantage
that is the fact of providing a graphical interface,
which makes it more intuitive and easier to learn for
the patient who does not yet have experience. This
tool has a particularity that the tool to open the file
has to be presented in ".arff" format. However to
solve this peculiarity, the tool provides a converter (a
comma-separated "csv" file) (P. Ferreira, 2010). The
SQL Server Data Tools tool where new attributes
were created to respond to the DM goal and the
requirements of the techniques used to model the
models.
4 CASE STUDY
4.1 Business Understanding
Given the negative impacts that pressure ulcers (pU)
have, not only on the health status of the patient, but
also at the organizational level (financial expenses
and quality of care), there was a need for the
institution to understand the pU process. Above this,
the objective of this study is to verify how the time
factor and the frequency of interventions influence
the pU process using DM classification techniques.
This study will allow health professionals to be aware
of certain aspects that they did not have due to the
large amount of data inherent in it, helping them to
make a decision and to make a professional more
efficient. To prove this influence of the factors were
created several models in different scenarios. The
results obtained from each model will be compared to
each other, verifying how they influence the
prediction of PU classification models.
4.2 Data Understanding
Those in charge of the CHP provided a file in Excel
format containing the data concerning the pressure
ulcer process. The dataset contains 1339 records and
11 attributes. Table 1 lists the attributes and their
descriptions before performing any transformation in
the dataset. After this data analysis, it was possible to
verify that there were attributes that did not add any
value to the DM goal and the need to create new
attributes so that it was possible to respond to the DM
objective.
Table 1: Variables description.
Attribute Description
INTEPISODIO Single element per person and
representing an inpatient.
DATAHORAADM Date and Time that the patient was
hospitalized.
FENOMENO It is the unique code that identifies
the area being evaluated).
SERVICOID Code of the service in which the
treatment occurred.
STATUS Unique status code
DATAHORADIAG Date and Time the patient was
diagnosed
A Data Mining Study on Pressure Ulcers
253
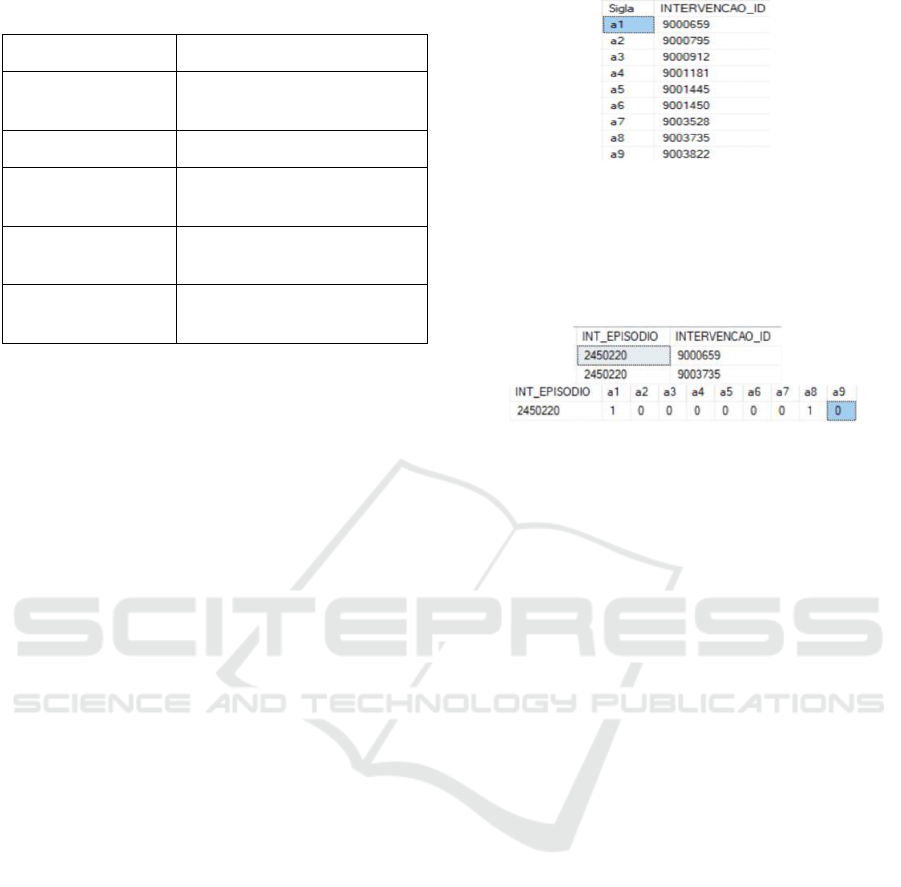
Table 1: Variables description (cont.).
Attribute Description
DATAHORASTATUS Date and Time when you have
been assigned a status
ESPECIFICACAO Designation of the STATUS code
INTERVENCAOID What intervention has been
assigned to the patient
DATAHORAINTER Date and time of execution of the
intervention
IMPLEMENTADA Corresponds to the state in which
the intervention after executed.
4.3 Data Preparation
The preparation of the data occurred in two ways:
elimination of data and addition of new data. The
transformations that were carried out were:
1. Creation of new attributes (DifHora, a1, a2,
a3, a4, a5, a6, a7, a8, a9, DifA1, DifA2, DifA3,
DifA3, DifA4, DifA5, DifA6, DifA7, DifA8, DifA9
e pU);
2. Elimination of data that had no value in the
study to be performed.
Since the objective of the DM process was to
understand how much the time factor and frequency
of interventions could influence the prediction of
pressure ulcer classification models, it was necessary
to adapt the data for this purpose. The first
transformation consisted in the creation of an
attribute called Difhora. This attribute represented the
difference, in hours, between the time of the patient's
status and the date when the same patient was
diagnosed. Being this attribute created, the attributes
DATA_ADM_HORA and DATA_HORA_STATUS
were no longer relevant for the DM study and
therefore were eliminated.
The second transformation, in this phase of
CRISP-DM, had to be with the creation of new
attributes, all coming from the attribute
INTERVENCAOID. This was composed of nine
different types of interventions, which in some cases
were represented more than once in a patient.
Given that, it was necessary to perform an
INTERVENCAOID splitting into sub-attributes (a1,
a2, a3, a4, a5, a6, a7, a8, a9). In figure 1, the acronyms
and the respective INTERVENCAOID are
represented.
This overflow, of the various types of
INTERVENCAOID in columns, allowed verifying
how often these interventions appeared in the patient,
Figure 1: Acronyms and their INTERVENCAOID.
being a factor to study to verify their influence in the
prediction of PU classification models. An example
of the deployment of the INTERVENCAOID
attribute is shown in Figure 2.
Figure 2: Transformation into columns on the frequency of
interventions.
From the INTERVENCAOID attribute, columns
were also created to determine if the time factor of the
interventions to be performed influence the prediction
of pU models. It was also necessary to calculate for
each patient the difference (hours) between the time
of the execution of the first intervention of each
INTERVENCAOID and the time of the status of that
patient. The creation of these columns allowed the
columns DATA_HORA_INTER and DATA_HO
RA_STATUS could be removed from the study.
According to the objective traced to the DM
process, to see how relevant these factors are to the
prediction of classification models, it was created an
attribute called "pU" and consisted of two classes:
“YES” (has a pressure ulcer) and “NO” (does not
have a pressure ulcer). This attribute was the target of
our process. For the creation of the classes, of this
attribute, it was necessary to take into account the
attributes ESPECIFICACAO and STATUS, taking
the classification as follows. All the cases presented
in the specification “pU[…]” was associated with the
class “YES”, those with "no pU" or "high risk of pU"
were associated with the "NO" class. Due to the
relationship between these attributes and the
prediction classes, these two attributes were
withdrawn so as not to harm the results of the models
and compromise the objective of the DM process. The
attributes INT_EPISODIO and SERVICOID also had
to be removed because the number with which the
patient and the service in which the treatment
occurred has no influence on the classes that we are
using. The FENONEMO was also removed since all
DATA 2019 - 8th International Conference on Data Science, Technology and Applications
254

of the 1339 registers are on pressure ulcers.
After this data preparation, these were the
attributes considered relevant to the study, as shown
in table 2.
Table 2: Dataset used for the study in question.
Difhora a6 DifA4
a1 a7 DifA5
a2 a8 DifA6
a3 a9 DifA7
a4 DifA2 DifA9
a5 DifA3 pU
4.4 Modelling
At this stage, different techniques were selected and
applied to obtain the models. Only classification
techniques and metrics were tested. The classification
techniques used in the models were: decision tree and
the Naive Bayes. The choice of the decision tree was
due to the fact that it was a fairly easy technique to
interpret, on the part of the Human Being, and to
provide a detailed explanation of the entire path /
reasoning that was used to reach the classes of the PU
attribute. Another reason for its use was the fact of
having induction rules that, through its interpretation,
made possible the construction of a guideline. The
choice of Naive Bayes was due to the fact that it is a
Table 3: Description of models.
Model
Description
T1 The first test had as objective to generate a
classifier to predict the PU attribute, with all
tributes of the data set.
T2 The second test had as objective to generate a
classifier to predict the PU attribute not making
use of the attribute “Difhora” (time factor).
T3 The third test had as objective to generate a
classifier to predict the PU attribute, however,
the attribute "Difhora" was re-assigned and the
attributes from a1 to a9 (frequency of
interventions) were removed.
T4 The fourth test had as objective to generate a
classifier, however, to study the results of the
model generated without the time factor
relative to the intervention frequencies (DifA1,
DifA2…,DifA9) (time factor).
technique that does not require large computational
requirements. The algorithms used were: J48
(decision tree algorithm) and Naive Bayes. (Rish,
2001) (Bhargava, 2013) After the techniques were
selected, it was necessary to choose in which
procedures the model will be tested and validated. In
this way, we opted for Percentage Split. The
Percentage Split separates the data into two subsets.
By default, of total cases, approximately 66% are
used as a training set. The remaining, approximately
33%, are used as test data in order to evaluate the
performance of the classifiers.
The percentage of sets can change according to
the goals of the modeler.
The scenarios described in Table 3 were
submitted to the classification algorithms, described
above, with the WEKA tool. So the scenarios were
created:
T1: {Difhora, a1, a2, a3, a4, a5, a6, a7, a8, a9, Difa2,
Difa3, Difa4, Difa5, Difa6, Difa7, Difa9, PU}
T2: {a1, a2, a3, a4, a5, a6, a7, a8, a9, Difa2, Difa3,
Difa4, Difa5, Difa6, Difa7, Difa9, PU}
T3: {Difhora, Difa2, Difa3, Difa4, Difa5, Difa6,
Difa7, Difa9, PU}
T4: {Difhora, a1, a2, a3, a4, a5, a6, a7, a8, a9, PU}
The models, when generated, developed a set of
results, being necessary to summarize the results
achieved. For this we used metrics such as Accuracy,
Precision, Recall (True Positive Rate), Specificity
(True Negative Positive).
4.5 Evaluation
Table 4 shows the metrics and their values obtained
by each model. The metrics used were: Accuracy (A),
Recall (R), Precision (P), Specificity (S)
Table 4: DM model results.
Decision Tree
T1 T2 T3 T4
A 0.8308 0.7099 0.8 0.7868
P 0.809 0.684 0.755 0.785
R 0.843 0.722 0.856 0.759
S 0.820 0.699 0.749 0.812
Naíve Bayes
T1 T2 T3 T4
A 0.5209 0.5275 0.5165 0.5560
P 0.475 0.513 0.441 0.597
R 0.088 0.093 0.069 0.199
S 0.912 0.921 0921 0.879
A Data Mining Study on Pressure Ulcers
255
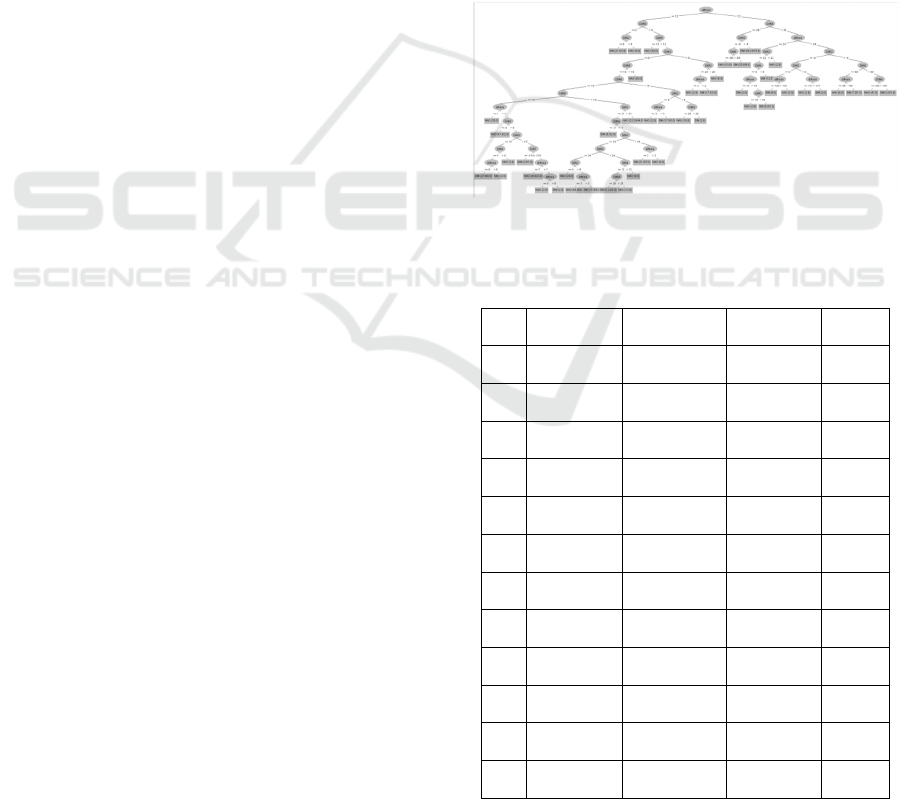
Table 4 shows that the time factor (t2 and t4) and
the frequency factor of interventions (t3) had an
influence on the prediction of the PU attribute. The
comparison of the results of the different scenarios,
described below, was in accordance with the results
obtained in the Percentage Split procedure.
The model t2, without the information related to
the attribute "Difhora”, presented a global
performance, that is, an acuity about 70.99%, while
the t1 model presented an acuity of 83.08% using the
same procedure. As for precision, there was also a
difference between the results, while t1 presented a
rate of 80.9%, when the time factor is taken from the
data set it is possible to verify that this rate fell to
68.4%. This decrease of 12.5% means that the
effectiveness of returning more relevant information
decreases. To strengthen this study, we verified the
sensitivity metric, which represents the rate relative
to the true positive cases classified correctly, that is,
cases related to the class "NO". The sensitivity of t1
to t2 decreased by about 12.1%, which means that the
number of cases of misclassification under the "NO"
class increased. This incorrect classification did not
only occur in the "NO" class, but also in the "YES"
class (Specificity).
Regarding t3, frequency of interventions, there
were some influences. In the acuity metric there was
not such a significant drop, more precisely a decrease
of about 3.1%. The precision showed a decrease of
5.4% relative to t1. However, with the withdrawal of
attributes associated with the frequency of
interventions, the sensitivity showed an increase in
the number of cases correctly classified as "NO". This
increase was not reflected in cases correctly classified
as "YES", specificity, having decreased by 7.1%.
The results of the t4 model compared to the results
of the t1 model (all attributes) presented a difference
in the obtained results, that is, the attributes extracted
from the model have a direct influence on the
prediction of classification models. In terms of acuity,
the difference between the two acuities was 4.4%, the
smallest percentage being t4 with 78.68%. Accuracy
and sensitivity also declined in relation to t1, about
2.4% and 8.4% respectively. The two cases
incorrectly classified in the "YES" represents a
difference of 0.8% in the specificity from t1 to t4.
The technique "Decision tree", one of the
techniques used to perform the modelling, uses the
rules of induction to demonstrate the path / reasoning
/ standards that the algorithm J48 used to reach the
prediction of the two defined classes, class “NO” and
“YES”. Through these rules it was possible to build a
guideline. This guideline contains all the scenarios
and their instructions that the professional can use so
that the patient does not develop PU, that is, it
contains all the scenarios that had as leaf the class
"NO". For the creation of the guideline the induction
rules generated from the best model (t1) were not
used, but from t3, since this last test presented a
higher sensitivity percentage (a greater number of
cases of class "NO" classified correctly).
In the figure 3 we can observe the rules generated
by the algorithm J48, in which the two possible
classifiers ("YES" and "NO") are found in their leaves
and all possible paths.
Using these rules and their content it was possible
to build the guideline. This guideline was built in
table format. This table consists of scenarios that
health professionals can use, so that the patient does
not develop pressure ulcers, that is, all the scenarios
presented as a leaf, the class "NO”. In the table 5 only
12 scenarios are represented.
Figure 3: Decision tree and its rules of induction.
Table 5: Scenarios and their instructions to reach the class
“NO”.
# Difhora DifA2 DifA3 DifA4
1 <=12 >0 - -
2 <=12 - - -
3 <=12 - <=6 -
4 <=12 - >20 -
5 <=2 - >6&<=20 -
6 <=12 >8&<=28 <=6 -
7 <=3 <=8 <=6 -
8 <=12 >21 <=6 -
9 >2&<=12 >19&<=21 <=6 -
10 <=12 <=19 <=6 >12
11 <=12 <=19 <=6 <=12
12 <=12 <=9 <=6
DATA 2019 - 8th International Conference on Data Science, Technology and Applications
256

Table 5: Scenarios and their instructions to reach the class
“NO” (cont.).
# DifA5 DifA6 DifA7 DifA9
1 - - - <=0
2 - - - >0&<=12
3 - >19 - >12
4 - - - >12
5 - - - >12
6 >15 <=19 - >12
7 >15 <=19 - >12
8 <=15 <=19 - >18
9 > -3&<=15 <=19 - >18
10 > -3&<=15 <=19 >24
11 > -3&<=15 <=19 >28
12 > -3&<=15 <=19 >18&<=24
To enable the professional to interpret the
guideline correctly a brief explanation of how reading
works was given. For each scenario, the attributes and
respective conditions that need to be taken into
account are indicated, in order to direct the
professional to the class "NO". Attributes that were of
no importance to the scenario were represented by a
hyphen "-". Let's look at scenario 1, 2 and 3 that are
in table 7. The professional in scenario 1, in order to
direct the care of the patient to the non-development
of the PU, must take into account the following care:
Difhora (difference between the date of admission
and status) must be less than or equal to 12 hours. If
the "A2" and "A9" intervention is assigned to the
patient, the professional must perform the
interventions so that the difference between the time
of intervention and the time of status: in A2 is greater
than 0 (DifA2 > 0) and "A9" is less than or equal to 0
(DifA9 <=0). However, scenario 2, informs the
professional that: Difhora has to be less than or equal
to 12 hours. If only the "A9" intervention is given to
the patient, the professional must perform the
intervention so that the difference between the
intervention time and the status time is between 0 and
12 hours (0<DifA9 <=12). Finally, scenario 3 already
involves more attributes and tells the professional:
Difhora has to be less than or equal to 12 hours. If the
patient is assigned the intervention "A3", "A6" and
"A9", the professional must carry out the
interventions so that the difference between the time
of intervention and the time of intervention in
intervention A3 does not exceed 6 hours (DifaA3 <=
6), on A6 must be greater than 19 hours (DifaA6 >
19) and A9 has to be between the range 0 and 12
(0<DifA9>12).
This guideline, obtained through the techniques of
automatic learning, allowed the health professionals
to obtain knowledge about how they should act in
certain situations regarding pressure ulcers. This
knowledge of an automatic nature could allow
decision making, at critical moments, to be the most
accurate, guiding the care of the patient in the right
way, so that the costs associated with PU can no
longer exist.
5 DISCUSSION
It was established that the main focus was to study the
influence that certain concepts associated with the pU
process could have on the prediction of classification
models. Given this objective it was necessary to
construct classification models for the different
scenarios and to evaluate them based on the metrics
associated to the classification models: Accuracy,
Sensitivity, Specificity and precision. The evaluation
of the models was carried out in the "Evaluation"
phase of the methodology CRISP-DM. In this
evaluation it was possible to prove that both the time
factor and the frequency of interventions have
influence on the pU classification models. In order to
identify the influences that these factors have on the
models and to verify the best model, it was necessary
to define which metrics CHP considers most relevant.
For CHP it was important to combine sensitivity and
acuity, and to have acceptable percentages.
Regarding sensitivity, this refers to the number of
correctly classified "NO" cases. Accuracy is the
ability to correctly classify instances, either for cases
associated with the "NO" class, or for cases
associated with the "YES" class. Considering the
CHP priority metrics and analyzing the results of the
four scenarios produced, it was possible to state that
the best model is test1 (consisting of all attributes).
The test1 presented an acuity of 83.09%, test 2
(dataset without Difhora) presented 70.09%, test 3
(dataset without the frequency of the interventions)
presented 80% and test 4 (without the time factor of
the interventions) 78.58%. Regarding sensitivity, test
1 presented a percentage of 84.3%, test 2 of 72.2%,
test 3 of 85.6% and test 4 75.9%. Test 3 had a higher
percentage of sensitivity than test 1. If we analyze test
3, we could verify that there was an increase of
correctly classified cases related to class "NO",
A Data Mining Study on Pressure Ulcers
257

however, the correctly classified cases for the "YES"
class decreased by about 17 (the Specificity decreases
about 7.1%), which makes the institution if this model
is used, would get less knowledge about the measures
that must be taken to avoid them pU. For the
construction of these models we used the "decision
tree" technique, not only because it is easy to
understand the results obtained, but also because it is
a technique that is governed by the induction of rules.
The induction of rules allowed us to understand, what
the reasoning that the decision tree algorithm (J48)
used to predict the defined classes (“YES” e “NO”).
Through these rules it was possible to construct a
guideline to help health professionals to act in
situations where the pU process is the focus of the
problem. This guideline only included the scenarios
and their instructions of the rules that presented as a
sheet the class "NO”, that is, instructions that,
according to the algorithm, must be performed so that
the patient does not develop pU. In order for the
guideline to be composed with the maximum possible
scenarios and instructions, it was necessary to use the
model that presented a higher percentage of
sensitivity. Through the results obtained from the
various scenarios it was possible to conclude that the
guideline should be constructed taking into account
the rules of the mode l 3.
The construction of this guideline provided health
professionals with useful scenarios. These scenarios
allowed the decision-making process more
streamlined, resulting in a more accurate decision and
at the critical moment when the problem arose. The
guideline has a great focus on the prevention of pU.
Thanks to this importance given to the prevention of
pU and the care (instructions) that are necessary to do
so that pU is not developed, if it is implemented in
real time in CHP, will ensure that the number of pU
treatments is reduced, and with that the expenses
inherent to these treatments cease to exist.
6 CONCLUSIONS AND FUTURE
WORK
To conclude, it is important to mention how health
institutions can benefit from the use of data Mining.
The results obtained in this work can be easily applied
in order to avoid pressure ulcers. The rules of model
3 can be used to improve the quality of the service
and saving costs. Further work includes the
implement the last phase of CRISP-DM into a
decision support system.
ACKNOWLEDGEMENTS
This work has been supported by FCT – Fundação
para a Ciência e Tecnologia within the Project Scope:
UID/CEC/00319/2019 And by the project Deus Ex
Machina: NORTE-01-0145-FEDER-000026,
supported by Norte Portugal Regional Operational
Program (NORTE 2020), under the PORTUGAL
2020 Partnership Agreement, through the European
Regional Development Fund (ERDF).
REFERENCES
NPUAP, EPUAP and PPPIA. Prevention and Treatment of
Pressure Ulcers: Quick Reference Guide. Emily
Haesler (Ed.). Cambridge Media: Perth, Australia;
2014.
G. H. Brandeis, J. N. Morris, D. J. Nash, and L. A. Lipsitz,
“The Epidemiology and Natural History of Pressure
Ulcers in Elderly Nursing Home Residents,” JAMA,
1990.
G. E. Bennett, C. A. D. Ealey, and J. O. H. N. P. Osnett,
“The cost of pressure ulcers in the UK,” vol. 33, no. 3,
pp. 230–235, 2004.
I. Witten and E. Frank, Data Mining: Practical Machine
Learning Tools and Techniques with Java
Implementations. Morgan Kaufmann, 2005.
N. Caetano, “Previsão de tempos de internamento de
pacientes via técnicas de Data Mining,” 2013.
E. Turban, J. E. Aronson, and T.-P. Liang, “Decision
Support Systems and Business Intelligence,” Decis.
Support Bus. Intell. Syst. 7/E, pp. 1–35, 2007.
I. Bose and R. K. Mahapatra, “Business data mining - a
machine learning perspective,” 2001.
L. Rokach and O. Maimon, Data Mining and Knowledge
Discovery Handbook, 2nd ed. Springer US, 2005.
K. Peffers, T. Tuunanen, M. A. Rothenberger, and S.
Chatterjee, “A Design Science Research Methodology
for Information Systems Research,” J. Manag. Inf.
Syst., vol. 24, no. 3, pp. 45–77, 2007.
P. Ferreira, “Aplicação de Algoritmos de Aprendizagem
Automática para a Previsão de Cancro de Mama,”
2010.
Rish, Irina. "An empirical study of the naive Bayes
classifier." IJCAI 2001 workshop on empirical methods
in artificial intelligence. Vol. 3. No. 22. 2001.
Bhargava, Neeraj, et al. Decision tree analysis on j48
algorithm for data mining. Proceedings of International
Journal of Advanced Research in Computer Science
and Software Engineering, 2013, 3.6.
DATA 2019 - 8th International Conference on Data Science, Technology and Applications
258
