
Advantages and Difficulties of using Spatial Enablement to Support
Public Health in Cities: The PULSE Case Study
Daniele Pala
1
, Marica Teresa Rocca
2
and Vittorio Casella
2
1
Department of Electrical, Computer and Biomedical Engineering, University of Pavia, Pavia, Italy
2
Department of Civil Engineering and Architecture, University of Pavia, Pavia, Italy
Keywords: Public Health, Spatial Enablement, Asthma, Regression, Big Data.
Abstract: Big cities are heterogeneous environments in which socioeconomic and environmental differences among the
neighborhoods are pronounced, therefore research projects that aim at informing public health policies at a
single city level are being developed. Since most of public health data is referred to some geography, spatial
enablement plays a fundamental role when it comes to analysis and visualization of urban health data. The
PULSE project, part of the EU Horizon 2020 framework, involves five cities to transform public health from
a reactive to a predictive system, and promote wellbeing by developing an integrated data ecosystem based
on continuous large-scale collection of information, leading to better-informed data-driven health policy. One
of the goals of PULSE is to apply spatial enablement to generate statistics useful to asses public health at a
high spatial resolution, allowing to organize interventions at a neighborhood level. In this paper, we present
a preliminary spatial enablement study carried out in this context, in which we show opposite sides of its
application: while the results are promising, the lack of standardization and protocols in the data collection
and representation processes make spatial enablement very difficult to apply to open data.
1 INTRODUCTION
The percentage of the world’s population living in
urban areas is projected to increase from 54% in 2015
to 60% in 2030 and to 66% by 2050 (United Nations
and Department of Economic and Social Affairs,
2014). It is important to acknowledge that big cities
are perfect labs for innovation aiming at managing
demographic and epidemiological transitions (WHO,
2016). Big cities are heterogeneous environments
where social, environmental and demographic
conditions can vary significantly within relatively
small distances. For this reason, studies aiming at
improving health and wellbeing in the urban areas
have to address the problem at a neighborhood level,
taking into account the underlying spatial variability.
In line with this principle, the international project
named Participatory Urban Living for Sustainable
Environments (PULSE) has been funded by the EU
Commission under the Horizon 2020 framework to
undertake research and innovation in big cities in
Europe, the United States and Asia. PULSE is
partnering with five important cities – Barcelona,
Birmingham, New York, Paris and Singapore – and
has two main focuses: the link between air quality and
asthma, and the one between physical inactivity and
type 2 diabetes. PULSE aims at providing effective
solutions to prevent and treat these diseases through
an innovative data integration platform, where data
will be collected directly from the users/citizens,
enrolled in each of the five cities, through a mobile
App, and from open data sources and air quality
sensors. PULSE aims also at involving public health
authorities directly. Besides the App, the PULSE
system features also an innovative WebGIS that
allows data visualization, a Decision Support System
that allows to analyze the data, runs predictive models
and sends notifications and advice directly to the
users, and dashboards to help public health authorities
visualize the situation in the city and design proper
interventions.
One of the key features of the PULSE system, is
the so-called spatial enablement, i.e. the addition of a
spatial description to a dataset and/or an analysis
procedure. Most of the data regarding public health
has a natural spatial reference, since demographic
data is collected considering areas of residence of the
population, and environmental measurements clearly
depend on the geographical zone they are referred to.
Although the concept of spatial enablement is not
322
Pala, D., Rocca, M. and Casella, V.
Advantages and Difficulties of using Spatial Enablement to Support Public Health in Cities: The PULSE Case Study.
DOI: 10.5220/0007900003220329
In Proceedings of the 5th International Conference on Geographical Information Systems Theory, Applications and Management (GISTAM 2019), pages 322-329
ISBN: 978-989-758-371-1
Copyright
c
2019 by SCITEPRESS – Science and Technology Publications, Lda. All rights reserved

new, studies that address this topic in urban
environments, breaking down the problem to a
neighborhood wellbeing study, are not common in
literature. Some studies focusing on urban areas have
been carried out, but they generally analyze the whole
city or use broad spatial subdivisions. In the PULSE
context, we seek to study public health problems in
urban contexts at a fine spatial resolution, considering
all the characteristics of each single neighborhood.
Spatial enablement methods are promising both
for analysis and visualization matters, but their
application is generally quite complicated due to a
diffuse lack of standards and regularization in the data
collection process. Data regarding demographic,
socioeconomics, environment and air pollution, when
available, is often collected by different public and
private entities, that apply different collection
procedures and storage standards, making it long and
uneasy to retrieve and process all the data.
In this paper, we present as case study a series of
analyses we carried out within the PULSE project
using almost uniquely open data, in particular we
applied a spatial enabled method called
Geographically Weighted Regression (GWR) to a
combination of datasets referred to New York City,
with the aim of investigating the link between asthma
hospitalizations and several socioeconomic and
environmental factors.
After a brief presentation of the methodology and
the results, explained in detail in another paper that is
currently under review, we focus also on the
difficulties that we encountered during our analyses,
highlighting the need of a better-defined system in the
data collection and storage processes in the public
health environment.
2 MATERIALS AND DATASETS
PULSE is characterized by a complex architecture
that allows an intense data flow through several
different integrated systems. The main components of
this architecture are:
The Pulsair App for smartphone, through which
users can send their data and position, and receive
personalized feedbacks concerning their
condition in relation to the situation in their city;
Backend analytics and a Decision Support
System, that apply big data methods to analyze the
input data and use predictive risk models, in order
to eventually generate feedbacks for the users;
Dashboards that allow the public health policy
makers to inspect the situation in different neigh-
borhoods and organize proper interventions;
A large and innovative WebGIS that allows to
visualize all the data on maps and quickly spot the
main features and criticalities in the studied cities.
Since the geographical description of health-related
phenomena is at the base of PULSE, the WebGIS
could be considered the most interesting architecture
element in the project, as it collects and integrates a
large wealth of spatially-enabled data.
In line with the PULSE principle, and to start
investigating its applications and extensions, we
carried out a preliminary spatial enablement study
using some open data currently integrated in the
PULSE WebGIS.
2.1 A Data Integration Example: New
York City
While the PULSE system is still in a development
phase and the WebGIS is expected to be complete by
the spring of 2019, a lot of data integration, modeling
and analysis is already being carried out with data
coming from the five cities. In particular, thanks to its
peculiar data availability, we developed a large
WebGIS prototype of New York City, and performed
some preliminary analyses on it, in order to
demonstrate the importance of spatial enablement in
studying public health in cities and the usefulness and
innovation of PULSE.
Several sources of data have been used to carry
out the analyses reported in this paper. Most of the
data has been kindly provided to the PULSE
consortium by The New York Academy of Medicine.
We used socioeconomic data freely available in the
NYC Neighborhood Health Atlas website (“New
York City Neighborhood Health Atlas,” n.d.), from
which it has been downloaded. The hospitalization
and ED visit rates data, as well as the PM2.5 historical
data, has been downloaded from the NYC
Environmental & Health Data Portal(“Environment
& Health Data Portal,” n.d.). Information regarding
age and race of hospitalized people has been acquired
from the SPARCS(“Statewide Planning and Research
Cooperative System,” n.d.) limited 2014 dataset.
2.2 Geographically Weighted
Regression
The collected datasets were analyzed through
Geographically Weighted Regression (GWR)
(McMillen, 2004), that is a linear regression model
with the addition of a weight that provides a spatial
description.
Advantages and Difficulties of using Spatial Enablement to Support Public Health in Cities: The PULSE Case Study
323

Given a dependent variable and one or more
explanatory one,
, known for an adequate number
of observations, which can be represented by points
,
, a regular linear regression is characterized by
a set of equations that can be represented in the vector
formalism
(1)
where
contains the actual measurements of and
the vector is composed by the unknown
coefficients
. Its estimation is usually performed by
a minimum problem; the minimized quantity is the
squared norm of the difference between the observed
values of
and those given by the model:
≔
(2)
The depicted solution can be generalized by
introducing a weight, thus giving each observation a
different relevance
≔
(3)
GWR uses the above defined method to take into
consideration spatial variability. In a common GIS
layer with polygon representation of an environment,
each polygon corresponds to an observation, located
in its centroid. The studied area can be overlapped
with a set of regularly-spaced dots. For each dot, a
distinct regression is calculated, in which the
observed values for the dependent and explanatory
variables are the same, but the weights change. In our
case, the weight function is
(4)
where
is the distance between the considered dot
and the i-th centroid and s is a threshold,
corresponding in our case to 5 km. In our study, we
overlapped to the NYC map a grid of points distant 1
km from each other.
3 RESULTS
As mentioned in section 1, the complete results of our
spatial enablement study are presented in another
paper, currently under final review. In this section
however, we present a brief extract of the results to
show the power of spatial enablement and how
promising these methods are.
In our study, we investigated the relations among
asthma hospitalizations and several socioeconomic,
demographic and environmental factors in the
different neighborhoods of New York City. The
factors we considered were PM2.5 and ozone
concentration, percentage of land used for industrial
activities, poverty rate, race, age, medical insurance
and garbage recycling. Both univariate and
multivariate analyses have been carried out.
3.1 Univariate Analysis
In the first step of our analysis, we considered each
variable individually and ran the geographic
regression model to inspect its relation with the
hospitalization rate, and how this varies in the
different zones of the city.
As an example, figure 1 reports the result of this
algorithm applied using poverty rate as covariate,
showing a map of the
coefficients (left side) and
one of the
scores (right side) in each point in
which the regression is calculated. It can be easily
noticed that, although there is general positive
relation between high poverty and higher
hospitalization rates, this relation changes throughout
the city, sometimes importantly. In this example, as
in most of the poorer areas of the city (i.e, the Bronx
and the inner border between Brooklyn and Queens)
the hospitalization rate is high, there are some areas
in which the relation is not as strong, as it becomes
even unreliable in south-west Brooklyn and East
Staten island. This highlights the importance of
studying public health problems at a granular spatial
resolution, in order to spot all the possible relations.
We obtained similar results testing also all the
other covariates. As a general rule, socioeconomic
and demographic variables appear to be more related
to hospitalizations than air pollution, but this could be
due to the lack of measurements taken in a proper
time frame, that forced us to use averaged data. All
factors anyway showed a different level of influence
in different areas of the city.
3.2 Multivariate Analysis
We also performed GWR testing several covariates at
the same time in a multivariate model, that has the
advantage of being able to ease the comparison of the
effects of different variables, allowing to spot
outliers, confounders and relations between different
factors. In this section, we show an example of
multivariate GWR that combines poverty rate and
percentage of people identifying as Black and
Hispanic. The underlying model can be described by
the following equation, valid for each point where the
GWR is performed:
∗
∗%
∗%
HGIS 2019 - Special Session on GIS in Healthcare
324
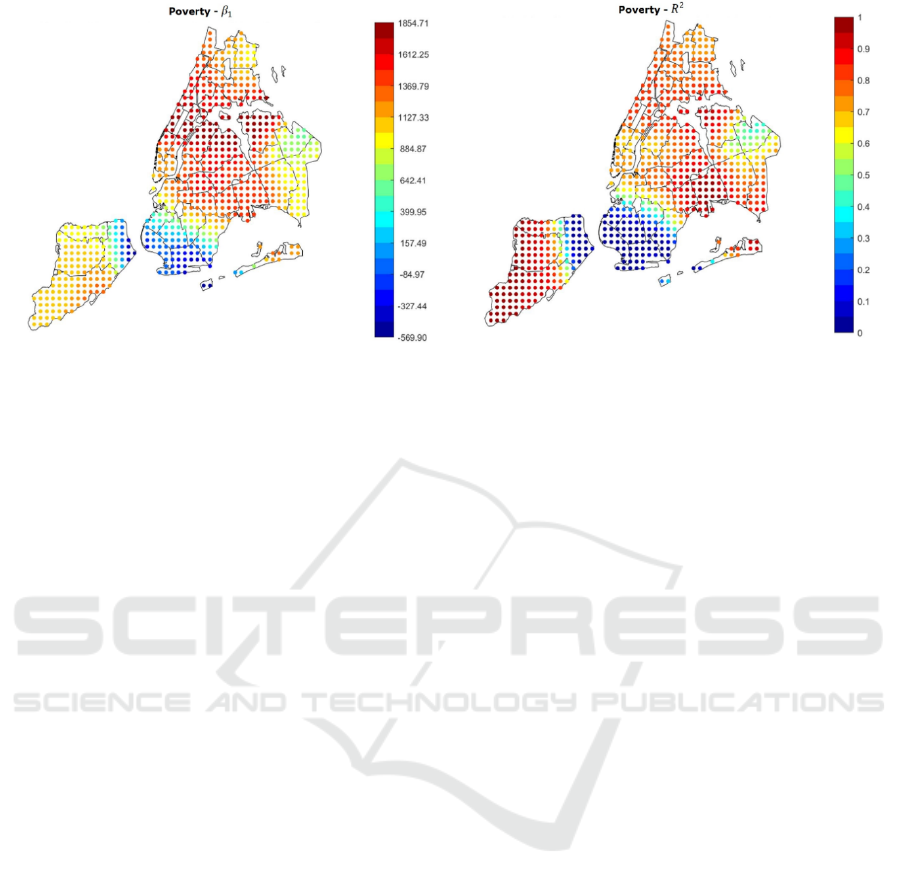
Figure 1: Results of the GWR algorithm using the poverty rate as covariate. On the left side a map of the
coefficients
calculated in all the points in which the regression is performed is visible; on the right side, a map of the
scores is shown.
Where stands for “hospitalizations”,
stands for “poverty” and and for “Black” and
“Hispanic” respectively.
Race/ethnicity is known to be related to asthma
(Litonjua et al., 1999). Several studies suggest that
Black and Hispanic residents in the USA tend to
suffer from higher rates of asthma as they live in
poorer areas close to industrial sites and large
highways (Clark et al., 2017).
Results are visible in figure 2. On the left side of
the image, maps of the β coefficients are shown,
whereas panels in the right side show correspondent
significance maps based on the t-statistic values. In
detail, we created 3 significance levels: Non-
Significant (NS), Partially Significant (PS),
Significant (S), based on the t-statistic threshold
values 1.96 (5% confidence level) and 2.58 (1%
confidence level). Several interesting phenomena can
be noticed:
is extremely high in all the region (> 0.7, image
not shown), therefore the linear model is globally
reliable;
Considering poverty and percentage of Black
population, the correspondent are always
positive, indicating a positive correlation between
either of these factors and the hospitalization rate;
In general, the higher the , the higher the level of
significance. Therefore, in the neighborhoods in
which we found that high variables’ levels lead to
high hospitalization rates, the found relations are
significant;
Low significance levels could be due to the effect of
other confounding variables and to a smaller quantity
of data available. For instance, looking at the
percentage of Hispanic people (image not shown), it
can be noticed that most of the Hispanic population is
concentrated in the Bronx, Upper Manhattan
(Harlem, East Harlem and Washington Heights), in
central and west Queens and some areas of east
Brooklyn (Bushwick and south of Highland Park),
plus some isolated spots in west Brooklyn (Sunset
Park) and north Staten Island. Apart from these last
isolated spots, in the same areas in which the
concentration is higher, also the significance of the
correspondent beta is high. Hence lower significance
corresponds to higher scarcity of data.
These results show that even multivariate
geographical analysis can be helpful to describe and
visualize important public health phenomena and
discover the relations among different factors.
4 COMPLICATIONS
As promising as spatial enablement is, its application
to an urban health problem is not easy. Large cities
such as New York are sources of enormous quantities
of heterogeneous data, that are by definition difficult
to process as they differ in typology, dimension,
scale, collection method etc.
Moreover, public health agencies have not yet
defined standards and harmonization methods to ease
the process of analyzing the huge quantity of data
collected. Within PULSE, we are experiencing longer
than expected processing times for all the cities due
to the same problem. In this section we present a case
study upon NYC data used for our GWR study, that
shows some examples of the typical problems
encountered during these kinds of protocols.
Advantages and Difficulties of using Spatial Enablement to Support Public Health in Cities: The PULSE Case Study
325
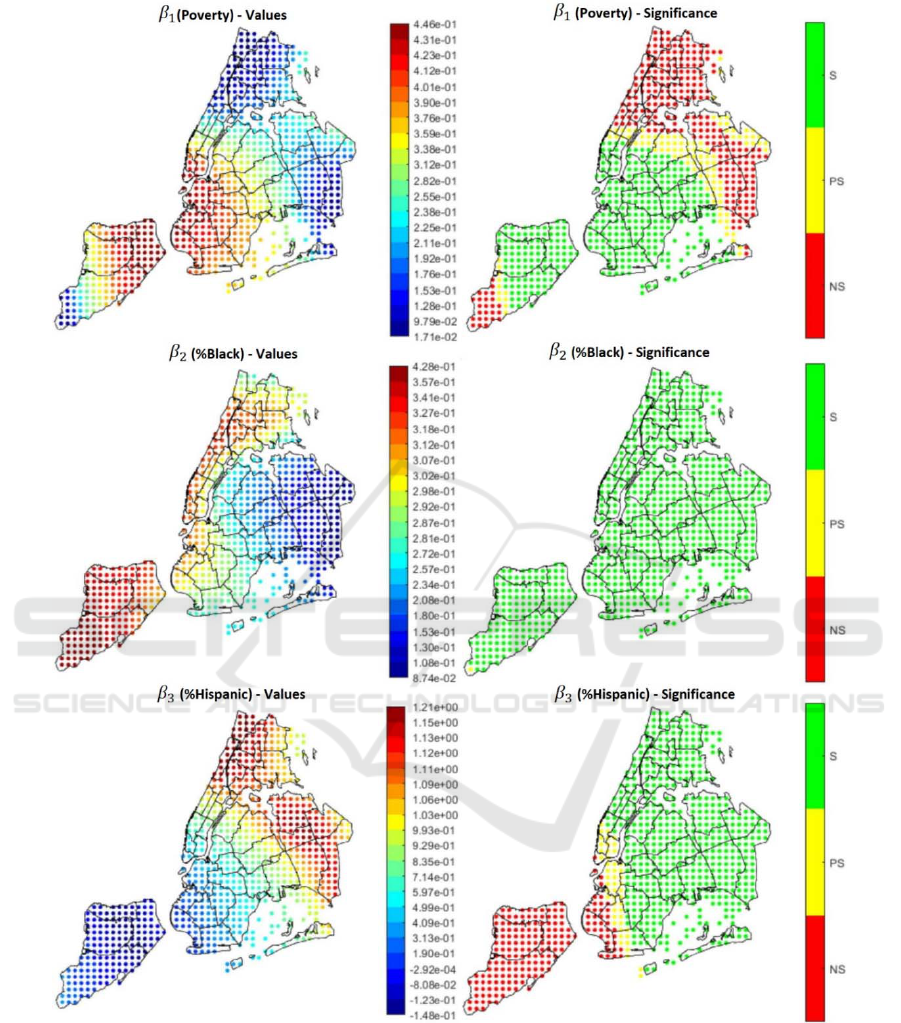
Figure 2: Results of the multivariate model. On the left side, the regression coefficients; on the right side, the correspondent
significance level, based on the confidence intervals.
4.1 Conventional Spatial Subdivisions
New York City has a very large amount of open data
available regarding all different aspects of the
population and the environment. Other data is
available upon request and/or purchase to the State’s
public health departments.
Public health data is collected with reference to
several different spatial subdivisions in NYC, that
are:
Boroughs: 5 polygons correspondent to the main
HGIS 2019 - Special Session on GIS in Healthcare
326

districts of the city (Bronx, Brooklyn, Manhattan,
Queens, Staten Island);
UHF34 (United Hospital Fund), with 34
polygons;
UHF42, 42 polygons;
CD55 (Community Districts), with 55 polygons;
CD59, 59 polygons;
CD71, 71 polygons;
PUMA (Public Use Microdata Areas) 55
polygons not overlapping with the CD55
subdivision;
NTA (Neighborhood Tabulation Areas), 195
polygons;
ZIP Codes, 262 polygons.
Once imported in a GIS software and visualized on
maps, none of the polygons in one subdivision has
vertices that can be overlapped to the ones of any
other subdivision. This poses a problem when it
comes to analyze data from multiple sources, since
different kinds of data are collected referred to
different subdivisions. A harmonization algorithm is
therefore necessary. For instance, in our GWR
application we decided to adopt the UHF42
subdivision, as most of the data was already available
in this spatial description. All the data available in
another tessellation was transformed through the
following algorithm: let’s consider a polygonal
subdivision for which a certain variant is available,
for each polygon
, the variant value v
is known. If
we consider another polygon
, belonging a
different subdivision, in general it won’t coincide
with any
and, instead, will overlap to several of
them. The estimated v
can be obtained by the
weighted sum
∑
∑
(5)
where
is the area of the intersection between
and
and the summation is only performed over the
polygons for which the intersection is non-empty.
This means that the value of a certain phenomenon in
any spatial subdivision can be represented in the
UHF42 one constructing each polygon as the sum of
the same value in the other subdivision, weighted for
the overlapping area.
4.2 Geometric Consistency
Most of the public health data, both openly available
and provided by the public health agencies is
generally in tabular form rather than in shapefiles,
making it necessary to create the shapefiles by joining
the tables with pre-existing polygons. In the NYC
open data, however, several indicators are already
represented in shapefiles. In our study, and during the
acquisition of data to be integrated in the PULSE
WebGIS and system, we used several shapefiles, and
found that lots of them contain errors or imprecisions.
For example, taking two different shapefiles
representing data on the same spatial subdivision and
overlapping them, we could notice that some of the
polygons’ border didn’t overlap properly, showing an
offset between the two shapes in some areas of the
map. Figures 3 and 4 show some examples.
Figure 3: Detail of two shapefiles representing the same
area of the city. It can be noticed that some polygons have
a visible offset with the same polygons of other shapefiles.
Figure 4: Another clear example of two shapefiles not
properly overlapping. In this case, some little islands in the
Rockaway area are entirely absent from one of the two
shapes.
A similar problem was found in relation to some
Advantages and Difficulties of using Spatial Enablement to Support Public Health in Cities: The PULSE Case Study
327
uninhabited areas of the city, such as Central Park and
JFK and La Guardia airports, that were marked as
holes in some shapefiles, and represented as polygons
in others. To overcome these multiple problems, it
was necessary to manually modify the shape of the
polygons, creating a serious waste of time and
resources. This phenomenon is shown in Figure 5.
Figure 5: In this overlap of two shapefiles, it can be clearly
seen that Central Park and the areas with the two airports
within the city border (JFK and La Guardia) are treated as
holes in one of the shapes, but not in the other.
4.3 Tabular Data Problems
Besides all the difficulties encountered with the
shapefiles, also the more common tabular data,
typically found in xls or csv formats, had some issues
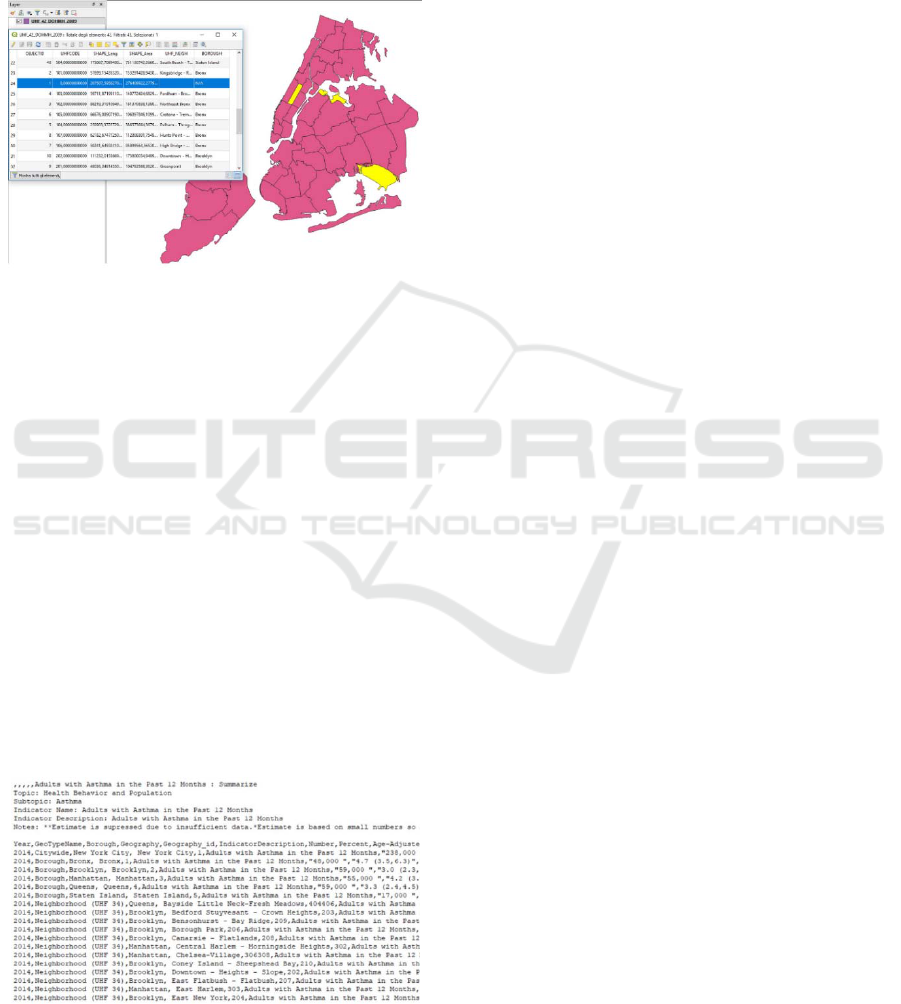
we had to deal with. Figure 6 shows an extract of a
typical table representing health data in NYC. Several
things can be noticed, for example the key “1”, used
to indicate the geographical area of reference and
necessary to match this table with other tables, is used
both referred to the whole city and to the borough of
the Bronx. Moreover, in this table the comma sign is
used in multiple different ways, as it simultaneously
represents the thousands separator, the column
delimiter and the item delimiter inside the brackets
showing confidence intervals.
Figure 6: Example of tabular data found in public health
open data sources. The way data is represented makes the
import and processing part very complicated.
Such features are confusing and make it very
difficult to import the data and analyze the table with
a software. The difficulties rise considering that in the
integration of several health data sources, a researcher
usually has to deal with a large number of tables not
different from the one shown in this example.
5 DISCUSSION
With the continuous development of sophisticated big
data analytics and the technological progress, both the
quantity of data that can be collected and the
collection velocity are rapidly increasing in several
applications of the medical research. One of the most
rapidly developing fields of research is indubitably
exposomics, i.e. the study of the combination of
factors to which an individual is exposed during a
certain amount of time that can cause a change in
his/her phenotype regarding a specific pathology.
During our life, we are exposed to an enormous
quantity of phenomena that can influence our health.
Since exposure depends on location, spatial
enablement is gradually becoming necessary in
public health analyses.
In this paper, we briefly presented the PULSE
project and explained how it intends to apply spatial
enablement in its most innovative form, then we
showed a case study, carried out within PULSE, in
which we applied a spatial analysis technique that
allowed us to show how public health could benefit
from spatial enablement in big cities. In our study we
considered asthma hospitalizations as an easy to
monitor outcome of a series of exposures which every
citizen is exposed to involuntarily, and we aimed at
looking at how these factors could influence the
impact of a common disease such as asthma. The
application of these techniques in the public health
field allows to increase the awareness of the health
problems in cities and therefore to take better
informed decisions on how to intervene, making
interventions more targeted and leading to a cost
reduction for public improvements and healthcare
assistance.
The final aim of PULSE is to create a protocol,
tested in five cities but eventually extendable to
potentially any city, in which public health policy
makers are supported by specific entities, called
Public Health Observatories (PHO), that help them in
the data interpretation and decision-making
processes.
PULSE has been funded by the European
Commission, but involves several institutions from
all the world with the common aim of promoting
HGIS 2019 - Special Session on GIS in Healthcare
328

public health and wellbeing by creating a system that
can be extended in ideally all the big cities. The
system is being tested in 7 cities – Barcelona,
Birmingham, Paris, Pavia, New York, Keelung and
Singapore – and data is being collected in those cities
both from the system itself and from outside sources,
thanks to the cooperation with the local public health
authorities, that will help providing data and
deploying the system in a way that makes it adaptable
to each city’s environment and legal limitations.
Unfortunately, the capability of quickly collect
and analyze rising quantities of data is developing
without enough regularization and awareness from
the public health authorities, leading to a constantly
increasing quantity of unorganized, chaotic data,
difficult to import and analyze without accurate
supervision. What we showed in this paper is just a
sample use case of a diffuse problem in big data
studies with public health focuses. Data
harmonization and preprocessing are often time-
consuming tasks, and this could be changed with the
introduction of standardization protocols in the data
collection within the same areas.
Despite municipalities and public organizations
in large cities are moving forward in the right
direction in increasing the quantities of spatially
enabled data collected and making it more easily
available to the public and the scientific community,
more effort should be put in defining protocols that
can allow an easier use of the data.
6 CONCLUSIONS
Spatial enablement is the development of techniques
that add a spatial description to datasets and analysis
tools. Thanks to these techniques, public health
problems can be better addressed thanks to the
detailed knowledge of the location of environmental
and social exposures, reducing time and costs of
interventions. Unfortunately, the use and spreading of
these methods is slowed down by a lack of efficient
data collection and representation protocols, that
leads to a dilation of processing and analyses time,
and a consequent waste of resources.
ACKNOWLEDGEMENTS
The authors wish to acknowledge Elisa Fisher, Foram
Jasani, Kumbie Madondo and José Pagàn from The
New York Academy of Medicine for providing part
of the data and supporting the analyses; and the
College of Global Public Health at the New York
University for allowing international students
exchange that facilitated the workflow.
The PULSE project has been funded by the
European Commission Horizon 2020 framework
program under grant GA-727816.
REFERENCES
Clark, L.P., Millet, D.B., Marshall, J.D., 2017. Changes in
Transportation-Related Air Pollution Exposures by
Race-Ethnicity and Socioeconomic Status: Outdoor
Nitrogen Dioxide in the United States in 2000 and 2010.
Environ. Health Perspect. 125, 097012.
https://doi.org/10.1289/EHP959
Environment & Health Data Portal [WWW Document],
n.d. URL http://a816-dohbesp.nyc.gov/IndicatorPublic/
PublicTracking.aspx?theme_code=2,3&subtopic_id=1
1 (accessed 2.28.18).
Exposomics: mathematics meets biology. - PubMed - NCBI
[WWW Document], n.d. URL https://www.ncbi.
nlm.nih.gov/pubmed/26371206 (accessed 3.7.19).
Litonjua, A.A., Carey, V.J., Weiss, S.T., Gold, D.R., 1999.
Race, socioeconomic factors, and area of residence are
associated with asthma prevalence. Pediatr. Pulmonol.
28, 394–401. https://doi.org/10.1002/(SICI)1099-
0496(199912)28:6<394::AID-PPUL2>3.0.CO;2-6
McMillen, D.P., 2004. Geographically Weighted
Regression: The Analysis of Spatially Varying
Relationships. Am. J. Agric. Econ. 86, 554–556.
https://doi.org/10.1111/j.0002-9092.2004.600_2.x
New York City Neighborhood Health Atlas [WWW
Document], n.d.. Tableau Softw. URL
https://public.tableau.com/views/NewYorkCityNeighb
orhoodHealthAtlas/Home?%3Aembed=y&%3Ashow
VizHome=no&%3Adisplay_count=y&%3Adisplay_st
atic_image=y&%3AbootstrapWhenNotified=true
(accessed 2.27.18).
Statewide Planning and Research Cooperative System
[WWW Document], n.d. URL https://www.health.ny.
gov/statistics/sparcs/ (accessed 11.13.18).
United Nations, Department of Economic and Social
Affairs, 2014. World urbanization prospects, the 2014
revision: highlights.
World Health Organization, UN-Habitat, 2016. Global
report on urban health: equitable healthier cities for
sustainable development. World Health Organization.
Advantages and Difficulties of using Spatial Enablement to Support Public Health in Cities: The PULSE Case Study
329
