Visualizing Business Ecosystems: Results of a Systematic Mapping Study
Anne Faber, Maximilian Riemhofer, Dominik Huth and Florian Matthes
Technical University of Munich, Boltzmannstrasse 3, 85748 Garching, Germany
{anne.faber, maximilian.riemhofer, dominik.huth, matthes}@tum.de
Keywords:
Mapping Study, Business Ecosystem, Visualization.
Abstract:
Researchers and practitioners increasingly recognize the relevance of the complex business environment in
which companies develop, produce, and distribute their services and products, which we refer to as business
ecosystems. In scientific research, the characteristics of business ecosystems, including the changing relations
between ecosystem entities, are often visualized. We conducted a systematic mapping study analyzing overall
136 papers to identify types of visualizations used in the business ecosystem context. We provide an overview
of 17 visualization types and their frequency of application in scientific literature. In addition, we collected
visualization tool requirements, which we enriched with our own experience visualizing business ecosystems
with practitioners, leading to overall nine tool requirements.
1 INTRODUCTION
Business ecosystems have gained researchers’ and
practitioners’ attention (Guittard et al., 2015; Bosch,
2016) as companies innovate, develop, produce and
distribute their services and products in a complex
business environment, which we refer to as busi-
ness ecosystem. Thus, a business ecosystem extends
the classic supply chain, consisting of suppliers and
customer, by also including other entities within the
business environment of the enterprise. It describes
the holistic environment of a company covering cur-
rent and potential future business partners, customers,
suppliers, competitors, regulatory institutions, and in-
novative start-ups. As continuously entities enter and
leave the ecosystem it exhibits a high dynamic (Pel-
toniemi and Vuori, 2004).
In scientific literature, various types of business
ecosystems are presented and discussed, such as in-
novation ecosystem (Adner and Kapoor, 2010), plat-
form business ecosystems (Toivanen et al., 2015), or
software ecosystems (van den Berk et al., 2010), de-
scribing the roles within (Moore, 1996; Iansiti and
Levien, 2004) or the structure of (Visnjic et al., 2016)
the ecosystem in focus. To illustrate these ecosystem
characteristics authors use visualizations, which are
often static. In parallel, to provide insights about the
entities and their relations within the business ecosys-
tem, interactive visualizations have been proven to
support decision makers in their ecosystem related
tasks (Basole et al., 2016; Huhtamaki and Rubens,
2016; Evans and Basole, 2016). Thereby, visualiza-
tions can help to derive value from ecosystem data,
e.g., in order to spot anomalies, identify keystone and
niche players of the ecosystem, or recognize change
patterns and trends (Vartak et al., 2016).
Our contribution in this paper is two-fold as it in-
volves the description of 1) used visualizations within
business ecosystem literature and 2) synthesized tool
requirements for visualizing business ecosystems. We
draw on results gained through a systematic map-
ping study we conducted. Even though, we identified
four existing literature reviews addressing business
ecosystems, none targeted visualizations of these.
2 RESEARCH BACKGROUND
2.1 Business Ecosystem
James Moore introduced business ecosystems in the
mid-1990s, defining them as a collection of interact-
ing companies (Moore, 1996). He presented a frame-
work to describe the interplay between the core busi-
ness, extended business, and business ecosystem of
a company (Fig. 2 e). Thereby, the life cycle of a
business ecosystem consists of four phases, namely
birth/pioneering, expansion, leadership/authority, and
self-renewal or death (Moore, 1993, 1996). The first
phase denotes the idea development. In the second
phase, the idea is brought to the markets, followed by
the attempt to gain leadership. When the third phase
is accomplished, there are two possible outcomes: ei-
ther the organizations withing the ecosystem are able
to constantly innovate, leading to the survival of their
ecosystem; or they fail to do so, wherefore the ecosys-
tem dies. Each evolutionary stage comprises coopera-
tive and competitive challenges in order to maintain a
healthy ecosystem along each phase. The initial defi-
nition was enriched describing the role of companies
as “suppliers, distributors, outsourcing firms, makers
of related products or services, technology providers,
and a host of other organizations” (Iansiti and Levien,
2004), all affecting business success and failure of
companies active within the business ecosystem. Fur-
thermore, business ecosystems constantly evolve, ex-
hibiting a dynamic structure (Peltoniemi and Vuori,
2004), with not only companies but also human ac-
tors, entering and leaving the ecosystem, which “are
interconnected through a complex, global network of
relationships” (Basole et al., 2015).
2.2 Business Ecosystem Visualization
Visualizations of business ecosystems have proven
to enable ecosystem stakeholders to take better-
informed decisions (Basole et al., 2016; Huhtamaki
and Rubens, 2016; Evans and Basole, 2016). Re-
search addressing ecosystem visualizations has used
data sets collected from commercial databases on
business and economic data or drawn from social or
business media (Basole et al., 2012, 2015).
Basole et al. (2013) developed and presented the
tool dotlink360 to support ecosystem stakeholders
in understanding interfirm relationships in business
ecosystems by providing interactive visualizations.
The main goal was to visualize the mobile ecosys-
tem, with entities such as mobile network providers,
platform providers, or device manufacturers. It con-
sists of six visualizations: a scrollable list (Fig. 2 a);
composition view to display detailed company infor-
mation; a temporal view depicting when relationships
were formed and how active an entity is in forming re-
lations; a geographical view displaying the location of
the entities’ headquarters (Fig. 2 c); a segment view,
which is a mixture of a chord diagram and a network;
and a scatter plot (Fig. 2 i) to visualize financial met-
rics.
Like dotlink360, ecoxight was developed by Ba-
sole et al. (2018). It draws on data from Pro-
grammableWeb and Crunchbase to depict the API
(application programming interface) ecosystem. Five
distinct views are presented: a path view (a node-link
diagram), a category view (a combination of a chord
diagram, and a network); a geography view; Scatter-
Net view (a scatter plot); and a temporal view.
The tool Business Ecosystem Explorer (BEEx)
was developed to model and visualize the smart city
business ecosystem (Faber et al., 2018a). The tool
applies a wiki-based approach for the ecosystem data
collection and offers collaborative modeling features
(Faber, 2017). It includes five distinct views: a list
(Fig. 2 a), an adjacency matrix (Fig. 2 p), a force
layout (Fig. 2 q), a treemap (Fig. 2 m) and a chord
diagram (Fig. 2 n). In addition, a detailed overview
for each entity is available.
3 RELATED WORK
As business ecosystems gained relevance, this work
is not the first literature review addressing business
ecosystem related research. In the following, we
briefly summarize four existing literature reviews we
identified during our systematic mapping study.
M
¨
akinen and Dedehayir (2012) published a lit-
erature review targeting business ecosystem evolu-
tion and strategic considerations. Analyzing 68 pa-
pers, they discuss (i) business ecosystem members
and their roles, (ii) factors that influence the evo-
lution of business ecosystems, (iii) the dynamics of
ecosystem change, and (iv) the strategic considera-
tions of firms positioned in ecosystems. de Vasconce-
les Gomes et al. (2016) focused their literature review
on innovation ecosystems by analyzing 193 articles.
They highlight the most influential papers, and dis-
cuss the innovation ecosystem concept and its vari-
ations. Finally, they identified six related research
streams: industry platform x innovation ecosystem;
innovation ecosystem strategy, strategic management,
value creation and business model; innovation man-
agement; managing partners; the innovation ecosys-
tem life cycle; and innovation ecosystem and new
venture creation. J
¨
arvi and Kortelainen (2017) de-
scribe results of their literature review conducted in
November 2014. They analyzed overall 72 articles,
identifying three units of analysis: the individual ac-
tor (typically a firm), the relationship between the ac-
tors, and the ecosystem. Thereby, the individual actor
can play a variety of roles, such as customer, delivery
channel, seller of complementary products and ser-
vices, supplier, or policy maker etc, which occupy dif-
ferent positions in ecosystems, such as a hub or niche
position. As relationships in the ecosystem they iden-
tify the interaction; interdependence and substitution;
and the relationship between the focal firm and the
complementor; and finally for the ecosystem with its
collective and collaborative value creation and discuss
the competition between ecosystems; the ecosystem
clockspeed; ecosystem life cycle; network structure;
and transformation from supply or value. In a recent
study, Scaringella and Radziwon (2018) analyzed 104
articles addressing ecosystems. They discuss the four
main types of ecosystems, namely business, innova-
tion, entrepreneurial, and knowledge; providing an
overview about related theories from the territorial ap-
proach and identify invariants between both research
directions. In addition, they propose a research frame-
work based on their comparison as a basis for future
empirical research.
None of these literature reviews addresses the vi-
sualizations of business ecosystems, which we ad-
dress with the here presented results.
4 RESEARCH DESIGN
For this research, we conducted a systematic mapping
study, which is a specific form of a literature review
(Kitchenham et al., 2011; Petersen et al., 2008). It
“aims at reviewing a relatively broad topic by identi-
fying, analyzing, and structuring the goals, methods,
and contents of conducted primary studies. There-
fore, the state-of-the-art research, research gaps, or
matured sub-areas can be identified and explicated”
(Wendler, 2012, p. 1318). The overall research pro-
cess consists of eight process steps and is visualized
in Figure 1.
4.1 Research Method and Research
Questions
This study aimed to obtain an overview of used vi-
sualizations to describe characteristics of business
ecosystems and already existing tool requirements to
visualize business ecosystem entities and their rela-
tions. In a first step, we defined two research ques-
tions as the guiding foundation for the results pre-
sented here:
RQ1. What visualizations are used in literature to il-
lustrate business ecosystems and the concept?
RQ2. Which requirements towards business ecosys-
tem visualization tools have been formulated?
The rational of RQ1 is to identify visualization types
used within business ecosystem research. RQ2 aims
are synthesizing existing tool requirements to provide
visualizations targeting the dynamic changes of busi-
ness ecosystem entities and their relations.
4.2 Search Process
In the following, we briefly describe the conducted
steps of searching, selecting, and analyzing existing
scientific literature in the mapping study.
Selection of Data Sources and Search Strategy. For
the selection of suitable databases, we identified rel-
evant research areas related to business ecosystems:
computer science, information systems, and manage-
ment theory. The conducted mapping study was based
on electronic databases. An extensive selection of
databases was the first step in fulfilling the research
aim of a comprehensive overview about research in
business ecosystems. We selected the databases As-
sociation for Computing Machinery (ACM), Electri-
cal and Electronics Engineers (IEEE), ScienceDirect,
Scopus, SpringerLink, and Web of Science as these
databases cover publications of the previously iden-
tified research domains. We conducted the search in
September and October 2018, using the search string
business ecosystem. Within the initial search only the
titles, abstracts, and keywords were analyzed. If at
least one of these three contained the term business
ecosystem, the paper was considered. This resulted in
overall 1,842 papers after the initial search.
Inclusion and Exclusion Criteria. In the next pro-
cess steps, relevant articles were entered in the “pool
of papers” (Wendler, 2012) and irrelevant paper were
excluded. Papers were included in case they were
written in English and the scope was related to busi-
ness ecosystems. We excluded papers with a lack
of business focus, i.e., interaction of multiple actors
crossing industries, but rather describing technical as-
pects or architectural descriptions of ecosystems. In
order to maintain high quality standards, results with
a “notice of violation”- or “notice of retraction”-note
were excluded as well. After reading title, abstract,
and keywords, 382 articles were labeled as potentially
relevant, after which 124 duplicates were removed,
leaving 258 papers. For these remaining papers, a
content mapping matrix was created, consisting of the
business ecosystem characteristics: definition, roles,
phases, types, visualizations, applications, and exam-
ples (with BE as abbreviation for business ecosys-
tem). These characteristics are:
BE Definition. Either a new definition of business
ecosystem is established, it adds to an existing defini-
tion, sums up different definitions, or compares exist-
ing definitions (58 papers).
BE Roles. The different roles ecosystem actors incor-
porate are described, a new descriptive metaphor is
established for these roles or different roles are com-
pared (70 papers).
BE Phases. The paper establishes a business ecosys-
tem life cycle, describes at least one state of a business
ecosystem, or it compares different life cycle models
(29 papers).
BE Types. The paper describes at least one type of
business ecosystem or compares multiple types (42
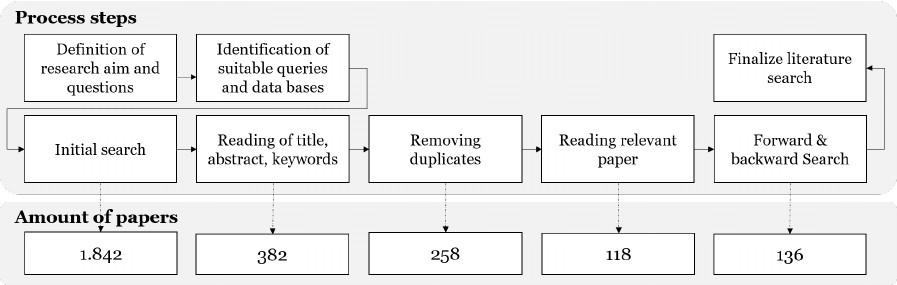
Figure 1: Search process (following (Wendler, 2012)).
papers).
BE Visualization. The article contains at least one
business ecosystem visualization, describes how a
business ecosystem can be visualized, develops or
uses a modeling or visualization tool (43 papers).
BE Application. Applications of the business ecosys-
tem concept both in research and practice (58 papers).
BE Example. Paper demonstrating a specific exam-
ple of a business ecosystem in a real world context,
e.g., for Walmart or Alibaba (49 papers).
Applying the mapping matrix led to 118 relevant pa-
pers. Last, forward and backward citation search
(Webster and Watson, 2002) was applied on these
records, through which we identified 18 additional
papers. Thus, overall we analyzed 136 paper in our
systematic mapping study. Due to the page limita-
tion, we will only present here results related to used
business ecosystem visualizations and requirements
towards business ecosystem visualizations and a tool-
support of the latter.
5 BUSINESS ECOSYSTEM
VISUALIZATIONS
Within our mapping study, we identified 43 records,
which incorporate business ecosystem visualizations.
These either use visualizations to describe a business
ecosystem, or discuss how a business ecosystem can
be visualized. All visualization related records in-
clude at least one visual to depict an actual, simpli-
fied, or sample business ecosystem. 42 results include
network visualizations such as node networks (Fig. 2
q), directed networks (Fig. 2 o), chord diagrams (Fig.
2 n), or matrices (Fig. 2 p). Multi-dimensional visu-
alizations, including bar charts (Fig. 2 f), line charts
(Fig. 2 h), or adaptations of Moore’s (1996) frame-
work (Fig. 2 e), tree visualizations, such as tree maps
(Fig. 2 m) or variations of the sunburst diagram (Fig.
2 l), and 1-dimensional lists (Fig. 2 a) were mentioned
in 24, 9, or 7 records respectively. Timelines (Fig. 2
d) were the only temporal visualization used, whereas
connection map (Fig. 2 b) and dot map (Fig. 2 c) were
the only 2-dimensional visualizations.
6 TOOL REQUIREMENTS FOR
BUSINESS ECOSYSTEM
VISUALIZATIONS
Three of the 43 identified papers discuss requirements
for suitable visualization tools: twice Basole et al.
(2013, 2018); and Hernandez-Mendez et al. (2017).
All three papers aimed at developing a visualization
tool targeting business ecosystems. In the following
we list, describe, and synthezise these requirements
into a single set of requirements, which we enrich
with requirements identified during two case studies
we conducted.
6.1 Requirements in Business
Ecosystem Literature
Basole et al. (2013) presented their tool, dotlink360,
in their 2013 paper. Prior to finalizing the tool, they
set up the following requirements for visualizations
and the tool developed, in which they incorporate the
feedback of practitioners:
B13R1. Both top-down and bottom-up examination
of an ecosystem are critical; thus providing flexible
navigation between higher-level ecosystem overviews
and individual details;
B13R2. Understanding interfirm connectivity, com-
position, and temporality is vital;
B13R3. Comparative perspectives drive insights so it
is important to communicate multiple perspectives;
B13R4. Communicate agreement summaries first,
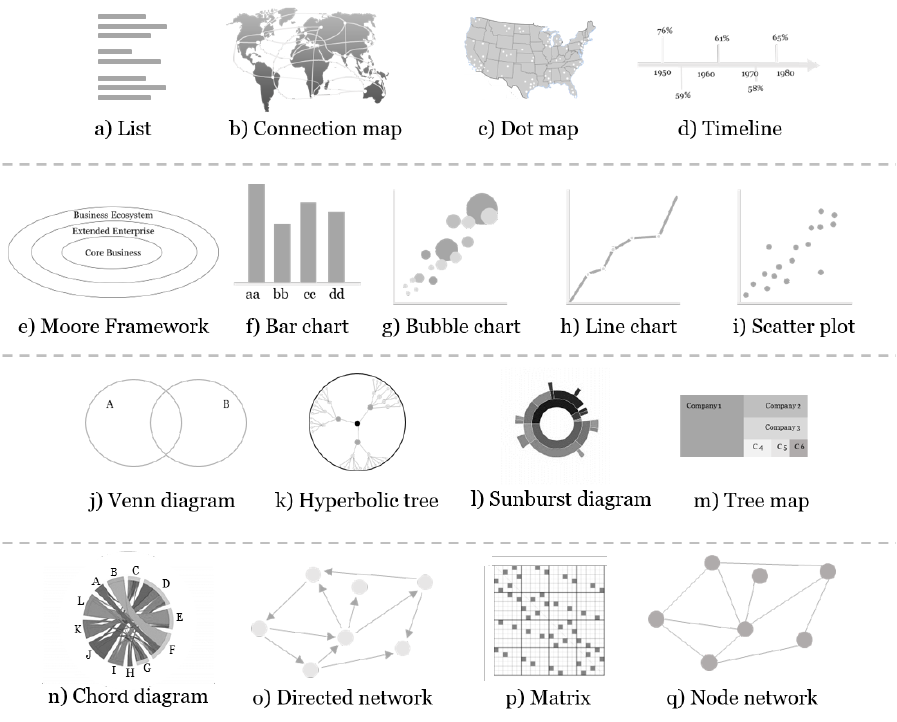
Figure 2: Used business ecosystem visualization types.
then details as desired; and
B13R5. Provide a familiar metaphor while sup-
porting direct and prompt interaction, not complex
queries and commands.
In 2018, Basole et al. (2018) presented a second tool,
named ecoxight. Again, they defined five visualiza-
tion requirements with the help of practitioners:
B18R1. Triangulated insights through application of
multiple perspectives;
B18R2. Explore multiplex relationships through
appropriate mechanisms;
B18R3. Understand temporal ecosystem dynamics,
explore dynamic network;
B18R4. Facilitate multiple modes of inquiry with
rich dynamic filtering and querying capabilities; and
B18R5. Easy-to-use and familiar design.
One year prior, Hernandez-Mendez et al. (2017) pub-
lished a paper describing their visualization tool, the
Business Ecosystem Explorer (BEEx), including four
requirements:
H17R1. Support semi- and non-structured underly-
ing business ecosystem data;
H17R2. Ability to modify the business ecosystem
model and visualizations at run-time;
H17R3. Provide role-based user interfaces for differ-
ent stakeholder roles; and
H17R4. Must be supported by WEB-based technolo-
gies.
Park et al. (2016) presented a visual analytic sys-
tem for the analysis of a supply chain management
ecosystem and also identify three similar design re-
quirements: (1) to support multiple views in an inte-
grated interface, (2) to enable interactive investigation
of supply networks, and (3) to provide data-driven
analytic capabilities. However, as this paper targets
specifically supply chain management, it was not cov-
ered in the results of our systematic mapping study.
Both Basole-papers (Basole et al., 2013, 2018) em-
phasized the role of multiple visualization approaches
(B13R3 and B18R1). Basole et al. (2013) insist
to include top-down as well as bottom-up examina-
tion, in order to be able to view the big picture as
well as single entities and relations (B13R1). Ad-
ditionally, Basole et al. (2018) address filtering and
querying options to limit the information to those
needed and facilitate searching for a particular infor-
mation (B13R4). These requirements indicate the ne-
cessity to provide more than one visualization lay-
out. All of the other requirements mentioned by Ba-
sole et al. (2013, 2018) are in light of the visualiza-
tions in particular rather than the tools. They relate
to the three initial components of business ecosys-
tems: the network, the relations, and the temporal
dynamics. Finally, the temporal dynamics, or the
evolution, of a business ecosystem, needs to be in-
corporated (B13R2, B16R3). As visualizations are
data driven, a business ecosystem visualization tool
should be able to deal with the variety of underlying
ecosystem data. This data can be structured, semi-
structured, or non-structured, depending on the used
data source (H17R1). Being able to modify the visu-
alization and the underlying model enables ecosystem
stakeholders to adapt the business ecosystem model
according to environmental changes (H17R2). En-
visioning a team of ecosystem experts providing the
ecosystem visualizations to non-technical ecosystem
stakeholders, these should be addressed by the visual-
ization tool through the provision of different user in-
terfaces (H17R3). Finally, enabling the use of WEB-
based technologies broadens the scope of usability
(H17R4). In addition to these tool requirements, Ba-
sole et al. (2013, 2018) emphasize that the user in-
terface should not be too complex (B13R5), but easy
to use (B18R5) and in a familiar design (B13R5,
B18R5).
6.2 Synthesized Visualization Criteria
from Literature
After analyzing the identified requirements towards
business ecosystem visualizations, we can synthesize
them into overall seven requirements towards busi-
ness ecosystem visualizations displaying ecosystem
entities, their relations, the evolution of the ecosys-
tem, and a tool enclosing these visualizations.
For the visualizations it is important, that the relation
between ecosystem entities is depicted including de-
scribing characteristics of each relations. We refer to
these describing characteristics as attributes.
Requirement 1. Display the multiplex relations be-
tween the ecosystem entities and provide attributes
describing these relations.
In addition, for the visualization – as ecosystem data
is large and heterogeneous (Basole et al., 2015), rang-
ing from technology-related data about applied stan-
dards and platforms to use, to market information and
legal regulations – it is important to allow users to fil-
ter, highlight, or mark specific parts of the visualized
ecosystem, summarized as interactive features.
Requirement 2. The provided visualization should
comprise interactive features such as clicking, drag-
ging, hovering, and filtering.
As every visualization is limited in the insights it
can offer, having multiple perspectives on business
ecosystems allows practitioners to look at business
ecosystems from different angles, set focuses where
needed, and gain more insights.
Requirement 3. Offer multiple perspectives on the
whole ecosystem by providing multiple views and pro-
vide flexible navigation between these visualizations.
As ecosystem entities continuously enter and leave
the ecosystem, it is changing over time. Insights can
be gained by visualizing the evolution of business
ecosystems.
Requirement 4. Depict the change of structure a
business ecosystem undergoes over time.
Basole et al. (2013, 2018) emphasized, in both pa-
pers, the usability of a business ecosystem visualiza-
tion tool. In order to entitle even practitioners without
technological experience to work with the business
ecosystem visualizations, the tool should be easy to
use.
Requirement 5. Provide a familiar and easy-to-use
user interface to display the visualization(s).
Data comprising information about the business
ecosystem can come from various sources, such as
existing databases, newspaper articles or blogs ad-
dressing recent developments within the ecosystem,
but also company and institutional web presences
and publications. Thus, a tool visualizing business
ecosystem data should allow different data formats to
be included.
Requirement 6. Support usage of semi- and non-
structured underlying business ecosystem data.
As ecosystems change dynamically, ecosystem stake-
holders should be able to change the business ecosys-
tem data model according to environmental changes –
as new entities enter and leave the ecosystem, and ex-
isting relations are changed or new ones are added.
This holds also true for the visualizations used: if
ecosystem stakeholder requirements towards the pro-
vided visualizations change, the visualizations should
be adaptable as well.
Requirement 7. Allow the modification of the busi-
ness ecosystem model and visualizations at run-time.
We have deliberately excluded the requirement
H17R4 because we do not want to assume a team
of ecosystem experts to model the ecosystem in the
background.
6.3 Practical Experiences Visualizing
Business Ecosystem
In two case studies we conducted in the context of col-
laborative business ecosystem visualizations (Faber
et al., 2018b), we gained insights relevant for tool re-
quirements. In these studies, we focused on the col-
laborative aspect to model and visualize the business
ecosystem within a design science project. Therefore,
we propose to add the following tool requirements.
To include diverse aspects and perspectives of the
business ecosystem in the modeling focus, it is im-
portant to involve groups of stakeholders with diverse
skills and expertise in the modeling process. These
stakeholders should be able to access the system sep-
arately, but then collaboratively update and adapt the
business ecosystem data model according to occur-
ring changes.
Requirement 8. Multiple stakeholders with different
roles and different kinds of expertise should be en-
abled to contribute to the collaborative instantiation
and creation of the business ecosystem model.
When ecosystem stakeholders model business
ecosystems for the first time and existing models and
tools are not available, it is unclear what information
will be available with what accuracy and frequency.
However, stakeholders should be given the freedom
to model the ecosystem without a predefined structure
as they see fit to answer and fulfill their ecosystem
specific questions and tasks.
Requirement 9. No structures of the business ecosys-
tem models should be imposed. The model should be
dynamically enriched with additional, not yet defined
structure.
7 DISCUSSION AND
CONCLUSION
Using insights gained through a systematic mapping
study, the contribution of this paper is two-fold: we
provided an overview of applied visualizations to de-
scribe characteristics of business ecosystems in sci-
entific literature. In addition, to provide the basis
for a tool-support to visualize business ecosystems,
we synthesized existing requirements of presented
tools and supplemented these with insights we gained
through a design science project applied in two case
studies.
We present an overview of 17 visualization types
practitioners and researchers interested in visualiz-
ing business ecosystems can pick from. Network
visualizations are the most intuitive and most fre-
quently applied visualizations for business ecosys-
tems. Thereby, node networks are the most promi-
nent, followed by directed networks. Also, we discuss
nine tool requirements to visualize business ecosys-
tems, as we synthesized existing requirements in sci-
entific literature enriched with collaborative aspects to
include various stakeholders in the business ecosys-
tem modeling process.
A noticeable limitation of the presented work is
the applied search string within the systematic map-
ping study. Additional search strings, such as busi-
ness network, business clusters or networked ecosys-
tems could have contributed to the results presented
here. Nevertheless, as business ecosystems contin-
uously gain more interest of researchers and practi-
tioners, we believe that the presented results provide
a baseline for both groups when visualizing business
ecosystems or developing a tool to visualize ecosys-
tems.
ACKNOWLEDGEMENTS
This work has been sponsored by the German Federal
Ministry of Education and Research (BMBF) grant
BEEx+ 01IS17049.
REFERENCES
Adner, R. and Kapoor, R. (2010). Value creation in inno-
vation ecosystems: How the structure of technologi-
cal interdependence affects firm performance in new
technology generations. Strategic Management Jour-
nal, 31(3):306–333.
Basole, R. C., Clear, T., Hu, M., Mehrotra, H., and Stasko, J.
(2013). Understanding interfirm relationships in busi-
ness ecosystems with interactive visualization. IEEE
Transactions on Visualization and Computer Graph-
ics, 19(12):2526–2535.
Basole, R. C., Hu, M., Patel, P., and Stasko, J. T. (2012). Vi-
sual analytics for converging-business-ecosystem in-
telligence. IEEE Computer Graphics and Applica-
tions, 32(1):92–96.
Basole, R. C., Huhtam
¨
aki, J., Still, K., and Russell, M. G.
(2016). Visual decision support for business ecosys-
tem analysis. Expert Systems with Applications,
65:271–282.
Basole, R. C., Russell, M. G., Huhtam
¨
aki, J., Rubens, N.,
Still, K., and Park, H. (2015). Understanding Busi-
ness Ecosystem Dynamics: A Data-Driven Approach.
ACM Transactions on Management Information Sys-
tems, 6(2):1–32.
Basole, R. C., Srinivasan, A., Park, H., and Patel, S. (2018).
ecoxight: Discovery, Exploration, and Analysis of
Business Ecosystems Using Interactive Visualization.
ACM Transactions on Management Information Sys-
tems, 9(2).
Bosch, J. (2016). Speed, Data, and Ecosystems: The Future
of Software Engineering. IEEE Software, 33(1):82–
88.
de Vasconceles Gomes, L. A., Facin, A. L. F., Salerno,
M. S., and Ikenami, R. K. (2016). Unpacking the
innovation ecosystem construct: Evolution, gaps and
trends. Technological Forecasting and Social Change.
Evans, P. C. and Basole, R. C. (2016). Revealing the API
ecosystem and enterprise strategy via visual analytics.
Communications of the ACM, 59(2):26–28.
Faber, A. (2017). Towards a visual language approach for
modeling business ecosystems. In CEUR Workshop
Proceedings, volume 2027, pages 1–8. CEUR-WS.
Faber, A., Hernandez-Mendez, A., Rehm, S.-V., and
Matthes, F. (2018a). An agile framework for mod-
eling smart city business ecosystems. In ICEIS 2018 -
Proceedings of the 20th International Conference on
Enterprise Information Systems, volume 2, pages 39–
50. SciTePress.
Faber, A., Hernandez-Mendez, A., Rehm, S.-V., and
Matthes, F. (2018b). Visualizing business ecosys-
tems: Applying a collaborative modelling process in
two case studies. In ACIS 2018 Proceedings - 28th
Australasian Conference on Information Systems.
Guittard, C., Schenk, E., and Burger-Helmchen, T. (2015).
Crowdsourcing and the Evolution of a Business
Ecosystem. In Garrigos-Simon, F. J., Gil-Pechu
`
an, I.,
and Estelles-Miguel, S., editors, Advances in Crowd-
sourcing, pages 49–62. Springer International Pub-
lishing.
Hernandez-Mendez, A., Faber, A., and Matthes, F. (2017).
Towards a data science environment for modeling
business ecosystems: The connected mobility case.
In Communications in Computer and Information Sci-
ence, volume 767, pages 324–330. Springer Verlag.
Huhtamaki, J. and Rubens, N. (2016). Exploring innovation
ecosystems as networks: Four european cases. Pro-
ceedings of the Annual Hawaii International Confer-
ence on System Sciences, 2016-March:4505–4514.
Iansiti, M. and Levien, R. (2004). The Keystone Advantage:
What the New Dynamics of Business Ecosystem Mean
for Strategy, Innovation, and Sustainability. Harvard
Business School Press.
J
¨
arvi, K. and Kortelainen, S. (2017). Taking stock of empir-
ical research on business ecosystems: a literature re-
view. International Journal of Business and Systems
Research, 11(3):215.
Kitchenham, B., Budgen, D., and Breretom, O. P. (2011).
Using mapping studies as the basis for further research
- a participant-observer case study. Information and
Software Technology, 53(6):638–651.
M
¨
akinen, S. J. and Dedehayir, O. (2012). Business ecosys-
tem evolution and strategic considerations: A litera-
ture review. 2012 18th International Conference on
Engineering, Technology and Innovation, ICE 2012 -
Conference Proceedings, pages 1–10.
Moore, J. F. (1993). Predators and prey: a new ecology of
competition. Harvard Business Review, 71(3):75–86.
Moore, J. F. (1996). The Death of Competition: Leader-
ship & Strategy in the Age of Business Ecosystems.
HarperBusiness.
Park, H., Bellamy, M. A., and Basole, R. C. (2016). Vi-
sual analytics for supply network management: Sys-
tem design and evaluation. Decision Support Systems,
91:89–102.
Peltoniemi, M. and Vuori, E. (2004). Business ecosystem
as the new approach to complex adaptive business en-
vironments. Frontiers of E-business research, pages
267–281. Tampere, Finland.
Petersen, K., Feldt, R., Mujtaba, S., and Mattsson, M.
(2008). Systematic mapping studies in software en-
gineering. In EASE’08 Proceedings of the 12th inter-
national conference on Evaluation and Assessment in
Software Engineering, pages 68–77. Italy.
Scaringella, L. and Radziwon, A. (2018). Innovation, en-
trepreneurial, knowledge, and business ecosystems:
Old wine in new bottles? Technological Forecasting
and Social Change, 136(September):59–87.
Toivanen, T., Mazhelis, O., and Luoma, E. (2015). Network
analysis of platform ecosystems: The case of internet
of things ecosystem. Lecture Notes in Business Infor-
mation Processing, 210:30–44.
van den Berk, I. M., Jansen, S., and Luinenburg, L. (2010).
Software ecosystems: A software ecosystem strategy
assessment model. ACM International Conference
Proceeding Series, pages 127–134.
Vartak, M., Huang, S., Siddiqui, T., Madden, S., and
Parameswaran, A. G. (2016). Towards visualization
recommendation systems. SIGMOD Record, 45:34–
39.
Visnjic, I., Neely, A., Cennamo, C., and Visnjic, N. (2016).
Governing the city: Unleashing value from the busi-
ness ecosystem. California Management Review,
59(1):109–140.
Webster, J. and Watson, R. T. (2002). Analyzing the Past to
Prepare for the Future: Writing a Literature Review.
MIS Quarterly, 26(2):xiii–xxiii.
Wendler, R. (2012). The maturity of maturity model re-
search: A systematic mapping study. Information and
Software Technology, 54(12):1317–1339.
