
FREEController: A Framework for Relative Efficiency Evaluation of
Software-Defined Networking Controllers
Eduardo Augusto Klosowski and Adriano Fiorese
Graduate Program in Applied Computing (PPGCA), Dept. of Computer Science (DCC),
Santa Catarina State University (UDESC), Joinville, Brazil
Keywords:
Evaluation Framework, SDN Controller, Relative Efficiency, DEA.
Abstract:
A Software-Defined Network (SDN) requires a controller that is responsible for defining how the network
will behave, since it has the responsibility to install flow rules for forwarding the data streams through the
network devices. Thus, it is necessary that the controller presents performance good enough to attend the
network needs. However, with the diversity of existing controllers, some offering more facilities to the devel-
oper, while others offer higher performance, a doubt arises regarding which controller manages to attend the
network demand, or how much performance can be bargained to get more facilities. To answer these ques-
tions, this work presents FREEController. It is an SDN controllers evaluation framework based on relative
efficiency obtained by means the Data Envelopment Analysis (DEA) multicriteria decision-making method.
This proposed framework takes into account several stages including the controllers’ performance evaluation,
creating a performance database, and how to use these database to identify which controllers attend the net-
work demand using the DEA method. Results comprising the proposed framework evaluation indicate the
viability of the relative efficiency approach and its relation with the used controllers’ resources.
1 INTRODUCTION
Software-Defined Networking (SDN) paradigm
proposes to separate the data plane and control
plane from traditional packet-switched networks by
moving packet forwarding devices control plane
to an external service usually centralized, called
SDN controller. In this paradigm, SDN controller
is responsible for handling the rules that will dictate
the behavior of the forwarding devices (Kreutz
et al., 2015). Thus, networks using SDN have their
performance directly related to the performance of
the SDN controller. Therefore, it is important to
choose the most suitable network controller in order
to have performance to attend the expected demand.
Since there are several SDN controllers
implemented in different programming languages,
each one offers a different environment to the
programmer. Some environments may be more
programmer friendly, enabling rapid development
of new features. Some environments, more than
others, may require in-depth knowledge of both
the languages and the protocol used in the SDN
network (e.g. OpenFlow) usually delivering better
performance. Thus, there is a choice comprising how
much performance can be tradeoff to development
easyness when choosing an SDN controller.
Thus, one might ask: Which controllers would
efficiently attend network demand? Considering that
with more resources on the servers, controllers would
deliver better performance, how much of a resource
would it take for the controller to efficiently attend
this demand?
In order to answer these questions, this work
presents the FREEController framework. It involves
the performance data measurement of several
different SDN controllers and use of a mathematical
tool to verify which ones efficiently attend the
requested demand thus making it possible to choose
an efficient SDN controller. Particularly, in this work,
the relative efficiency concept is used. It regards to the
compared efficiency among several SDN controllers.
Therefore, the most efficient controller among al of
them is said the relative efficient controller.
The remainder of this paper is organized
as follows: Section 2 discusses work involving
SDN controllers’ performance. Section 3 deals
with background concepts used in this work.
Section 4 describes in detail the proposed framework.
Following, Section 5 presents experiments performed
Klosowski, E. and Fiorese, A.
FREEController: A Framework for Relative Efficiency Evaluation of Software-Defined Networking Controllers.
DOI: 10.5220/0007761503490360
In Proceedings of the 21st International Conference on Enterprise Information Systems (ICEIS 2019), pages 349-360
ISBN: 978-989-758-372-8
Copyright
c
2019 by SCITEPRESS – Science and Technology Publications, Lda. All rights reserved
349

and discusses FREEControler evaluation results.
Finally, Section 6 elaborates on final considerations.
2 RELATED WORK
SDN controllers influence OpenFlow-based networks
performance. However, they are not the only ones.
Work (Jarschel et al., 2011) presents a general
analysis of OpenFlow performance, discussing
the joint performance of the controller with the
forwarding devices. At the end its contribution
regards to identifying the need for controller
performance for good network performance.
When the subject is controllers performance
alone, several evaluation approaches have
been proposed. Particularly, Tootoonchian et
al. (Tootoonchian et al., 2012) presents a performance
analysis of different controllers based on each
controllers’ latency and throughput measurements.
It also demonstrates that the amount of switches
connected to the controller directly influences results,
as well as the number of CPU cores or threads
involved. However, amount of cores only presents
influence when the controller is prepared to handle
parallel requests, which is the case of the proposed
NOX-MT that is a multithreading support version of
NOX. Authors proposal intends to make better use of
the several cores of a server running the controller,
thus presenting better results than the single thread
version.
Further exploiting controllers’ performance
analysis performed by Shalimov et al. (Shalimov
et al., 2013) extends Tootoonchian et
al. (Tootoonchian et al., 2012) work by analyzing
other controllers and presenting other parameters
to the analysis. These other parameters are based
on issues related to the controllers’ reliability and
security. However, their work do not join all the
criteria used in order to perform a general controllers
analysis, which could indicate which is the best
controller, for instance.
Controllers performance analysis comprises more
than flow latencies, hardware features (e.g., cores,
threads, etc...). Sometimes, the task of managing
an SDN network can be delegated to a third party
for computing power processing, including executing
a controller. This is the case, for instance, to take
advantage of cloud computing provider offers. Hence,
Basu et al. (Basu et al., 2018) compares performance
of locally and in-the-cloud controllers.
Aliyu (Aliyu Lawal Aliyu, 2017) points to the
OpenFlow architecture characteristics that impact
network performance. Comprising OpenFlow
controllers, the measured latency and threshold
performance, as well as the need to support
multithreading to perform well (which depends on
the language in which the controller was written)
were used as evaluation metrics. Moreover, it
was also taken into consideration the controllers
algorithm to distribute the requests between threads
and also the software network library used by the
controller. Altogether, results point to Java as an
environment that allowing multithread, unlike to
Python one, is suggested to be used. Regarding
forwarding devices (Openflow-compatible switches),
authors also presents the TCAM memory limitation as
a performance issue. This is importante since TCAM
is usually used to store flow tables. This means
the need of efficient algorithms to enforce effective
flow eviction policies since usually TCAM capacity
is small and it is not possible to keep all flow-rules all
the time. This affects controller performance because
even with good algorithms to decide which rules to
keep in the devices as proposed in (Li et al., 2015),
they can be executed several times ending up in a loop
of evicting olds and adding new flows.
Along the years, it is important to note
that several works have been addressing SDN
(more specially OpenFlow) controllers assessment.
Recently, Mamushiane et al. (Mamushiane et al.,
2018) performed a comparative evaluation among
the most popular OpenFlow controllers. Authors
used cbench as a tool to measure controllers’ latency
and throughput. In addition, they also performed
a feature-based comparison claiming to deliver a
guideline to select a controller. Moreover, controllers
security is also an issue to be addressed. Thus,
diversity and security are the issues modelled and
evaluated comprising SDN controllers in (Maziku
et al., 2018). In this case, authors propose a
network diversity modeling framework to assess
impact on security risk due to multiple SDN
controllers. Using attack graphs and diversity
models, that work explores the security impact of
resource relationships to SDN multiple controller
networks. Comprising the network virtualization
realm, Turul et al. (Turull et al., 2014) have performed
an evaluation focusing on how the delay between
switch and OpenFlow controller can impact the
performance of a network. Particularly, in this
case, authors compared the controllers’ flow set-up
strategies and their TCP and UDP performance as
well as introducing a new metric to measure UDP
packet losses at the beginning of the data flow. The
related works presented controllers evaluation using
some benchmarking regarding particular metrics
comprising the evaluation domain. It is the case
ICEIS 2019 - 21st International Conference on Enterprise Information Systems
350

for security and virtualization as aforementioned.
On the other hand, the proposed framework beyond
also using a benchmark as its first step conducts an
evaluation taking into account a more comprehensive
concept and modelling of relative efficiency as
differential.
The great majority of these controllers assessment
are performed at the Mininet OpenFlow network
emulator (Lantz et al., 2010). It presents a
wide usage and acceptable network prototyping.
Taking these aspects into account, decisions regarding
performance based on experimental data resulting
from Mininet execution though widespread should be
taken carefully. Comprising this issue, Muelas et
al. (Muelas et al., 2018) have assessed the limits of
Mininet comprising SDN network experimentation.
Comprising tools to perform SDN appliances
(e.g., controllers and switches) performance
evaluaton, “cbench” (Sherwood and Kok-Kiong,
2010) is currently the de facto standard. However,
other alternatives have been appearing. OpenFlow
Controller-Benchmark (OFC-BenchTool) is an
OpenFlow benchmarker proposed in (Gamess et al.,
). It is based on cbench and it adds new functionalities
such as a graphical representation of results easing
the outcome analysis. Other benchmarking tool
representative is the so called flexible OpenFlow
controller benchmark (Jarschel et al., 2012).
Although authors describe it as a benchmarking tool,
it is more related with an early OpenFlow network
emulator. In fact, it allows emulation of scenarios
and topologies enabling evaluation of the controller
performance on a per-switch basis. Particularly, this
work uses cbench as one stage of FREEControler.
This choice was made reasoning the well know
accuracy and scientific acceptance of cbench.
Moreover, on its way, this work uses a well
know multicriteria analysis technique called Data
Envelopment Analysis (DEA) (Cooper et al., 2004)
to the FREEController proposal. In this regard,
several works have been using DEA to classification
and selection decision-making problems, among
others (Zhou et al., 2018; Stolzer et al., 2018; Lim,
2018; Park and Lee, 2018). Among these works, a
work using DEA to select the most suitable cloud
computing provider stands out (de Moraes et al.,
2018). That work can be used to select a proper
cloud computing provider in order to execute the
SDN controller for a particular network. Beyond
that, FREEControler proposes a relative efficiency
evaluation framework that, presenting similar DEA
utilization, performs a ranking of the most suitable
SDN controllers according features required by user.
However, an essential differential of our work,
regarding the others already presented, is the analysis
of the controller performance indicators, which once
measured, are used to figure out the most efficient
controller using DEA. Considering that different
networks have different demands regarding latency
and throughput, as well as different sizes, this work
also shows how to identify which controllers attend
each demand.
3 BACKGROUND
The main concepts involved in this work regards
to SDN itself and the decision-making method as a
tool to allow controllers ranking based on relative
efficiency.
3.1 Software-Defined Networking
Software-Defined Networking (SDN) is a networking
paradigm that separates the network control plane
from the data forwarding plane with the promise to
dramatically improve network resource utilization,
simplify network management, reduce operating cost,
and promote innovation and evolution (Akyildiz et al.,
2014).
In this regard, the data forwarding plane only
performs data handling in order to deliver it to the
right forwarding device’s physical port. Therefore,
unlike the traditional forwarding devices (e.g.,
routers) that are ROM programmed comprising
how to forward packets, an SDN-compatible data
plane device (e.g., OpenFlow switch) is configured
according the need, sometimes on-demand during
the network operation, by a software entity that
represents the control plane.
Thus, according the SDN proposal, this detached
control plane executes in other device than the
forwarding one. This hardware can be a server,
therefore, originaly centralizing the control of the
network. This software playing the role of control
plane is called SDN controller or alternatively
Network Operating System (NOS) (Kreutz et al.,
2015). Important to notice that this arrangement
allows that all decision-making process to define how
the network packets will be forwarded, which would
occur in the different network devices (switches), will
be performed at the SDN controller.
One of the protocols used for communication
between forwarding devices and SDN controller is
OpenFlow (McKeown et al., 2008). OpenFlow
standardizes the process and protocol data unit
comprising what forwarding devices should do
when they do not know how to process a set
FREEController: A Framework for Relative Efficiency Evaluation of Software-Defined Networking Controllers
351

of packets known as a flow, as well as how
SDN-controller sends configuration data to the
forwarding device comprising unknown flows. There
are several controllers compatible with this protocol,
supporting different programming languages, to
which programmers can write programs in order
to define how the SDN network should behave
according to its data traffic (flows).
This network behave programming is possible
since, according the OpenFlow specification, an
OpenFlow switch must provide flow tables. Each
OpenFlow switch’s flow table contains a set of flow
entries and each flow consists of matching rules,
counters and a set of actions that must be applied to
packets belonging to that flow. Thus, programming
network behavior sums up to programm controller to
install, update and remove flow entries at network
switches’ flow tables according to what is expected
to the different kinds of traffic flows.
Briefly, comprising a reactive model (there is
also a pro-active model), the OpenFlow-based SDN
network operates as follows. When a new packet
arrives at the switch there are not matching rules at the
flow table. Thus, this packet is sent to the controller to
be processed. Since processed, controller sends to the
switch a flow rule entry to be matched on new packet
arrivals for this flow.
Anyway, to what matters to this work, it is
important to note that as each switch queries the
controller to receive flow rules for its routing tables,
it is desirable that controller(s) performs properly.
Otherwise, latency becomes a strong performance
issue regarding new flow rules installation.
Therefore, considering all issues comprising
controllers performance, on an SDN deployment, it
is important to choose a controller that is able to
attend the network demand. It is noteworthy consider
that this demand may vary according to the number
of forwarding devices querying the controller, and
the number of distinct flows that pass through these
devices as well as the hardware processing power
provided to the controller.
3.2 Multi-criteria Decision Making
Decision making can be a process comprising
processing information in order to choose something.
Thus, decision making involves criteria and
alternatives to choose from. Criteria corresponds to
info associated with solution problem alternatives.
Alternatives usually represent the different choices
of action available to the decision maker, i.e., the
different possible solutions to a problem. The
criteria usually have different importance and the
alternatives in turn differ in the decision-maker
preference for them on each criterion. To deal with
such tradeoffs and choices we need a way to measure
the problem. Measuring needs a good understanding
of methods of measurement and different scales of
measurement (Triantaphyllou, 2000).
Multi-criteria decision-making methods have
emerged as an important ally for solving problems
presented by scientific, logistics, engineering and
industrial areas. The Multi-criteria Decision
Analysis (MCDA) can be defined as a collection
of methods for matching, classifying and selecting
multiple alternatives having multiple attributes,
whose utilization depends on the construction of a
matrix called assessment matrix or payoff that can
also be called scoreboard (Alhabo and Zhang, 2018).
Among these MCDA methods, Data Envelopment
Analisys (DEA) is suited to present solution to
productivity efficiency problems.
In fact, DEA is a mathematical programming
technique that allows evaluation of productive
efficiency of several Decision-Making Units (DMU).
For this purpose, the available resources are
considered as inputs and obtained results from those
resources as outputs.
DEA technique aims to measure the relative
efficiency of DMUs, considering their input/output
variables/criteria. Each output represents a criterion
to be maximized and each input represents a criterion
to be minimized, in search of the best efficiency.
Moreover, the efficiency frontier generated by DEA is
composed of the DMUs that can be more productive
with less resources, and therefore considered more
efficient comparing with others (Ramanathan, 2003).
DEA method has two orientation models: one
input oriented and one output orientated, depending
on whether one wants to, to minimize or maximize
inputs or outputs, respectively. In the case of input
orientation, what is sought is the maximization of
the output(s). In this case, the corresponding relative
efficiency is given by the ratio of the weighted sum of
outputs to the weighted sum of inputs (Kao, 2014). In
the output-oriented model, goal is to minimize inputs.
In this case, the relative efficiency is given by the ratio
of the weighted sum of input values to the weighted
sum of output values.
In addition to the orientation model, DEA
method makes use of two return of scale models.
Such a concept is related to the proportion of
the output produced relative to the proportion of
input consumed. Thus, the Constant Returns of
Scale (CRS) model indicates that any variation in
entries (Inputs) produces proportional variation in the
Outputs, and it is also known as the CCR model
ICEIS 2019 - 21st International Conference on Enterprise Information Systems
352
- which are the initials of the names of the model
creators Charnes, Cooper and Rhodes (Charnes et al.,
1978). The Variable Returns of Scale (VRS) model
indicates the case where the proportionality between
the variations in inputs and outputs is not maintained,
and it is also known by the initials of the names of its
creators Banker, Charnes and Cooper - BCC (Banker
et al., 1984).
Basically, regardless the orientation model, DEA
method task is to find weights for each variable (input
and output) in the most benevolent manner, provided
that these weights applied to the other DMUs do
not generate a ratio greater than 1. Those DMUs
whose weights for inputs and outputs generate a ratio
between inputs and outputs or between inputs and
outputs, depending on the orientation model, equal
to 1, and applied to other DMUS by restricting to
generate ratios less than or equal to 1, will belong to
the set of the DMUs said at the efficiency frontier.
In order to choose one of these models, both CCR
and BCC, it is necessary that the input and output
variables be well defined and modeled. They should
represent the abstraction of the problem to be solved,
so the generated results in fact represent the relative
efficiency between DMUs.
4 PROPOSED FRAMEWORK
This section presents FREEController, a framework
for relative efficiency evaluation of SDN controllers.
This section discusses FREEController architecture
and used methods to identify which SDN controllers
more efficiently attend the network demand.
Moreover, it also presents a tie-breaking mechanism
to choose among those efficient controllers the one
most efficient.
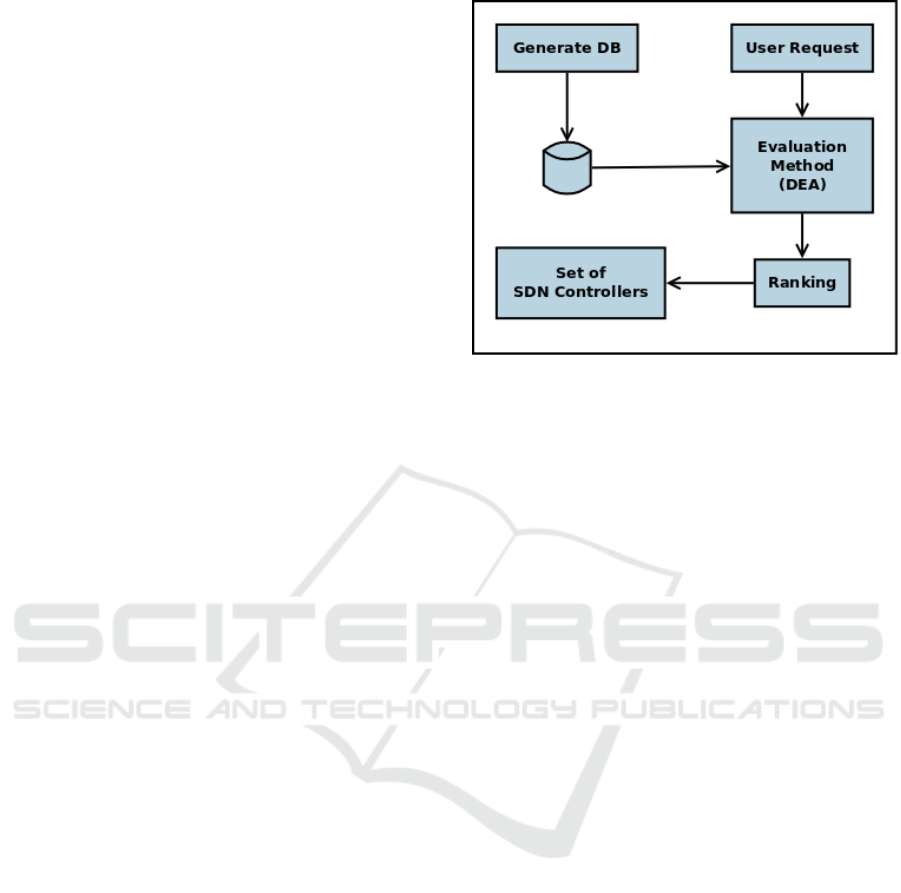
Figure 1 gives an overview of the FREEController
architecture. Its components and their functionalities
as well as their operation process are discussed on the
next sections.
4.1 Database Creation
In order to perform FREEController’s functionality,
the first need is the input data. In this case, these data
come from controllers who are candidates to attend
to users’ requests. More specifically, and aligned
with the objective of defining among those candidates
the ones with the highest relative efficiency based on
DEA method’s use, such data must be about their
performance. Therefore, to FREEController be able
to use these data, a database must be constructed.
This database stores results of performance evaluation
Figure 1: FREEController Architecture.
of the several different candidate controllers. In
fact, with these data, FAEController after some data
aggregation and customer request manipulation, will
be able to score every candidate controllers’ relative
efficiency using DEA method.
This performance evaluation aims to gather
information that can be used as values for input
and output variables to feed DEA method. Thus,
two main performance questions guide performance
evaluation experiments aiming at defining metrics
that can be used by DEA: How fast can the controller
respond to a request? And, how many requests per
second are answered? (Tootoonchian et al., 2012).
These questions can be answered by measuring the
controllers’ latency and throughput, respectively.
Some factors can affect these measurements, such
as the controller’s used processing cores number. This
factor points out to the hardware influence on the
controller and justifies itself since with more CPU
cores, the greater the number of controller requests
that can simultaneously be answered. Also, another
factor comprises the amout of SDN switches in the
network topology. It can also influences performance
results, since the more devices that forward flows,
the more complex the network, and the greater the
tendency to increase the load on the controller. In this
sense, controllers performance database must take
into account (store) latency and throughput according
to varied scenarios, where there is a difference in the
number of processor cores, as well as the amount of
SDN switches involved in the network topology.
To perform measurements related to the
mentioned performance metrics, cbench software
tool (Sherwood and Kok-Kiong, 2010) was used.
It is a tool for testing OpenFlow controllers, i.e., a
controller benchmarker. It provides a benchmark
by means of the generation of OpenFlow packet-in
FREEController: A Framework for Relative Efficiency Evaluation of Software-Defined Networking Controllers
353

events in the controller (packet-in events) for
new dynamically created flows. To execute the
benchmark, cbench emulates a set of OpenFlow
switches that connect to the controller and
send OpenFlow packet-in messages, waiting
for controller’s sent OpenFlow returning flow
installation messages (flow-mods). This tool already
has been used in several controller performance
tests (Tootoonchian et al., 2012; Shalimov et al.,
2013). In the particular case of generating the
controllers performance database, cbench was
executed in two modes: a) latency mode, where
it sends only one packet-in message at a time in
order to obtain the controller latency value and, b)
throughput mode, where several in-parallel packet-in
messages are sent to obtain the controller throughput
value. Comprising latency, measurement result is
inverted (result
−1
). This is needed since cbench
always renders results in flows per second. Thus, to
obtain the time lapse for each flow (latency), flows
per second should becomes seconds per flow.
Since controller performance measurement
happens in a roughly controlled environment, some
other process or the operating system itself may
interfere with the measurements. In this way,
statistical techniques such as removal of outliers
can be used to remove these possible interferences
allowing to use the arithmetic mean of the remaining
measurements as the reference value. However, in
cases where the measurement is done on the hardware
and operating system that will be used in production,
this step can be ignored as these interferences will
appear in production as well.
4.2 User Request
In order to perform the identification of the controllers
that attend the network demand, it is necessary to
describe this demand. Therefore, the user must
inform the FREEController of the amount of switches
present in the network, the maximum latency and
the minimum expected throughput of the controller.
These criteria, as already discussed, represent the
main characteristics associated to performance, and
consequently to the efficiency of SDN controllers
based on OpenFlow protocol.
Values to these criteria must be provided by user
as a request according Figure 1. These data along
with data coming from the controllers performance
database are used altogether to give value to input and
output DEA variables.
Particularly, the user informed amount of switches
in its request is relevant to the identification on the
database generated by the cbench performance tests,
of those results with the specific network size.
On the other hand, user desired latency and
throughput values are used, along with those criteria
values available in the controller’s performance
database, to generate values for the DEA method’s
output variables. These output variable values along
with the input variable values are used by DEA
to calculate the efficiency frontier among candidate
controllers under evaluation.
4.3 Relative Efficiency Assessment
Relative efficiency is calculated to each candidate
controller by DEA method. This process occurs in a
pairwise comparison with every candidate controller
for each one being evaluated. At the end, all
candidates are evaluated. This process aims to
establish the efficiency frontier, that is, those DMUs
(controllers in this case) that are considered 100%
efficient compared to the others will be the best
classified, enabling them to belong to this reference
line.
Thus, in this work, to the relative efficiency
evaluation, firstly, each combination of controller
with the number of cores made available to its
execution is identified as a DMU. For example, let
suppose the existence of POX controller developed in
Python 2, which runs on a machine with multi-core
availability. The controller version that uses only
1 core is considered for all efficiency evaluation
purposes a different DMU from another one of the
same controller version but using 2 or 3, or 4, etc.,
cores. This is taken into account since assigning
more resources to a controller enables it to attend
the user/network needs demanded according to its
scalability, thus making available several different
controllers’ choice options.
Moreover, the correct identification of which
input and output variables associated with DMUs
will be used by DEA is an essential step in the
proper relative efficiency evaluation. Therefore,
considering the presumed relationship between
controller performance and relative efficiency, the
following input and output variables are considered
for the DEA method.
Input Variables: (criteria to minimize):
1. Cores: represents the amount of cores used by
the controller and available in the controllers
performance database.
2. Latency: latency value, in milliseconds,
previously measured and available in the
controllers performance database to a particular
controller.
ICEIS 2019 - 21st International Conference on Enterprise Information Systems
354

3. Throughput: throughput value previously
measured given in flows per second, available
in the controllers performance database. In
fact, this input variable value used by DEA
should correspond to the inverse of throughput
value. This transformation is necessary since
high measured throughput values represent
better performance. However, as input to DEA,
since we want to minimize such input variables,
lower values are better. Thereby, the controller
that presents the highest throughput rate, when
inverted, will present the lowest input value for
throughput.
Output Variables: (criteria to maximize):
1. Adaptability: adaptability value represents
whether the controller attends user’s requested
values.
2. Leftovers: leftovers value represents how much
the controller can have latency increasing, how
much throughput reducing and still to attend the
user’s request values.
The input variable values used by DEA method
correspond to those stored in the controllers
performance database, for each DMU (controller
evaluated with different amounts of cores used).
Thereby, Ld
i
and
1
T d
i
represent latency value of the
controller i and the inverse of throughput value of the
controller i, respectively.
Equation 1 represents how the output variable
Adaptabilitty (A) is calculated. In this case, the
adaptability of a controller i corresponds to 1, if
latency of that controller (Ld
i
), available in the
controllers performance database, is less than or equal
to the maximum latency desired by user (Lu) and
throughput of that controller (T d
i
), available in the
controllers performance database, is greater than or
equal to the minimum throughput desired by user
(Tu).
A(i) =
(
1, if (Ld
i
≤ Lu) and (T d
i
≥ Tu)
0, otherwise
(1)
Where i = 1, 2,..., n (number of controllers using
different amount of CPU cores, present in the
controllers performance database).
Equation 2 represents how the Leftovers output
variable (LO) is calculated. In this case, the leftover
of a controller i is the average of its latency leftover
and its throughput leftover.
LOL(i) =
(
Lu−Ld
i
max(Ld)
if Ld
i
< Lu
0 otherwise
LOT (i) =
(
T d
i
−Tu
max(T d)
if T d
i
> Tu
0 otherwise
LO(i) =
LOL(i) + LOT (i)
2
(2)
It is important to note that for this work, the
DEA output orientation was used, since it intents to
minimize input values
1
since the user request affects
exclusively the DEA output values. Also, the variable
returns of scale model (VRS) was used. This model
is adopted because of the acknowledgment that the
controllers scalability may not be linear (constant)
based on the amount of resources available to them.
4.4 Controllers Ranking
Since the efficiency frontier has been calculated by
the DEA method generating the set of controllers
100% efficients, one can use strategies to refine
results. For this work, the strategy proposed aims
to reduce this set comprising the smaller number
of resources required or used for the controllers
execution. In this case, the controller’s amount of
CPU cores used is this resource. Hence, among those
DMUs in the efficiency frontier that repeat the same
controller, those that use the least number of cores
are filtered, establishing themselves as those that best
attend the user needs.
In case of a new results refinement’s need, such
as establishing the most efficient of those controllers
identified as ones that best serve user, a controllers’
ranking can be performed.
The controllers ranking used in this work takes
into account the ascending order based on the
controllers amount of CPU cores used. This
ranking strategy is applied on the efficiency frontier
previously filtered controllers. In case of a tie, the
criterion used to tie-breaking is the leftovers value at
descending order. Thus, controllers that attend the
user request with the least amount of resources and
that have the largest leftovers for the growth of the
network are first ensured. Tie persisting, controller
with less latency is ranked in ascending order and at
last, when there are no longer any criteria to be used,
controllers name alphabetical ascending order can be
used.
1
previously measured performance controller values
available in the controllers performance database
FREEController: A Framework for Relative Efficiency Evaluation of Software-Defined Networking Controllers
355

5 EXPERIMENTS AND RESULTS
In order to perform a FREEController evaluation
it was selected some popular SDN controllers,
with which the controllers performance database
was generated. They are: POX (Kaur et al.,
2014), Ryu (Wang et al., 2015), Trema (tre, )
and Floodlight (flo, ). Beyound being populars,
these controllers were chosen due to their source
code availability, easiness of instalation, use and
configuration, as well as being able to execute on
the machine used to the experiments. Moreover,
POX was chosen as a reference implementation,
while Ryu, Trema and Floodlight were chosen to
represent controllers written in Python, Ruby and Java
languages, respectively.
Performance of POX and Ryu were measured
using different interpreters and their versions. Thus,
Python 2 and PyPy (Rigo and Pedroni, 2006) were
used for both, POX and Ryu cases, and also Python 3
for Ryu’s case, according to their compatibilities.
In order to capture the latency and throughput
metric values, controllers executed the network’s
Layer 2 learning logic, that is, adding flow rules
to OpenFlow switches to work as legacy traditional
switches. In this case, packets generated with random
destination addresses are sent to the controller that
in turn associates the source address with the cbench
simulated switch’s entry port, responding with a flow
rule whether the destination address has already been
associated with some cbench switch’s port, or with
network flooding, otherwise. This Layer 2 learning
choice was made due to the need to test the controller
performance executing some logic. The adopted one
is similar to the adopted in work (Tootoonchian et al.,
2012).
Performance tests were performed executing
controllers in a virtual machine, due to the possibility
of changing the amount of controller usable CPU
cores. The used physical machine has Intel Core
i7-7700 processor at 3.6 GHz, with 16 GB of RAM.
Linux Debian 9.5 operating system was installed on
the virtual machine providing 8 GB of memory. Each
controller performance test was performed with 1, 2,
3 and 4 cores.
As aforementioned, controllers performance
experiments were performed using cbench.
Particularly, it was executed 100 latency
measurements and 100 throughput measurements,
on a simulated network composed of 16 switches
with 48 different hosts each. These measurements
were performed for each DMU
2
. In order to remove
2
in this case, the combination of controller and amount
of CPU cores used, as aforementioned
the interferences, measurement results identified
as outliers were discarded and the remaining
measurements arithmetic mean is calculated and
stored at controllers performance database.
Table 1 presents obtained results comprising
performance tests, that are stored in controllers
performance database for FREEController validation.
These are also data used in other FREEController
processes described in this section.
Table 1: Cbench measured data for 16 switches.
Controller Cores Latency Throughput
POX (Python 2) 1 0.209952 13.219172
POX (Python 2) 2 0.072137 13.246115
POX (Python 2) 3 0.075551 14.323165
POX (Python 2) 4 0.075354 13.880530
POX (PyPy) 1 0.035505 69.804389
POX (PyPy) 2 0.007123 285.776677
POX (PyPy) 3 0.007176 289.062035
POX (PyPy) 4 0.007112 284.139895
Ryu (Python 2) 1 0.236664 9.061476
Ryu (Python 2) 2 0.097588 9.545206
Ryu (Python 2) 3 0.097656 9.713817
Ryu (Python 2) 4 0.097630 9.701102
Ryu (Python 3) 1 0.226180 9.585524
Ryu (Python 3) 2 0.092931 10.797203
Ryu (Python 3) 3 0.093031 10.233246
Ryu (Python 3) 4 0.092149 10.454725
Ryu (PyPy) 1 0.099318 27.761848
Ryu (PyPy) 2 0.027127 33.421534
Ryu (PyPy) 3 0.027171 33.656810
Ryu (PyPy) 4 0.027035 33.968769
Trema 1 2.888911 0.445128
Trema 2 2.558057 0.432696
Trema 3 2.502715 0.439842
Trema 4 2.447152 0.379306
Floodlight 1 0.029674 36.927477
Floodlight 2 0.016519 173.795245
Floodlight 3 0.013085 334.945672
Floodlight 4 0.010105 300.159932
For the user’s request, three different requests
were simulated with values as can be seen in Table 2.
The first requisition is considered the easiest one to
be attended, whereas request 2 and 3 are considered
medium and difficult, respectively. In these cases,
maximum latency (ms) desired by user is 0.3, 0.1
and 0.02, respectively for each request. Minimum
throughput values (flows/s) desired by user are: 8, 30
and 300, respectively. Amount of switches is the same
(16) for each request, since it is intended to observe
FREEController behavior by varying only the latency
and threshold requested values. If amount of switches
is changed, each request would require a different set
of controller performance results in the controllers
performance database, as the network size changes.
Thus, according to the FREEController
ICEIS 2019 - 21st International Conference on Enterprise Information Systems
356

Table 3: DEA input and output values used.
Request 1 Request 2 Request 3
Input Variables Output Variables Output Variables Output Variables
Controller Cores Latency Throughput Adapt. Left. Adapt. Left. Adapt. Left.
POX (Python 2) 1 0.209952 0.075647 1 0.023376 0 0.000000 0 0.000000
POX (Python 2) 2 0.072137 0.075493 1 0.047268 0 0.004822 0 0.000000
POX (Python 2) 3 0.075551 0.069816 1 0.048285 0 0.004231 0 0.000000
POX (Python 2) 4 0.075354 0.072043 1 0.047658 0 0.004265 0 0.000000
POX (PyPy) 1 0.035505 0.014325 1 0.138037 1 0.070581 0 0.000000
POX (PyPy) 2 0.007123 0.003499 1 0.465349 1 0.397892 0 0.002228
POX (PyPy) 3 0.007176 0.003459 1 0.470244 1 0.402788 0 0.002219
POX (PyPy) 4 0.007112 0.003519 1 0.462907 1 0.395451 0 0.002230
Ryu (Python 2) 1 0.236664 0.110357 1 0.012546 0 0.000000 0 0.000000
Ryu (Python 2) 2 0.097588 0.104764 1 0.037339 0 0.000417 0 0.000000
Ryu (Python 2) 3 0.097656 0.102946 1 0.037579 0 0.000405 0 0.000000
Ryu (Python 2) 4 0.097630 0.103081 1 0.037564 0 0.000410 0 0.000000
Ryu (Python 3) 1 0.226180 0.104323 1 0.015143 0 0.000000 0 0.000000
Ryu (Python 3) 2 0.092931 0.092616 1 0.040014 0 0.001223 0 0.000000
Ryu (Python 3) 3 0.093031 0.097720 1 0.039154 0 0.001205 0 0.000000
Ryu (Python 3) 4 0.092149 0.095650 1 0.039638 0 0.001358 0 0.000000
Ryu (PyPy) 1 0.099318 0.036020 1 0.064233 0 0.000118 0 0.000000
Ryu (PyPy) 2 0.027127 0.029920 1 0.085176 1 0.017720 0 0.000000
Ryu (PyPy) 3 0.027171 0.029711 1 0.085519 1 0.018063 0 0.000000
Ryu (PyPy) 4 0.027035 0.029438 1 0.086009 1 0.018552 0 0.000000
Trema 1 2.888911 2.246540 0 0.000000 0 0.000000 0 0.000000
Trema 2 2.558057 2.311090 0 0.000000 0 0.000000 0 0.000000
Trema 3 2.502715 2.273542 0 0.000000 0 0.000000 0 0.000000
Trema 4 2.447152 2.636393 0 0.000000 0 0.000000 0 0.000000
Floodlight 1 0.029674 0.027080 1 0.089969 1 0.022512 0 0.000000
Floodlight 2 0.016519 0.005753 1 0.296559 1 0.229102 0 0.000602
Floodlight 3 0.013085 0.002985 1 0.537715 1 0.470259 1 0.053362
Floodlight 4 0.010105 0.003331 1 0.486304 1 0.418847 1 0.001951
Table 2: FREEController user requested criteria and values.
Request Switches Latency Throughput
1 16 0.3 8
2 16 0.1 30
3 16 0.02 300
architecture, in possession of the controllers
performance database and the user request, next step
is to obtain the input and output variable values,
according to Subsection 4.3 and Equations 1 and 2.
Hence, Table 3 presents input and output values used
by DEA method according to user requests.
Thus, with the available input (Latency,
Throughput) and output (Adapt. for Adaptability and
Left. for Leftovers) variable’s values, DEA method
was executed for each request, using R Language’s
Benchmarking package (Bogetoft and Otto, 2018).
Table 4 shows resulting values. It is worth noting
that the efficiency frontier is made up of controllers
whose efficiency value (Eff) equals 1.
Controllers ranking execution as proposed leads to
the result also seen in Table 4.
Comprising these results, first noteworthy thing is
that controllers that cannot fulfill the request receive
the infinite negative value and will never be classified
as efficient (never will be in the efficiency frontier).
Particularly, in the case of request 1, all controllers
were identified as efficient, except for Trema, since
this request had easily attainable performance values.
However, Trema is the only one that can not reach
these values, independently of the amount of CPU
cores used/tested. As all other controllers are in
the efficiency frontier, proposed ranking is performed
allowing an ascending ordering based on colunm Rk
(ranking).
In case of request 2, it is possible to visualize
that only controllers that can satisfy the request
(A(i) = 1) are classified as efficient. Controllers
that achieved efficiency greater than 1 could only
attend latency or throughput, and therefore were not
classified as efficient. This is a similar behavior to
what would happen if a simple filter on the controllers
performance database is applied thereby returning
only controllers that can fulfill the request. However,
this points out that in fact the approach based on
relative efficiency modeled is correct. It is also
observed that Ryu running with PyPy interpreter
requires at least 2 CPU cores to attend the request,
FREEController: A Framework for Relative Efficiency Evaluation of Software-Defined Networking Controllers
357

Table 4: DEA efficiency frontier results.
DMU Request 1 Request 2 Request 3
Controller Cores Eff Rk Eff Rk Eff Rk
Pox (Python 2) 1 1.00000 4 −∞ −∞
Pox (Python 2) 2 1.00000 82.51051 −∞
Pox (Python 2) 3 1.00000 111.13612 −∞
Pox (Python 2) 4 1.00000 110.24839 −∞
Pox (PyPy) 1 1.00000 1 1.00000 1 −∞
Pox (PyPy) 2 1.00000 1.00000 1.00000 1
Pox (PyPy) 3 1.00000 1.00000 1.00000
Pox (PyPy) 4 1.00000 1.00000 1.00000
Ryu (Python 2) 1 1.00000 6 −∞ −∞
Ryu (Python 2) 2 1.00000 953.34174 −∞
Ryu (Python 2) 3 1.00000 1159.34492 −∞
Ryu (Python 2) 4 1.00000 1146.54997 −∞
Ryu (Python 3) 1 1.00000 5 −∞ −∞
Ryu (Python 3) 2 1.00000 325.22372 −∞
Ryu (Python 3) 3 1.00000 389.93443 −∞
Ryu (Python 3) 4 1.00000 346.09278 −∞
Ryu (PyPy) 1 1.00000 3 597.96929 −∞
Ryu (PyPy) 2 1.00000 1.00000 3 −∞
Ryu (PyPy) 3 1.00000 1.00000 −∞
Ryu (PyPy) 4 1.00000 1.00000 −∞
Trema 1 −∞ −∞ −∞
Trema 2 −∞ −∞ −∞
Trema 3 −∞ −∞ −∞
Trema 4 −∞ −∞ −∞
Floodlight 1 1.00000 2 1.00000 2 −∞
Floodlight 2 1.00000 1.00000 21.45012
Floodlight 3 1.00000 1.00000 1.00000 2
Floodlight 4 1.00000 1.00000 1.00000
while other controllers classified as efficient need
only 1. On the other hand, neither Ryu executing
on Python 2 and 3 interpreters can be classified as
efficient on this request.
The request 2 observed results behavior repeats
itself in a similar way in request 3, though excluding
more controllers and requiring more CPU cores to
attend the request. This reflects what is expected
when it is used more restrictive performance values
in the user request.
6 FINAL CONSIDERATIONS
This work proposed FREEController. It is a
relative efficiency evaluation framework of
SDN controllers, ranging from the controllers
performance measurement to the identification of
which controllers can efficiently attend the network
demand requested by a user. FREEController uses
controllers performance measured values and the
Data Envelopment Analysis (DEA) multicriteria
decision-making method to accomplish its goal.
The FREEController obtained evaluation results
indicate that the approach based on relative efficiency
is consistent with the performance evaluation of
controllers. In addition, it has been observed that
not only controller but the environment in which it
is executed has influence on its performance. This
fact is not discussed in other works that compare
performance of SDN controllers. Therefore, it is
intended to take this issue into account in future work,
as well as adding other evaluation methods to the
FREEController in order to attend the user need.
REFERENCES
Floodlight. http://www.projectfloodlight.org/floodlight/.
Accessed in november, 2018.
Trema. http://trema.github.com/trema/. Accessed in
november, 2018.
Akyildiz, I. F., Lee, A., Wang, P., Luo, M., and Chou, W.
(2014). A roadmap for traffic engineering in sdn-
openflow networks. Computer Networks, 71:1–30.
ICEIS 2019 - 21st International Conference on Enterprise Information Systems
358

Alhabo, M. and Zhang, L. (2018). Multi-Criteria Handover
Using Modified Weighted TOPSIS Methods for Het-
erogeneous Networks. IEEE Access, 6:40547–40558.
Aliyu Lawal Aliyu, Peter Bull, A. A. (2017). Performance
implication and analysis of the openflow sdn proto-
col. 3D Digital Imaging and Modeling, International
Conference on, pages 391–396.
Banker, R. D., Charnes, A., and Cooper, W. W. (1984).
Some models for estimating technical and scale inef-
ficiencies in data envelopment analysis. Management
Science, 30(9):1078–1092.
Basu, K., Younas, M., Tow, A. W. W., and Ball, F.
(2018). Performance comparison of a sdn network be-
tween cloud-based and locally hosted sdn controllers.
In 2018 IEEE Fourth International Conference on
Big Data Computing Service and Applications (Big-
DataService), pages 49–55.
Bogetoft, P. and Otto, L. (2018). Benchmark and
frontier analysis using dea and sfa. https://cran.r-
project.org/web/packages/Benchmarking/Benchmarking.pdf.
Charnes, A., Cooper, W. W., and Rhodes, E. (1978). Mea-
suring the efficiency of decision making units. Euro-
pean journal of operational research, 2(6):429–444.
Cooper, W. W., Seiford, L. M., and Zhu, J. (2004). Data En-
velopment Analysis. In Cooper, W. W., Seiford, L. M.,
and Zhu, J., editors, Handbook on Data Envelopment
Analysis, International Series in Operations Research
& Management Science, pages 1–39. Springer US,
Boston, MA.
de Moraes, L. B., Cirne, P., Matos, F., Parpinelli, R. S.,
and Fiorese, A. (2018). An efficiency frontier based
model for cloud computing provider selection and
ranking. In Proceedings of the 20th International
Conference on Enterprise Information Systems - Vol-
ume 1: ICEIS,, pages 543–554. INSTICC, SciTePress.
Gamess, E., Tovar, D., and Cavadia, A. Design and
Implementation of a Benchmarking Tool for Open-
Flow Controllers. International Journal of Infor-
mation Technology and Computer Science(IJITCS),
10(11):1–13. MECS Press.
Jarschel, M., Lehrieder, F., Magyari, Z., and Pries, R.
(2012). A Flexible OpenFlow-Controller Benchmark.
In 2012 European Workshop on Software Defined Net-
working, pages 48–53.
Jarschel, M., Oechsner, S., Schlosser, D., Pries, R.,
Goll, S., and Tran-Gia, P. (2011). Modeling and
performance evaluation of an openflow architecture.
In Proceedings of the 23rd International Teletraffic
Congress, ITC ’11, pages 1–7. International Teletraf-
fic Congress.
Kao, C. (2014). Network data envelopment analysis: A
review. European journal of operational research,
239(1):1–16.
Kaur, S., Singh, J., and Ghumman, N. S. (2014). Network
programmability using pox controller. In ICCCS In-
ternational Conference on Communication, Comput-
ing & Systems, IEEE, volume 138.
Kreutz, D., Ramos, F. M., Verissimo, P. E., Rothen-
berg, C. E., Azodolmolky, S., and Uhlig, S. (2015).
Software-defined networking: A comprehensive sur-
vey. Proceedings of the IEEE, 103(1):14–76.
Lantz, B., Heller, B., and McKeown, N. (2010). A Network
in a Laptop: Rapid Prototyping for Software-defined
Networks. In Proceedings of the 9th ACM SIGCOMM
Workshop on Hot Topics in Networks, Hotnets-IX,
pages 19:1–19:6, New York, NY, USA. ACM.
Li, H., Guo, S., Wu, C., and Li, J. (2015). Fdrc: Flow-
driven rule caching optimization in software defined
networking. In 2015 IEEE International Conference
on Communications (ICC), pages 5777–5782. IEEE.
Lim, D.-J. (2018). Technology forecasting using DEA in
the presence of infeasibility. International Transac-
tions in Operational Research, 25(5):1695–1706.
Mamushiane, L., Lysko, A., and Dlamini, S. (2018). A
comparative evaluation of the performance of popular
SDN controllers. In 2018 Wireless Days (WD), pages
54–59.
Maziku, H., Shetty, S., Jin, D., Kamhoua, C., Njilla, L.,
and Kwiat, K. (2018). Diversity Modeling to Evaluate
Security of Multiple SDN Controllers. In 2018 Inter-
national Conference on Computing, Networking and
Communications (ICNC), pages 344–348.
McKeown, N., Anderson, T., Balakrishnan, H., Parulkar,
G., Peterson, L., Rexford, J., Shenker, S., and Turner,
J. (2008). Openflow: enabling innovation in campus
networks. ACM SIGCOMM Computer Communica-
tion Review, 38(2):69–74.
Muelas, D., Ramos, J., and Vergara, J. E. L. d. V.
(2018). Assessing the Limits of Mininet-Based En-
vironments for Network Experimentation. IEEE Net-
work, 32(6):168–176.
Park, S. C. and Lee, J. H. (2018). Supplier selection and
stepwise benchmarking: a new hybrid model using
DEA and AHP based on cluster analysis. Journal of
the Operational Research Society, 69(3):449–466.
Ramanathan, R. (2003). An introduction to data envelop-
ment analysis: a tool for performance measurement.
Sage.
Rigo, A. and Pedroni, S. (2006). Pypy’s approach to
virtual machine construction. In Companion to the
21st ACM SIGPLAN symposium on Object-oriented
programming systems, languages, and applications,
pages 944–953. ACM.
Shalimov, A., Zuikov, D., Zimarina, D., Pashkov, V.,
and Smeliansky, R. (2013). Advanced study of
sdn/openflow controllers. In Proceedings of the 9th
central & eastern european software engineering con-
ference in russia, page 1. ACM.
Sherwood, R. and Kok-Kiong, Y. (2010). Cbench:
an open-flow controller benchmarker. URL
http://archive.openflow.org/wk/index.php/Oflops.
Stolzer, A. J., Friend, M. A., Truong, D., Tuccio, W. A., and
Aguiar, M. (2018). Measuring and evaluating safety
management system effectiveness using Data Envel-
opment Analysis. Safety Science, 104:55–69.
Tootoonchian, A., Gorbunov, S., Ganjali, Y., Casado, M.,
and Sherwood, R. (2012). On controller performance
in software-defined networks. Hot-ICE, 12:1–6.
FREEController: A Framework for Relative Efficiency Evaluation of Software-Defined Networking Controllers
359

Triantaphyllou, E. (2000). Multi-criteria Decision Making
Methods: A Comparative Study. Applied Optimiza-
tion. Springer US.
Turull, D., Hidell, M., and Sj
¨
odin, P. (2014). Performance
evaluation of openflow controllers for network virtual-
ization. In 2014 IEEE 15th International Conference
on High Performance Switching and Routing (HPSR),
pages 50–56.
Wang, S.-Y., Chiu, H.-W., and Chou, C.-L. (2015). Com-
parisons of sdn openflow controllers over estinet: Ryu
vs. nox. ICN 2015, page 256.
Zhou, H., Yang, Y., Chen, Y., and Zhu, J. (2018). Data en-
velopment analysis application in sustainability: The
origins, development and future directions. European
Journal of Operational Research, 264(1):1–16.
ICEIS 2019 - 21st International Conference on Enterprise Information Systems
360
