The Study of Discrimination of Remotely Sensed Data for Designing
the Separation Technique between Cassava and Sugarcane Farmland
Anuphao Aobpaet
a
and Soravis Supavetch
Department of Civil Engineering, Kasetsart University, Bangkok, Thailand
Keywords: Cassava, Sugarcane, Remote Sensing for Agriculture.
Abstract: Cassava and sugarcane are the most important agricultural crops in Thailand. The cultivations of those are
similarly in crop season, natural resources, and climate. For decades, the farmers usually switch their plant
depending on unit price and government subsidy. The use of remote sensing data for monitoring change in
farmland has encountered a problem on the similarity of vegetation index and the seasonal variation. In this
work, we investigate the significant differences between cassava and sugarcane plantation by using satellite
data from two sensors systems (Optical and SAR sensor) from Sentinel-1 and Sentinel-2 satellites. The result
of the sampling fields of cassava shows the fluctuation of the growth and the mean of SAVI is slightly lower
than sugarcane at the same age. SAVI values over the cassava farmland seem to approach the homogeneity
of sugarcane when the age of more than 11 months. Thus, the difference between cassava and sugarcane
farmland using this method should be investigated on the growth stage of the age between 4-9 months. For
SAR polarization, the VV, VH of SAR backscatters have little difference in cassava and sugarcane. When
compare the backscatters value of VV and VH from cassava and sugarcane, the sigma0 values in dB show
that VV backscatters have a higher signal return. The variation of VH polarization of cassava and sugarcane
seem difficult to identify due to the diversity of signal targets. Therefore, by using SAR data, the detection of
the difference between cassava and sugarcane should be considered after working on time series techniques
for crop seasoning to remove unwanted objects until only cassava and sugarcane remain. From the results, we
also found that the parcel-based method is a better processing approach to separate cassava from sugarcane
compared to pixel-based, and it requires descriptive statistics to distinguish between cassava and sugarcane
at each age. This method requires the information of two agricultural plantations boundaries. The possible
handling process when harvesting and preparation of the plantation are by observing time-related over an area
to determine the boundary of the farmland. Therefore, the discrimination of remotely sensed data for designing
the decomposition technique between cassava and sugarcane farmland is necessary because of the specificity
of cultivation in Thailand.
1 INTRODUCTION
The Ministry of Agriculture and Cooperatives also
announce the policy to reform Thailand's agricultural
sector mainly focuses on seven areas. The first area is
agricultural zoning to a suitable geographical and
climatic condition. The second area is the
establishment of learning centres for increasing the
efficiency of the agricultural product. The third area
is a grouping of farmers and farmland for better
efficiency. The fourth area is seeking the encourage
farmers producing in response to the market demand.
The fifth area set up the banks for agricultural
a
https://orcid.org/0000-0001-7638-853X
products through the grouping of farmers. The sixth
area is seeking to promote working as a team through
the "single command" system in order to translate the
reform plan into action. The seventh area is the
reduction of agricultural production costs. In the case
of cassava and sugarcane, the factor of success policy
is based on the monitoring of cultivation behaviour of
the farmers. In recent years, Earth Observation
Satellite (EOS) is a powerful tool for constantly
assessing the status of agricultural production on a
wide range of spatial and temporal scales. It provides
time series data and can rapidly reveal where change
has happened in a consistent and repeatable manner.
Aobpaet, A. and Supavetch, S.
The Study of Discrimination of Remotely Sensed Data for Designing the Separation Technique between Cassava and Sugarcane Farmland.
DOI: 10.5220/0007748102670273
In Proceedings of the 5th International Conference on Geographical Information Systems Theory, Applications and Management (GISTAM 2019), pages 267-273
ISBN: 978-989-758-371-1
Copyright
c
2019 by SCITEPRESS – Science and Technology Publications, Lda. All rights reserved
267
Information from Earth Observation is therefore very
well suited to timely information on cropland
distribution and status at various crop stages.
In a global scale, characteristics of satellite remote
sensing data and processing implementations are
available for the large areas applications such as
forestry, agriculture, fishery, coastal and marine,
environment, disaster mitigation, spatial planning,
and so on. Nevertheless, in a small scale (high
resolution), many factors are relevant due to many
components of the ecological network which are
involved i.e., small pond, farm dike, mixed cropping,
species, soil types, moisture, etc.
In Thailand, the National Statistical Office (2013)
reported that 87.8% of 5.9 million farmers owned
land area lower than 6 ha. However, this small farm
size alone is not only a limiting factor for determining
the productivity (yield) and the homogeneity of the
plant by using spectral reflectance determination.
Moreover, Thai government pay attention to promote
“Philosophy of Sufficiency Economy and New
Theory” in agricultural sector following his Majesty
King Rama 9 suggestion that the farmers are
suggested to divided his land into four parts with a
ratio of 30:30:30:10. The first 30% is designated for
a pond to store rainwater during rainy season. The
second 30% is set aside for rice cultivation during the
rainy season for family’s daily consumption
throughout the year. The third 30% is used for
growing fruit and perennial trees, vegetables, field
crops and herbs for daily consumption. The last 10%
is set aside for accommodation, animal husbandry,
roads, and other structures (The Chaipattana
Foundation, 2017). Thus, these activities made more
complexity on a small farm in term of remotely
sensed data. For an agricultural country such as
Thailand, the implementation of remote sensing
technologies for monitoring and controlling the
government’s policy in agriculture using a field-
based approach is the importance for those
smallholder farmers.
In this study, the cassava and sugarcane are
selected as a feasible crop. The influence of the
successive policy depends on the monitoring of the
cultivation behaviour of the plants following farmers’
decision which sometimes varied and difficult to
identify. The crop growing process of cassava and
sugarcane are likewise in crop season, natural
resources, and climate (Thai Meteorological
Department, 2015), as already mentioned above. The
farmers have their choice to select the plants base on
the unit price and government subsidy made the
difficulty of policy control. The potential on using
remote sensing for farmland monitoring is the
challenge technique due to the fact about the
correspondence of vegetation index term, the
seasonal effect on a reflectance make the signature of
a phenotype cannot be determined. This study used
permitted available data from Sentinel-1 and 2 for
data processing and uses the parcel-based descriptive
statistics in analysing and interpreting the results. In
this stage of the study, we only focus on the technique
for the separation of cassava and sugarcane which
will make possible for crop forecasting in Thailand.
2 OBJECTIVE
As by the location of the country, there is a little
difference in environments as well as the planting
season, so we are unable to classify the agricultural
farmland of both plants by means of single temporal
classification. Therefore, the main objective of this
study is to investigate the significant differences
between cassava and sugarcane plantation by using
satellite data from two sensors systems which are
Optical and SAR sensor from Sentinel-1 and
Sentinel-2 satellites. Both satellites that we applied
are available at no cost and it is possible to develop
the automatic system for future operation.
3 DATA PREPARATION
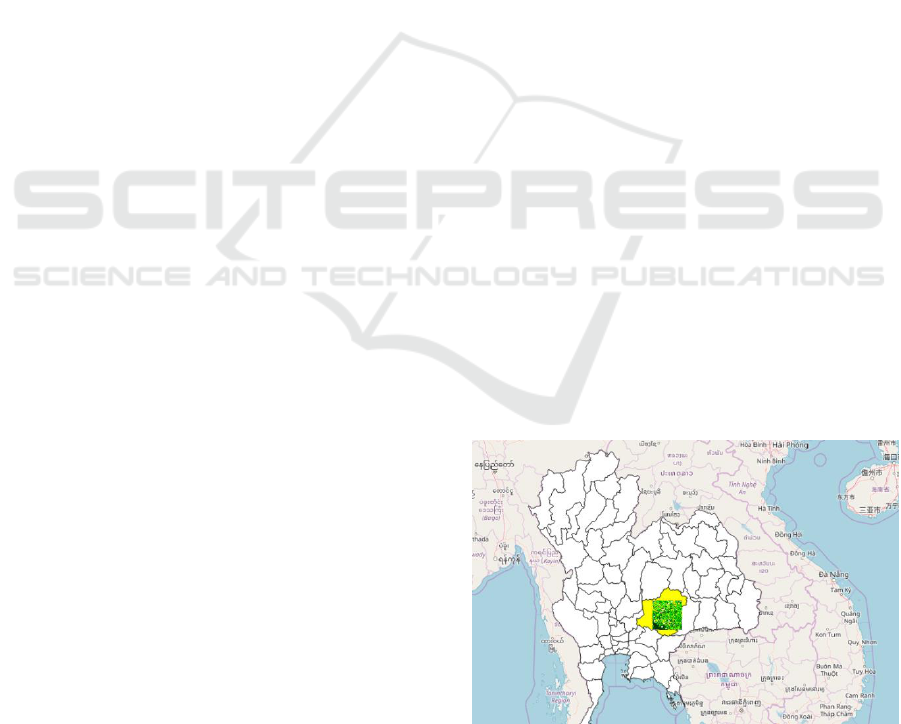
The sampling areas of cassava and sugarcane are
selected in Nakhon Ratchasima province which is the
largest cassava plantations in Thailand (Figure 1).
This province economy has traditionally been heavily
dependent on agriculture which is the production of
rice, tapioca, and sugar.
Figure 1: Nakhon Ratchasima province, the largest cassava
plantations.
GISTAM 2019 - 5th International Conference on Geographical Information Systems Theory, Applications and Management
268
The Sentinel-1 and Sentinel-2 satellites data are
able to access via Copernicus Open Access Hub
(https://scihub.copernicus.eu/) for this investigation
(European Space Agency). Satellite data processing
from Sentinel-1 uses the Orfeo Toolbox software as a
processing tool (Inglada et al., 2009) (Christophe et
al., 2009) (Teodoro et al., 2016). The data
downloaded from the Copernicus Open Access HUB
is in Level-1 Ground Range Detected (GRD) and
Level-1 Single Look Complex (SLC). The processing
step started with the adjustment of the satellite's orbit
value with the most accurate orbit data (precise orbit),
and then apply radiometric correction by calibrating
to adjust the pixel value to backscatter and convert
them to decibel (dB). The data was then filtered using
speckle filter for noise reduction with speckle
filtering which offers many options for filtering as
follows: Boxcar (mean), Median, Frost, Lee (Lee et
al., 1999), Refined Lee, Gamma-MAP, Lee Sigma,
and IDAN, etc.
Subsequently, geometric correction is performed
using the Range Doppler Terrain Correction method
because the terrain pattern along the plane of the
scene and the inclination of the sensor on the satellite
will cause distances in the radar image distorted.
Since, the image data is not always in the middle
position (nadir) of the image sensor; there will be
distortion. Thus, the terrain is corrected to
compensate for these distortions in order to show the
geometric patterns of the image as close to the most
accurate. However, we skip the step for applying
SRTM DEM in height data correction because of the
plane study areas. The image has been corrected
(geocoded) and then subset to the study area and
classify the area features using the statistical values.
The polarization was used to distinguish and display
by mixing polarized colors such as Dual pol multiple
sigma0, Dual pol ratio sigma0, or Dual pol difference
sigma0 depending on appropriateness. In our
investigation, the program was developed to an
automatic SAR data processing using Orfeo Toolbox
together with the python language program for
creating Dual Polarization data in VV and VH that
will be used to study the characteristics of the
backscatter signal from cassava and sugarcane
plantation.
While, the reflectance obtained from the L1C
product of the data from Sentinel-2 is a reflection that
has been mixed with the diffusion effect in the
atmosphere. This information is called Top of
Atmosphere (TOA). Therefore, it is necessary to
adjust and remove the reflection by atmosphere out of
the data set before being used in order to be a
reflection value at the canopy layer (Bottom of
Atmosphere, BOA). The effect of modifying the
atmosphere to bring the reflection in the atmosphere
makes it possible to know the particles in the
atmosphere which makes the additional data layer
called Aerosol Optical Thickness (AOT). When
comparing the reflection values to the results from
adjustment, it is found that the values that have been
removed, such as clouds, shadows of clouds, etc., are
correlated in each band in the same proportion. The
data of the Soil-adjusted vegetation index (SAVI) (Qi
et al., 1994) is an index data that is closer to the crop
and plant health than NDVI (Normalized Difference
Vegetation Index) (Senay et al., 2000) because it has
been modified to reflect the influence of the soil.
Therefore, the SAVI data is an appropriate index to
be applied to the crops such as cassava and sugarcane.
When observed from satellite data, the effect of soil
reflection will be mixed with the sensor's detection
value. Reducing the impact of this soil will result in
more information that reflects evidences about plants.
The calculation of SAVI (Huete, 1988) is calculated
as by equation below using L = 0.48 according to the
recommended values from European Space Agency
(ESA).
SAVI = (1+L)*(NIR-R) / (NIR+R+L)
(1)
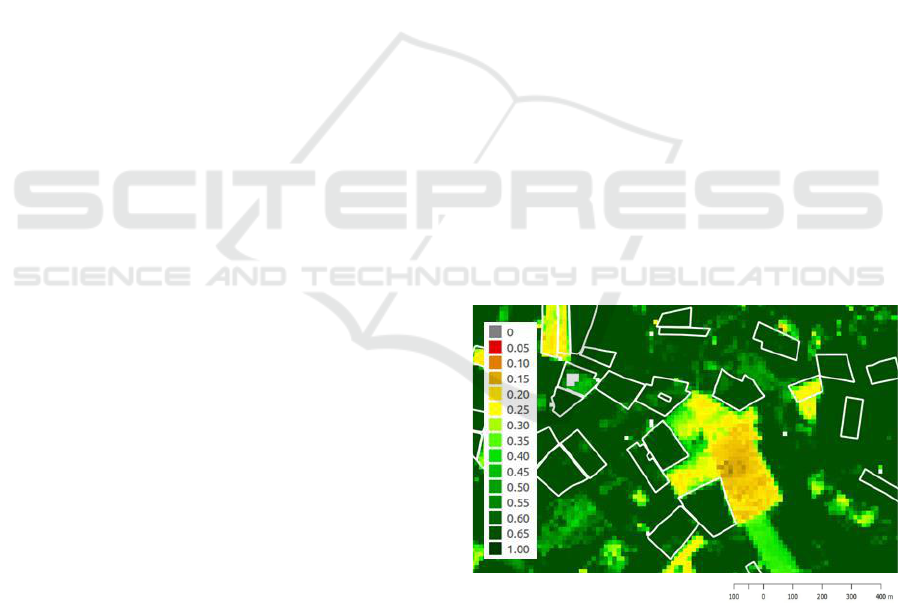
When verified to the cassava plantation area and
define the display with false color combinations, we
will see the data as shown in Figure 2. These time
series data shows the crop stage measurement and the
growing season, respectively.
Figure 2: SAVI information displayed with false color
combinations showing the amount of plant cover (green)
and soil without plants covered (yellow to red colors shade).
4 HYPOTHESIS
From the inspection area, the growth of cassava and
sugarcane taxonomy can be recognized as soil
The Study of Discrimination of Remotely Sensed Data for Designing the Separation Technique between Cassava and Sugarcane Farmland
269
preparation, planting time, and yield period. In
Thailand, there are many species of cassava crop
cultivation. Each type has a leaf size, height varies,
and some types are 2 meters high, some 4 meters tall,
while the sugarcane has a height between 2-5 meters
as well. When both plants are fully grown and yield
8-12 months, the top cover is similar, not significantly
different.
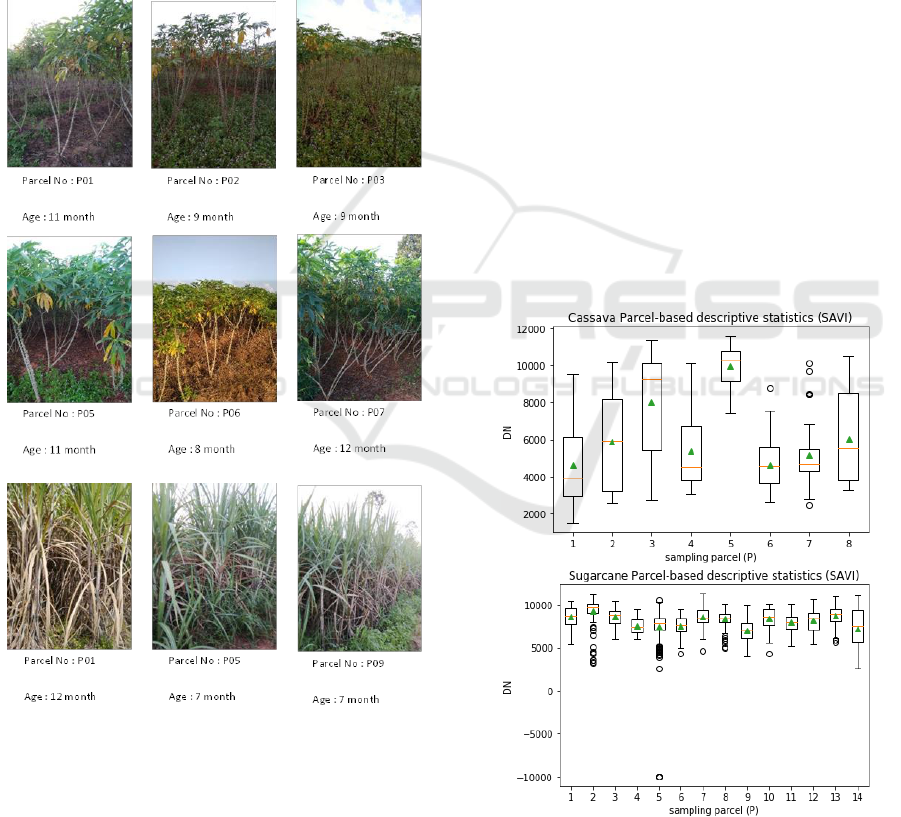
Figure 3: The cassava farmland.
Figure 4: The sugarcane farmland which follows the
“Philosophy of Sufficiency Economy and New Theory”.
In this study, we measured the inspection area
using UAV (Unmanned Aerial Vehicle) to capture a
vertical shot an overlaid with SAVI (Soil-adjusted
vegetation index) and SAR (VV-VH) data. Some
important features that can be hypothesized to find
differences in satellite data between cassava and
sugarcane plants are the growth of cassava (Grown at
the same time in the farmland). It has a variable
appearance according to the environment of the
farmland, rather than the growth of sugarcane (Figure
3 and Figure 4 respectively).
For cassava aged 9-11 months in the sample
farmland in Figure 3, the different heights can be seen
with some little leaves, some plant looks good growth
mixed together while the sugarcane has a relatively
stable growth. Therefore, assuming that cassava at the
same age as sugarcane as shown in figure 4 has a
variation of the LAI (Leaf Area Index) and results in
the plant index or the different altitude of the variable
canopy layer are important to be able to distinguish
between 2 types plantation.
5 METHODOLOGY
The method on building the phenotype from such
time-series of Normalized Difference Vegetation
Index as Savitzky-Golay, Gaussian, Logistic function
and so on, are using the data in a term of pixel-based
time-series for describing the plant's growth. Some
factor such as unstable of a growth rate of the cassava
over the farmland cannot be detected due to the pixel-
based time-series does not demonstrate the spatial
autocorrelation.
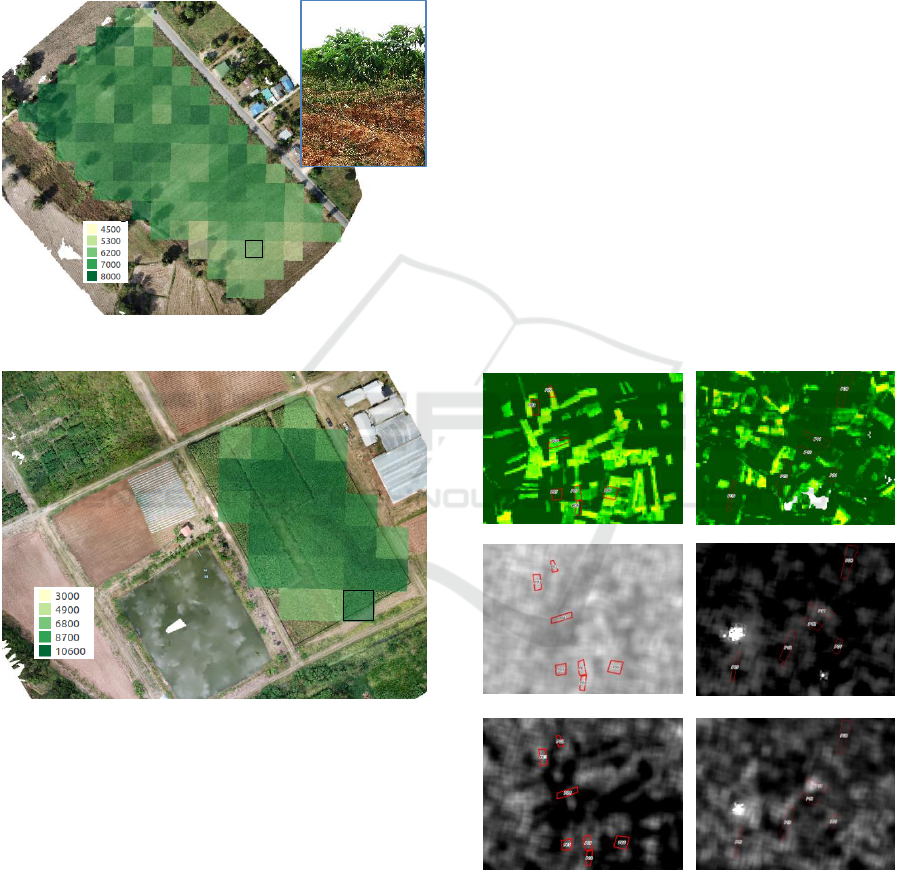
Cassava SAVI
Sugarcane SAVI
Cassava SAR VV
Sugarcane SAR VV
Cassava SAR VH
Sugarcane SAR VH
Figure 5: The 8 samples areas of cassava and sugarcane
with background of SAVI and SAR VV/VH.
Thus, in this research, the parcel-based with the
descriptive statistics is selected for use as the detector
of the homogeneity different between the growth of
cassava and sugarcane over the farm parcel. Soil
20 m
20 m
20 m
20 m
GISTAM 2019 - 5th International Conference on Geographical Information Systems Theory, Applications and Management
270
Adjusted Vegetation Index (SAVI), is used instead of
NDVI for reducing a soil effect in the reflectance,
especially for the field crop in which LAI is a low
value over the growth period. The descriptive
statistics such as min, max, mean, standard deviation,
and percentile are used in the calculation for
demonstrating the homogeneity of the plant's growth
over the farmland. The different of 25 and 75
percentile of the cassava should be more than the
sugarcane following the research hypothesis. The 8
samples of cassava and sugarcane are examined
SAVI and SAR backscatter shown in figure 5.
Cassava
Sugarcane
Figure 6: The images of cassava and sugarcane in difference
growing stage.
Due to the field visit on the harvesting season,
cassava and sugarcane are mostly in the maturity
stage as shown in Figure 6. The density of leaves and
stems of the sugarcane seem to be more than the
cassava in every farmland. The height of cassava is
varied and unequally growth except for the age more
than 12 months due to cassava stop growing on root
after 8 month then leaf and stem are growers at 8-12
months.
6 RESULT AND DISCUSSION
The boxplot of the sampling fields of the cassava in
Figure 7 shows the fluctuation of the growth and the
mean SAVI quite lower than the sugarcane in which
the same age. SAVI values over the farmland seem to
approach homogeneity the same as in sugarcane when
the age of the cassava for more than 11 months. Thus
the detection on the difference of the cassava and
sugarcane farmland using this method should be
investigated on the growth stage that age between 4-
9 months. In our assumption, the physical
characteristics of cassava and sugarcane from start
planting on the farmland is supposed to show some
difference of the backscatter signal when returning
back after reflected the objects. In the investigation,
SAR sensor in VV and VH polarization on board
Sentinel-1 satellite were generated and analysed
using Orfeo and then interpreted with parcel-based
descriptive statistics for cassava and sugarcane crop
separation.
Figure 7: The boxplot of cassava and sugarcane parcel-
based from SAVI.
For SAR polarization in Figure 8, the VV, VH of
SAR backscatters have little difference in cassava and
The Study of Discrimination of Remotely Sensed Data for Designing the Separation Technique between Cassava and Sugarcane Farmland
271
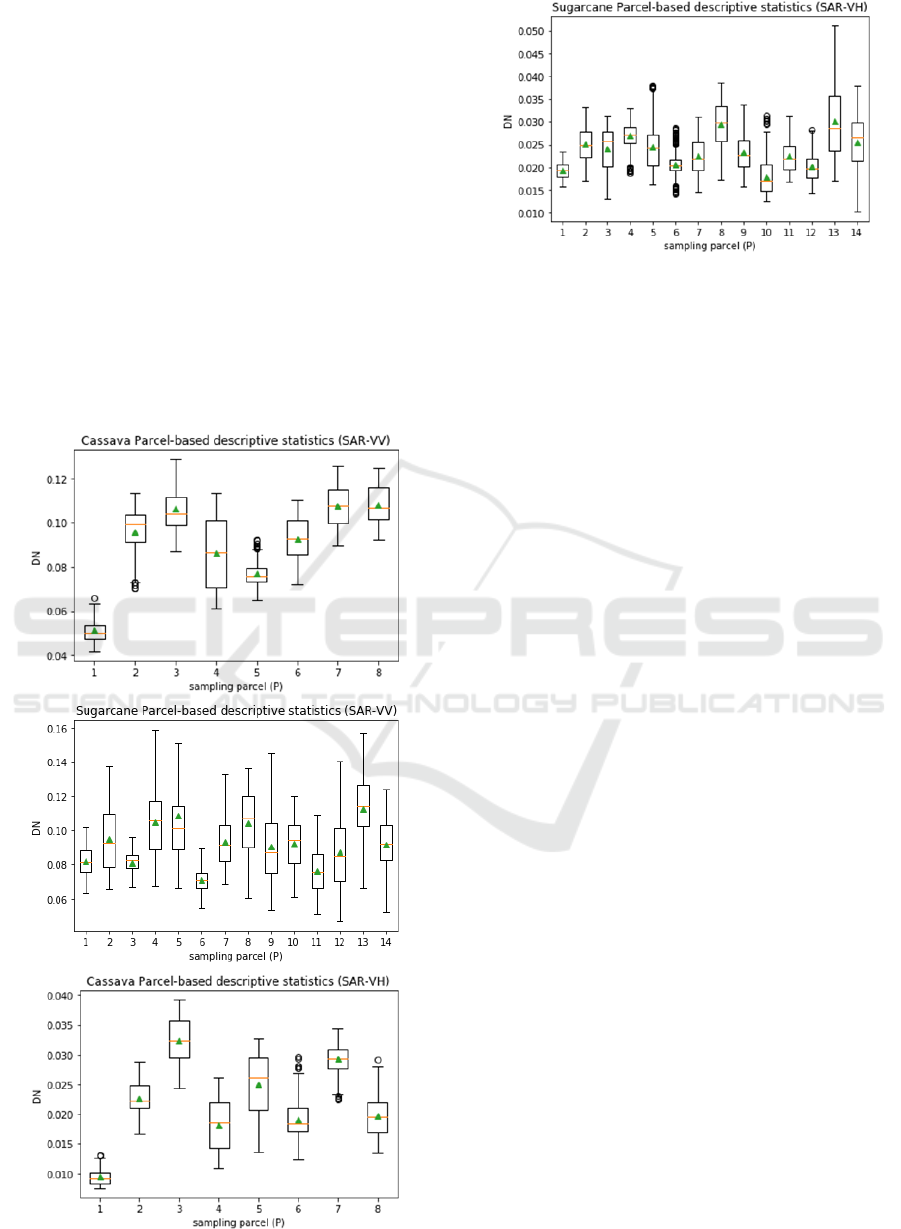
sugarcane. The VV backscatters of sugarcane seem to
have more outlier value due to the better backscatter
compare to VH polarization. When compare the
backscatters of VV and VH from cassava and
sugarcane, the sigma0 value in dB show that VV
backscatters have a higher signal return. The variation
of VH polarization of cassava and sugarcane appear
difficult to identify due to the diversity of the signal
target. Therefore, by using SAR data, the detection on
the difference of the cassava and sugarcane should be
considered after working on time series technique for
the crop season to filter or remove unwanted objects
until only cassava and sugarcane remain. In the next
step of our study, it ought to focus on the Polarimetric
SAR Classification. This technique can provide more
information and a variety of method to calculate on
the structure of farmland which is a function spatial
variation in canopy structure and density.
Figure 8: The boxplot of cassava and sugarcane parcel-
based from SAR VV and VH polarization.
7 RECOMMENDATION
From the results, we found that the parcel-based
method is a better processing tool to separate cassava
from the sugarcane compared to pixel-based, and it
requires descriptive statistics to distinguish between
cassava and sugarcane at each age. This method
requires information on the boundaries of the two
agricultural plantations. The possible handling
process is when the harvesting and preparation of the
plantation by observing time-related over such area to
allow the boundary of the farmland to be determined.
With the assumption that each farmland belongs to a
small farmer, usually harvesting in different periods
of time due to the small amount of labor in the harvest
season compared to the output quantity causing the
need to be in the waiting list for harvesting queue.
Therefore, determining the boundary of the farmland
by using the time series of the cutting tracking data
set will help determine the farmland boundary.
ACKNOWLEDGEMENTS
This work was prepared in the frame of the cassava
crop monitoring project which received research
grants from Kasetsart University Research and
Development Institute, KURDI). The authors
acknowledge the European Space Agency (ESA) for
providing the Sentinel-1 dual polarization images
available online contributed to scientific community.
This work contains modified Copernicus Sentinel
data.
REFERENCES
Christophe, E., Inglada, J. and Giros, A., 2008. Orfeo tool-
GISTAM 2019 - 5th International Conference on Geographical Information Systems Theory, Applications and Management
272

box: a complete solution for mapping from high
resolution satellite images. International Archives of
the Photogrammetry, Remote Sensing and Spatial
Information Sciences, 37(PART B4), pp.1263-1268.
European Space Agency, (n.d.). Open Access Hub.
(European Union) Retrieved 1230 2018, from
https://scihub.copernicus.eu/userguide /ODataAPI.
European Space Agency, (n.d.). ESA Sentinels Help
Monitor Grasslands for Agricultural Subsidy Checks in
Europe. Retrieved 12 25, 2018, from http://www.dhi-
gras.com/news/2017/4/7 /successful-demonstration-of-
using-sentinel-1-and-2.
Huete, A. R., 1988. A soil-adjusted vegetation index
(SAVI). Remote Sensing of Environment, 25(3), 295-
309.
Inglada, J. and Christophe, E., 2009. The Orfeo Toolbox
remote sensing image processing software. In
Geoscience and Remote Sensing Symposium, 2009
IEEE International, IGARSS 2009 (Vol. 4, pp. IV-
733), IEEE.
Lee, J.S., Grunes, M.R. and De Grandi, G., 1999.
Polarimetric SAR speckle filtering and its implication
for classification. IEEE Transactions on Geoscience
and remote sensing, 37(5), pp.2363-2373.
National Statistical Office, 2013. Preliminary Report 2013
Agricultural Census.
Qi, J., Chehbouni, A., Huete, A.R., Kerr, Y.H. and
Sorooshian, S., 1994. A modified soil adjusted
vegetation index. Remote sensing of environment,
48(2), pp.119-126.
Senay, G.B. and Elliott, R.L., 2000. Combining AVHRR-
NDVI and landuse data to describe temporal and spatial
dynamics of vegetation. Forest Ecology and
management, 128(1-2), pp.83-91.
Teodoro, A.C. and Araujo, R., 2016. Comparison of
performance of object-based image analysis techniques
available in open source software (Spring and Orfeo
Toolbox/Monteverdi) considering very high spatial
resolution data. Journal of Applied Remote Sensing,
10(1), p.016011.
Thai Meteorological Department, 2015. The Climate of
Thailand.
The Chaipattana Foundation, 2017. Philosophy of
Sufficiency Economy.
The Study of Discrimination of Remotely Sensed Data for Designing the Separation Technique between Cassava and Sugarcane Farmland
273
