
Socio-economic and Demographic Trends in EU Rural Areas: An
Indicator-based Assessment with LUISA Territorial Modelling
Platform
Carolina Perpiña Castillo, Chris Jacobs-Crisioni, Boyan Kavalov and Carlo Lavalle
European Commission, Joint Research Centre (JRC), Directorate B -Growth and Innovation,
Territorial Development Unit (B3) Via Enrico Fermi 2749I-21027 Ispra (VA), Italy
Carlo.Lavalle@ec.europa.eu
Keywords: Territorial Modelling, Rural Areas, Indicators, Population, Agriculture, Land Abandonment.
Abstract: This work presents an application of the LUISA Territorial modelling platform under the last released
Territorial Reference Scenario 2017. It provides a broad overview of the situation of EU regions from a socio-
economic and demographic point of view with special focus on rural areas. In particular, five indicators were
selected, developed and analysed to better understand current and future spatial patterns and trends with regard
to the rural population, agricultural production systems, agricultural land abandonment, employment and
GVA (Gross Value Added) in the primary sector. The relevant indicators were developed, implemented and
mapped at different level of aggregation (European, national and regional/local) from 2015 to 2030.
Differences and disparities between regions are, then, further analyzed, emphasizing the situation of
predominantly rural regions.
1 INTRODUCTION
Rural areas are very diverse across Europe due to
various geographic, socio-economic and
environmental particularities. Natural and
mountainous zones, rural landscapes, biodiversity
richness, predominant agricultural or forest-related
land uses, abundant natural resources, cultural
traditions and important recreational functions, along
with moderate economic and demographic
development are among the principal characteristics
associated with rural areas.
The economic development of rural regions relies
primarily on local natural resources, environment
quality, and quality of life. The economic growth in
rural regions is mainly due to new activities from the
secondary and tertiary sector such as tourism, food
production, business services, transport and
technology. Primary sector activities typically serve
as a platform for other diversification activities and
employment relies partially on the diversity of local
activities. Moreover, declines in agricultural
employment produce cascade processes affecting
other branches of industry with immediate losses of
jobs and economic decay. Agricultural
intensification, often driven by market forces, leads to
high productivity on more fertile areas with the
consequent marginalisation or abandonment in less
fertile ones. Land abandonment is furthermore
directly linked to population dynamics, especially in
mountainous or remote rural areas, where ageing and
the lack of economic and social opportunities leads to
their decline (Hart et al., 2013; Eurostat, 2013).
During the last decade, all the mentioned aspects
related to Europe‘s rural areas have been at the core
of the European Union (EU) policy debate due to the
importance of rural regions and the different
directions of development that they can take. For a
meaningful debate, understanding of the future of EU
past and future agricultural trends is necessary. The
GIS-based LUISA modelling framework developed
by the European Commission’s Joint Research Centre
is specifically developed to inform such policy
debates. In this context, this study will present results
from LUISA, focusing on key rural and agricultural
trends in an analysis of socio-economic and
demographic characteristics in Europe’s rural
regions.
250
Castillo, C., Jacobs-Crisioni, C., Kavalov, B. and Lavalle, C.
Socio-economic and Demographic Trends in EU Rural Areas: An Indicator-based Assessment with LUISA Territorial Modelling Platform.
DOI: 10.5220/0007739902500258
In Proceedings of the 5th International Conference on Geographical Information Systems Theory, Applications and Management (GISTAM 2019), pages 250-258
ISBN: 978-989-758-371-1
Copyright
c
2019 by SCITEPRESS – Science and Technology Publications, Lda. All rights reserved

2 MODELLING AND ASSESSING
EU RURAL AREAS IN LUISA
This section briefly introduces the main tool used for
this analysis, namely the LUISA Territorial
Modelling Platform. Furthermore, the selected
indicators (rural population, employment and GVA in
primary sector, agricultural land and agricultural land
abandonment) are presented, highlighting the most
important data sources and methods needed to
performed the analysis.
2.1 LUISA Territorial Modelling
Platform
The LUISA provides EU-wide scenarios of territorial
development in order to understand the direct and
indirect impacts of EU policies in an integrated,
spatially explicit manner. The LUISA platform
consists of several elements that: 1) provide
multisectoral regional trends and derived demands for
land functions; 2) allocate those demands as land
uses, population counts and accessibility levels on a
100x100m spatial raster, typically until 2050; 3)
compute a large amount of indicators based on the
resulting LUISA projections; and 4) provide web
platforms to share the computed results. For that
purpose, LUISA coherently links specialised
macroeconomic, demographic and geospatial models
with thematic spatial databases. Under this modelling
approach, LUISA aims to explain the causal link
between economic decisions and resulting spatial
patterns of human land-based activities. Further
relevant for this paper are the sources of regional
demographic and agricultural expectations. For this
study, regional population projections were obtained
from Eurostat (the EUROPOP13 scenario) and
regional agricultural projections were derived from
the CAPRI 2016 Baseline projections. The latter are
allocated by LUISA in aggregate production systems,
with imposed additional degrees of freedom to allow
for the effects of land market competition with other
land uses not modelled in CAPRI
1
.
1
CAPRI is a partial equilibrium model that simulates
market dynamics of agricultural commodities for impact
assessment of the Common Agricultural Policy (Britz and
Witzke, 2012). The spatial patterns of agricultural activities
are simulated by the mentioned agricultural production
2.2 Developing Socio-economic and
Demographic Rural Indicators:
Data and Methods
2.2.1 EU Rural Population
The indicator presents the people living in rural areas
as a percentage of total population and the changes in
rural population between 2015 and 2030 at national
and regional level (NUTS3
2
) for all EU Member
States (MSs). The regional demographic projections
are produced by Eurostat (EUROPOP2013) and, later
on, implemented in the LUISA platform (Jacobs-
Chrisioni et al., 2017). These projections are then
dynamically allocated at a finer resolution in a 100m
grid map for each time step throughout the simulation
period (2015-2030). The identification of rural areas
is based on the degree of urbanization (Dijkstra, L.
and Poelman, H., 2014), according to which three
main classes are distinguished: cities (densely
populated areas), towns and suburbs (Intermediate
density areas) and rural areas (thinly populated area).
2.2.2 Employment and Gross Value Added
(GVA) in Primary Sector
Added Historical data of the EU Employment and
GVA in primary sector are used to understand past
economic trends up to the last observed year 2015.
Thus, the two selected indicators measure:
the share of employment in primary sector relative
to total employment. Primary sector employment
is defined as employment in the NACE A branch
(Agriculture, Forestry and Fishing). The indicator
shows historical trends at European, national and
regional level (NUTS 3) derived from the
Cambridge econometric database
3
.
the sectoral economic productivity in the primary
sector in terms of GVA, relative to total regional
GVA. Agricultural GVA is measured as NACE A
productivity, and obtained from the Cambridge
econometric database at regional level (NUTS 3).
2.2.3 Agricultural Land
This indicator provides the share of land occupied by
agriculture and the percentage of changes between the
years 2015 and 2030. In function of its final
production, two categories are distinguished: 1) the
systems as a result of an aggregation process from the
individual crops provided by CAPRI.
2
Nomenclature of Territorial Units for Statistics at level 3.
3
Cambridge Econometrics’ European Regional Database
(ERD), Revision: 25/07/2017
Socio-economic and Demographic Trends in EU Rural Areas: An Indicator-based Assessment with LUISA Territorial Modelling Platform
251
production of food and feed takes place on land
allocated to the following modelled production
systems: arable farming, pastoral systems, mix-crop
systems, livestock production, permanent crops and
rice production, and 2) the production of energy from
agricultural land correspond to the modelled class of
bioenergy crops (Perpiña et al., 2015). The indicator
presents data for future projection from LUISA, at
national and regional level (NUTS3) for all EU28
Member States.
2.2.4 Agricultural Land Abandonment
Agricultural land abandonment indicator represents
the share of the agricultural abandoned land with
regard to the total agricultural land area (ALA) for the
period 2015-2030 at the national, regional and grid
level for all 28 EU member states. LUISA models
agricultural land abandonment explicitly using
regional expectations of abandonment along with a
dynamic composite map that assesses the local
potential risk of farmland abandonment. Local risks
are defined according to regional characteristics such
as biophysical, agri-economic’s, farm structure,
remoteness and population density.
The dynamic composite indicator is built by the
spatial aggregation of the set of factors shown in
Table 1. Selected factors driving an agricultural land
abandonment Table 1, as an adaptation of different
methodologies from the scientific literature (Benayas
et al., 2007; Pointereau et al., 2008; Eliasson, et al.,
2010; Terres et al., 2014; Lasanta et al., 2016). These
factors are selected to reflect a number of criteria that
drives and influence an abandonment process from
different points of view.
Each criterion corresponds to a spatial thematic
layer or statistical information (at NUTS2/3 level)
from different European data sources. The spatial
aggregation is made by using a weighted linear
addition (WLA) where biophysical factors are
assigned the highest weights following the
assumption that abandonment can be initially
triggered by primary drivers related to remote and
mountain regions, along with unfavourable soil and
4
Soil, climate and terrain criteria are used for classifying
land according to its suitability for generic agricultural
activity. Delimitation of areas facing severe natural
constraints (limiting conditions) follows the last EU
Regulation No 1305/2013 (European Union, 2013). The
spatial layers are mainly gathered from IIASA (International
Institute for Applied Systems Analysis) and FAO (Food and
Agricultural Organization of the United Nations), SINFO
project (Soil Information System for the MARS Crop Yield
Forecasting System), ESDB (European Soil Data base)
and EFSA (European Food Safety Authority, Spatial Data).
climate conditions for agriculture. Finally, the spatial
combination of the three maps for each group allows
to build the dynamic risk map of farmland
abandonment for the whole Europe (Figure 6).
Table 1: Selected factors driving and agricultural land
abandonment process.
Biophysical land
suitability
factors
4
Economic and
structural
agricultural factors
5
Population
and regional
context
6
Length of
growing period
Farmer
qualification
Population
density
Organic matter
Age of farmers
Remote areas
Soil texture
Farm size
Root depth
Rent paid
Soil ph
Rented UAA
Salinity and
sodicity
Farm income
Precipitation
Farm investment
Soil drainage
Farm scheme
Slope
3 RESULTS: FACTS AND
TRENDS IN EU RURAL AREAS
(2015 - 2030)
3.1 EU Rural Population Trends
(2015 – 2030)
Rural areas cover 75% (3.3 million km2) of EU’s
total populated land area, but in 2015 hosted only
28% of the total population, as the great majority of
Europeans live in towns, cities or suburbs. The
implicit concentration of people is expected to
continue. By 2030 the EU population, 510 million, is
projected to grow by around 2%, while the EU’s rural
population roughly 0.6% between 2015 and 2030.
Important differences can, however, be found at
national and regional level. Six countries (Germany,
Spain, France, Italy, Poland and the United Kingdom)
account for about 70% of the total EU population in
2015. Rural population accounts for about 40% or
5
This information is mainly gathered from FADN (Farm
Accountancy Data Network) and DG EUROSTAT -FSS
(Farm Structure Survey) to reflect the stability, viability and
performing for preventing farmland abandonment at
regional level.
6
The risk of abandonment increases in mountain areas with
extreme remoteness, physical disadvantage and very low
population density (MacDonald et al., 2000). In this study
population density below 50 inhabitants/km2 is considered
low populated areas and remote areas are identify as those
that are further than 60 minutes away from towns.
GISTAM 2019 - 5th International Conference on Geographical Information Systems Theory, Applications and Management
252
more in a number of countries such as Austria,
Croatia, Ireland, Romania, Poland, Slovenia,
Slovakia, Finland, Czech Republic and France. In
contrast, rural population is particularly low (below
15%) in Malta, the Netherlands and the United
Kingdom. As presented in Figure 1, the EU Member
States will undergo significant, but not equal changes
both in general and by population categories up to
2030. The largest growth in rural population is
projected for the United Kingdom, Spain, Denmark
and Sweden. Conversely, the Baltic region (Lithuania
and Latvia) as well as in Bulgaria will see the deepest
drop (more than 7%) in their rural population between
2015 and 2030.
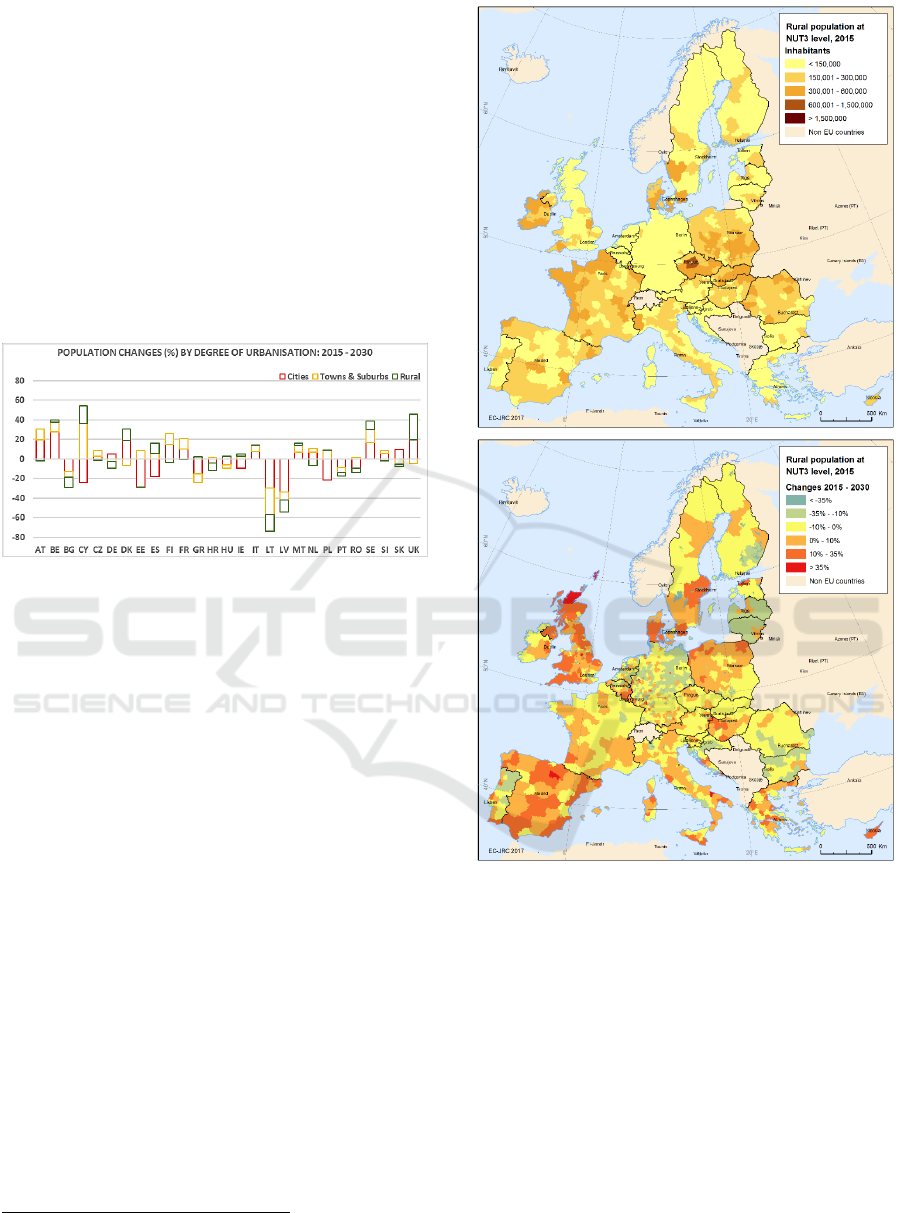
Figure 1: Percentage of changes in population in cities,
towns and suburbs and rural areas at MS level between
2015 and 2030.
The average rural population at NUTS3 level is
approximately 100.000 inhabitants, with the
majority of rural regions in having a population of
less than 300,000 inhabitants (Figure 2). The share
of regional rural population is substantially higher in
Eastern Europe regions compared to Western
Europe. By 2030 important changes (>10%) in rural
population across NUTS 3 regions are expected such
as in: Southern and North-eastern parts of Spain;
South-eastern part of Sweden, Finland, Belgium and
United Kingdom; Northern part of Italy and Poland;
and around most capital cities (Bucharest, Budapest,
Dublin, Madrid, Prague, Rome, etc.), as well as in
Cyprus. Conversely, deep (>10%) cuts in rural
population are expected in: Northern Portugal,
Eastern parts of Germany and Hungary, and large
areas in Sweden, Croatia, Greece and Romania, as
well as in the already identified Lithuania, Latvia and
Bulgaria.
7
Shares derived from DataM bioeconomy data https://datam.j
rc.ec.europa.eu/datam/mashup/BIOECONOMICS/index.html
Figure 2: a) Population living in rural areas in 2015, b)
Change of rural population between 2015 and 2030.
3.2 Employment in Primary Sector,
2015
By 2015, the share of primary sector in the EU overall
employment was 4.4% (more than 9.5 million
people). Agriculture accounted for 93% of that
employment
7
. The employment in primary sector is
substantially higher in the newer EU-13 than in the
elder EU-15 (12% versus 3%, respectively). Romania
and Bulgaria had by far the highest shares (27% and
19%, respectively) followed by Greece and Poland
a)
b)
Socio-economic and Demographic Trends in EU Rural Areas: An Indicator-based Assessment with LUISA Territorial Modelling Platform
253
with around 12% each, and Portugal with 10%. On
the other side, Belgium, Germany, Malta and the
United Kingdom contribute with less than 2% share,
as well as Luxembourg with the absolute low EU-
wide of less than 1%.
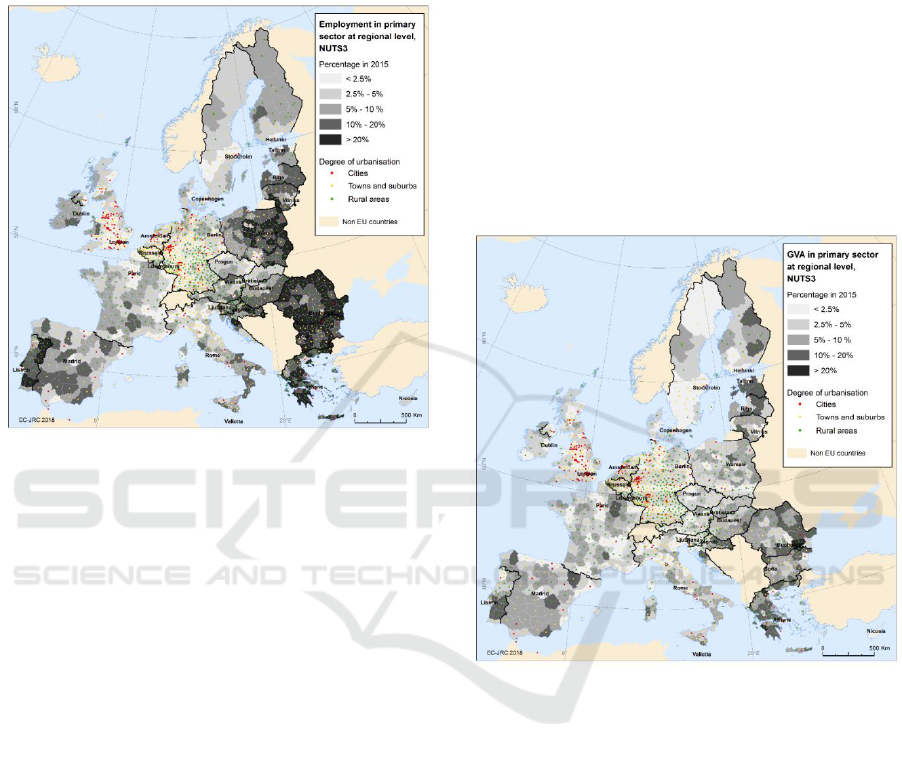
Figure 3: Share of employment in primary sector per degree
of urbanization at NUTS 3 level in 2015.
By regional typologies, rural areas provided the
largest number of employees accounting for about 4.8
million (11.5% share in primary sector employment).
With almost 4% share, towns & suburbs ranked
second and close to the EU average, while cities had
the lowest share of primary sector employment (less
than 1%). Eastern European regions in Lithuania,
Poland, Romania, Bulgaria, Greece, and Croatia as
well as in Portugal were the ones where the
employment share of primary sector exceeded 20%
(Figure 3). Town & suburban regions with such a
high share were mainly found in South-eastern
Europe (Romania, Bulgaria and Greece). On the
contrary, most NUTS 3 containing capital cities or
other large cities, as well as vast areas in Western and
Central Europe (in Germany, Southern United
Kingdom, Benelux, Northern France and French
Riviera, Northern Italy, Czech Republic, etc.)
presented very low shares of primary sector
employment ( less than 2.5%). In all those regions,
employment in secondary and tertiary sectors were
the dominant.
3.3 Gross Value Added in Primary
Sector, 2015
In 2015, primary sector accounted for just 1.7% of
total GVA in the EU. Similarly to the primary sector
employment, the weight of rural economy differed
considerably between the newer EU-13 and the elder
EU-15. The share of primary sector’s GVA in EU-13
was roughly two times higher than in EU-15 (8.1%
versus 4.1%, respectively means that the productivity
of labour force in EU-13 was much lower than the one
in EU-15. In the same way as employment, Romania
was the EU leader in primary sector GVA with 5.7%
followed by Greece (4.8%), (4.6%) and Bulgaria
(4%). At the bottom of the GVA ranking there was no
significant difference with the employment one.
Germany, the United Kingdom and Belgium
occupied the lowest placing with less than 1%, going
down to the record low of 0.25% in Luxembourg.
Figure 4: Share of GVA in primary sector per degree of
urbanization at NUTS 3 level in 2015.
In predominantly rural regions, the primary sector’s
GVA contributed well above the EU average (1.7%),
accounting for roughly 4.5% whereas in towns &
suburbs was considerably lower (only 2%). The
activities of primary sector were mainly concentrated
in rural regions of Austria, Croatia, Estonia, Finland,
France, Ireland, Poland, Portugal, Romania and
Slovenia. In Belgium, Czech Republic, Germany,
Denmark, Hungary, Italy and Sweden the GVA of
primary sector came simultaneously from towns &
suburbs and rural regions. The highest EU values
(above 25%) were identified in Romania (Brăila and
Ialomiţa) and Bulgaria (Silistra) and, modestly, most of
the regions of the Eastern and Southern Europe
(Hungary, Romania, Bulgaria, Croatia and Greece)
reached more than 15% share. Conversely, many
regions in Italy, France, Belgium, the Netherlands,
GISTAM 2019 - 5th International Conference on Geographical Information Systems Theory, Applications and Management
254
Germany and Poland scarcely contributes (below
2.5%) to the GVA in primary sector. However, even in
those countries was possible to identify NUTS 3 with
higher importance of this sector (5% - 10 %),
particularly in traditional rural zones. The regional
heterogeneity is highlighted by the large differences
amongst rural-urban typologies, for instance in Spain
or Bulgaria.
3.4 Agricultural Land (2015 – 2030)
The total agricultural land area (ALA) reached 185
million ha (42.6% of the all EU land area) in 2015 and
it is expected to decrease 1.1% between 2015 and
2030. By aggregated production systems, arable
farming systems8 cover the largest proportion of EU
agriculture systems with 103.4 million ha (56% over
the total ALA) in 2030, despite an important reduction
of more than 4%. The second largest contributor to
agriculture systems are livestock grazing systems
9
which account for 47 million ha (25% over the total
ALA) in 2030, also being expected to undergo a drop
of 2.6%. Mixed crop-livestock systems
10
are the
agriculture system projected to experience the largest
increase (almost 11%), with a total land surface of 25
million ha representing 13.5% of the total ALA in
2030. Besides of mixed-crop, permanent crops
systems
11
are also expected to increase by
approximately 3.5%, with a total cultivated are of 10.2
million ha (5.5% over the total ALA). Regarding
different types of permanent crop systems, olive trees
will represent practically double of the combined land
surface of fruit trees and vineyards, being the
production system expected to grow the most (13.3%).
Bioenergy crops are likely to occupy a small area of
0.21 million ha, i.e. only to 0.12% of the total ALA in
2030. Though abandoned agricultural land is not
considered here as productive land, it must be
highlighted that more than 5 million ha will be
abandoned in EU in 2030.
The analysis of the ALA at MS level indicates that
seven countries (France, Spain, Germany, Poland,
Italy, Romania and United Kingdom) contribute the
most to the EU total ALA in 2030, accounting for
about 70% (128.6 million ha). Slight increases (<5%)
are projected for France, Spain, Cyprus, Portugal,
Greece, Malta, Croatia, and Latvia. In relative terms
(agricultural land as share of total area), Denmark,
Hungary and Ireland are the clear EU leaders, with
8
Arable farming is the result of adding arable land and rice
production in the same group.
9
Livestock grazing system is the result of adding pastures,
agro-forestry and natural grassland in the same group.
more than 60% of their surface being occupied by
agricultural land both in 2015 and 2030. Conversely,
Sweden, Finland, Slovenia, Austria and Estonia are the
group of countries with the least land devoted to food,
feed and energy production in the EU.
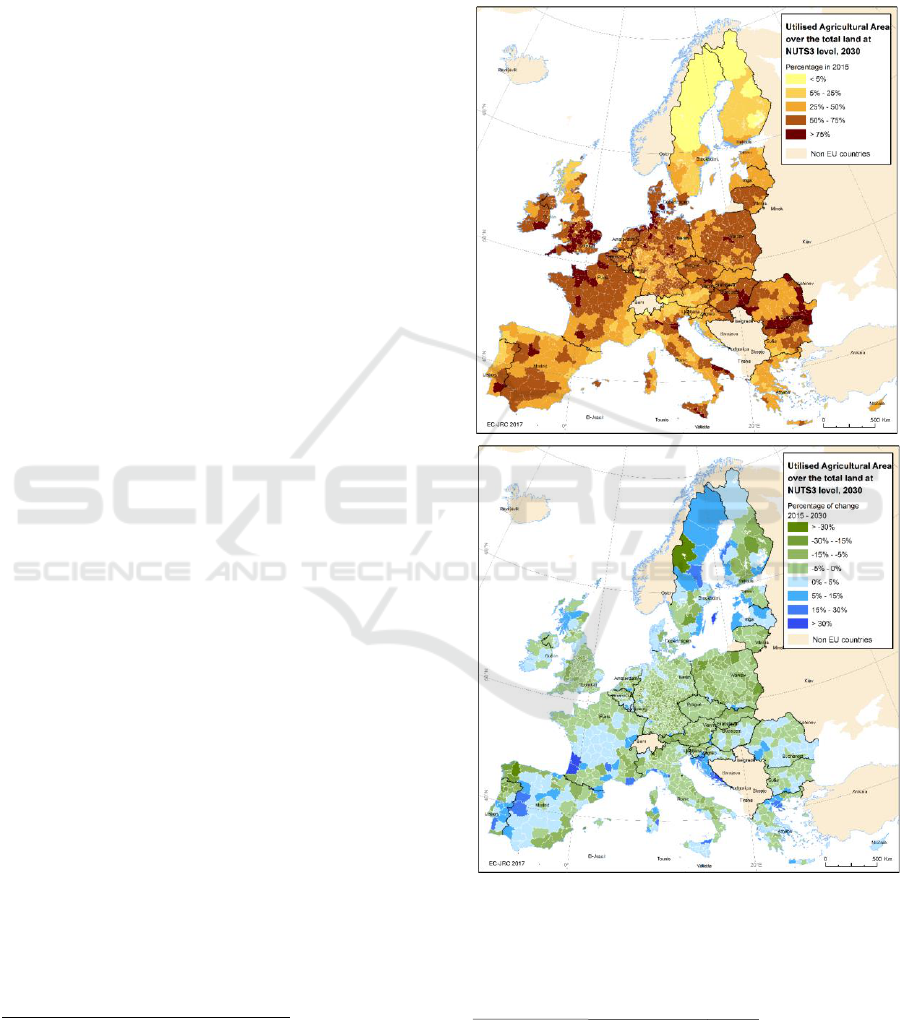
Figure 5: Share (top) and percentage of changes (botton) in
agricultural land for the production of food, feed and energy
land over the total land at NUTS3 level, 2015 -2030.
10
Mixed-crop system is the result of adding annual crops
associated with permanent crops, complex cultivation
patterns.
11
Permanent crops system is the result of adding vineyards,
Fruit and olive trees in the same group.
Socio-economic and Demographic Trends in EU Rural Areas: An Indicator-based Assessment with LUISA Territorial Modelling Platform
255
Within some countries (e.g. Italy, France, Spain or
Portugal) is possible to find NUTS3 regions ranging
from shares less than 5% to greater than 75%, while
other MSs are more homogeneous (e.g. Finland, the
Netherlands, Denmark, Slovakia, Estonia or Latvia).A
number of regions located in the southern and eastern
part of Romania, north of France and Germany,
southern parts of Hungary, The United Kingdom, Italy
and Portugal have the highest shares, above 75% of the
total land. Future trends projects that only a small
number of NUTS3 regions of a few countries will
continue expanding their agricultural lands. This is the
case of central France and Spain, western part of
Croatia, Greece, Romania, Latvia, Denmark, north of
Finland and Sweden. Conversely, more than 75% of all
NUTS3 regions in Europe will undergo a contraction
of land for the production of food, feed and energy
between 2015 and 2030.
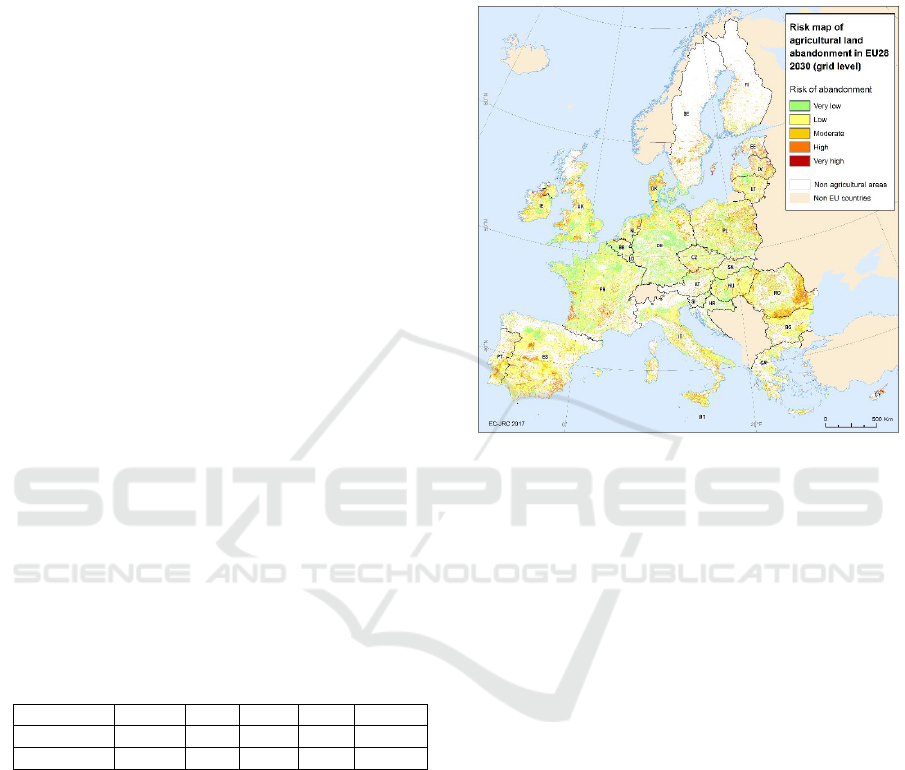
3.5 Agricultural Land Abandonment
3.5.1 European Risk Map of Agricultural
Land Abandonment
In 2030, almost 183 million ha of agricultural land are
projected to be under various potential risk of land
abandonment. Particularly, almost 75% (roughly 138
million ha) of all EU agricultural land is expected to be
subjected to very low and low risk of abandonment,
while about 14% (27 million ha) will be under a
moderate risk. More than 11% (21 million ha) will be,
however, exposed to high and very high risk, primarily
in Romania, Estonia, Latvia, Poland, Cyprus, Spain,
Portugal and France (Figure 6).
Table 2: Classification of the abandonment risk in 2030.
EU -ALA
V.L.R.
L.R.
M.R.
H.R.
V.H.R.
Million ha
48
91
27
21
0.7
Percentage
25.7
48
14.2
11
0.4
Note: V.L.R. refers to Very Low Risk; L.R. refers to Low
Risk; M.R. refers to Moderate Risk; H.R. refers to High Risk;
V.H.R. refers to Very High Risk
The biophysical component is the leading one in large parts
of Austria, Poland, Greece, Spain, Estonia and Latvia,
northern parts of Sweden, Finland, Italy, Ireland and the
United Kingdom, as well as in southern parts of France and
Bulgaria due to mountain ranges (the Apennines, Pyrenees,
Alps, Dolomites, Carpathians, etc.) which provide
unfavourable terrain and climate conditions. Abandonment
risk due to climate limitations is mostly found in the
Mediterranean countries where soils suffer from drought
(Greece, Italy, Spain), but also in the UK and Scandinavia
(due to acidic and waterlogged soils). In the inner part of
Spain, the middle and northern areas of Sweden, Finland
and Ireland, the northern and eastern parts of Romania, and
partially in Estonia, Latvia and Lithuania, Hungary and
Cyprus, the elevated agricultural abandonment risk is
mainly associated with remoteness and low population
density. Economic and structural farm factors are likely to
be the primary cause for the increased agricultural
abandonment risk in many regions of Spain; the north of
France, Greece and Italy; the central and northern parts of
Sweden and Finland.
Figure 6. Map of the potential risk of agricultural land
abandonment in 2030 at grid level (100-metres resolution)
in the EU. The associated table reports the EU values per
each risk category.
Altogether, those findings mean that although the
potential risk of agricultural land abandonment is
relatively modest at EU level, it may be quite severe in
some EU MSs and in particular (as shown in Figure 5)
in some of their regions, e.g. Southern and Eastern
Romania, Southern and central Spain, South-western
France, etc. The risk is projected only for areas where
the current land use is agriculture, i.e. arable farming
(including rice), livestock grazing, mixed crop-
livestock and permanent crops.
3.5.2 Agricultural Land Abandonment
Projections (2015 – 2030)
In the period 2015-2030 the total agricultural land
abandonment in EU-28 is projected to reach roughly
5.6 million ha (about 373 thousand ha per year on
average), which will account for approximately 3% of
the total agricultural land (183 million ha) in 2030.
Arable land is by far the dominant type of agricultural
land in the EU and consequently, it will also account
for the largest share of abandonment. More than 70%
of EU total abandonment in 2030 will be arable land (4
million ha), followed by pastoral land with more than
20% (1.2 million ha) and permanent crops with
GISTAM 2019 - 5th International Conference on Geographical Information Systems Theory, Applications and Management
256
approximately 7% (400 thousand ha). Almost a quarter
(1.38 million ha) of all agricultural abandonment in the
EU will most likely occur in mountainous areas where
arable land would be again the most affected
agriculture system (974 thousand ha, i.e. 70% of all
mountainous abandonment) due to natural handicaps
and difficult mechanization, among other limitations.
In absolute and relative terms, Spain and Poland are
likely to face both the greatest agricultural land
abandonment (about 1/3 of all EU). France, the United
Kingdom, Germany and Italy complement the list in
the group of the largest affected countries in the EU,
altogether responsible for more than 70% of all ALA
losses. However, Germany and especially France, are
expected to rank below the EU average forecast of 3%.
Conversely, due to their relatively smaller total
agricultural land, the Netherlands, Portugal, Finland,
Greece and especially Slovakia (4.6% loss) are
expected to be above the 3% EU average.
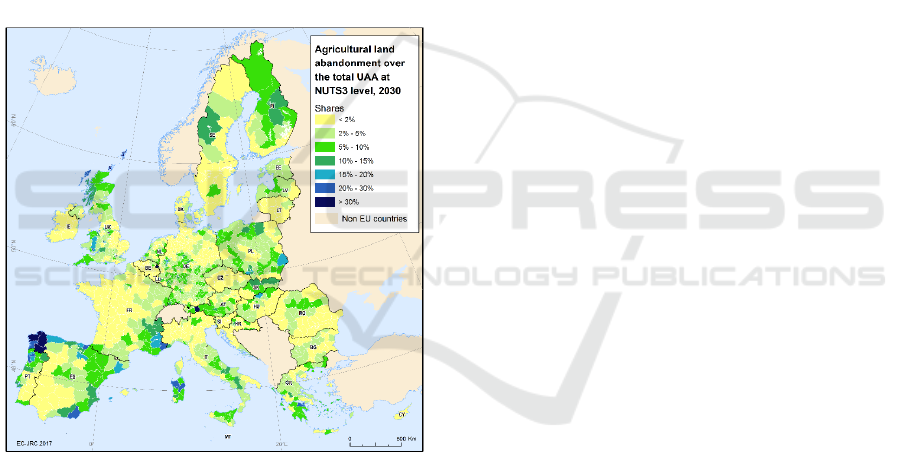
Figure 7: Share of the total agricultural land abandonment
with regard to the total UAA at NUTS3 level in 2030.
Focusing on a regional perspective, figure 7 despicts
the projected abandoned agricultural land as share of
total ALA at NUTS 3. It confirms that Spain is
expected to face the biggest challenges in the EU,
especially in its North / Northwest, where the Lugo
region will be affected the most, with almost 80
thousand ha of abandoned land. Other regions in
Southern Europe, which are likely to face significant
land abandonment, are located in Northern Portugal,
Southeastern France, Sardinia in Italy, and Greece. In
Central and Northern Europe, substantial agricultural
land abandonment is projected for Northern Hungary,
Southeastern Poland, where the largest absolute EU-
wide loss of more than 85 thousand ha occurs in the
Chelmsko-zamojski region, few more NUTS 3 in
Western Germany, as well as in the central and far-
North parts of the United Kingdom. It can be also
highliheted some island regions in Western Austria and
Southern Netherlands with more than 30% share of
agricultural land abandonment, which trend is not
likely to spread to the surrounding regions.
4 CONCLUSIONS
Over the last decades, considerable efforts have been
made to better analyse the EU rural areas due to their
socio-economic and environmental importance. This
work attempts to contribute to the current and extend
knowledge about EU rural regions by means of
presenting a comprehensive analytical exercise on
socio-economic and demographic future trends. For
the purpose of this analysis, a set of indicators (rural
population, employment and Gross Value Added in
primary sector, agricultural land and agricultural land
abandonment) are developed to further extend the
understanding of the situation by 2015 up to 2030 in
predominantly rural areas. The main tool that allow us
to perform a comprehensive and integrated territorial
assessment is the LUISA Modelling Platform
(European Commissions – Joint Research Centre),
and, in particular, its latest 2017 Territorial Reference
Scenario.
The results indicates that throughout the simulation
period (2015 – 2030) the EU total population is
projected to increase by 2%, while the rural population
is expected to rise by just 0.6% (2.8 million). However,
this modest increase will not be uniform across the EU,
with the largest expansion generally located in Eastern
Europe (Romania, Hungary, Slovakia, Czech Republic
and Poland) than in Western side.
Approximately, a quarter of all EU agricultural
land is expected to be subjected to moderate, high or
very high risk of abandonment in 2030. Across Europe,
it can be found NUTS3 regions almost completely
cover by a moderate or high risk, especially in
Mediterranean regions and mountain areas, where a
combination of remoteness, low population density
and unfavourable biophysical conditions are observed.
With this situation, LUISA projects to reach more
than 3% (5.6 million ha) of the total agricultural land
in the EU. This is, however, a noticeable trend,
considering that the decrease of EU agricultural land is
estimated to continue decreasing (about 1.1%
compared to 2015). Per production systems, arable
land is projected to account for the largest share of total
abandoned land, followed by pastures and permanent
Socio-economic and Demographic Trends in EU Rural Areas: An Indicator-based Assessment with LUISA Territorial Modelling Platform
257

crops. This is in line with the prevailing breakdown of
agricultural land, where arable land is the largest
group, too, while the permanent crops are the smallest
one.
Regarding the EU economic performance in
primary sector, represented by the EU share of
employment and GVA, both confirms the continue
decline of this sector. Romania, Bulgaria followed by
Greece and Poland have the highest shares of
employment and GVA (adding also Estonia) in
primary sector while the lowest rates are found in
Luxembourg, Germany, The United Kingdom and
Belgium. Rural areas provides the largest number of
employees (about 4.8 million) and contributes the most
of the EU’ GVA in primary sector.
This assessment can, therefore, offer valuable
qualitative and quantitative information, as well as
provide useful insights about potential outcomes for
rural areas across the EU. However, the work can even
go beyond by addressing the topic from a broader point
of view (such as the synergies between the rural-urban
relationships or diversification of economic activities)
as well as integrating new rural-related indicators
(accessibility to transport and services, forest and
natural areas, other economic sectors, etc.).
REFERENCES
Benayas J.M., Martins A, Nicolau JM, Schulz JJ., 2007
Abandonment of agricultural land: an overview of
drivers and consequences. CAB Reviews: Perspectives
in Agriculture, Veterinary Science, Nutrition and
Natural Resources 2 (57).
Britz and Witzke, 2012. CAPRI Manual. Version: 2012.
Dijkstra, L. and Poelman, H., 2014. A harmonised
definition of cities and rural areas: the new degree of
urbanisation. European Commission. Regional Policy
Working Papers.
Eliasson, A., et al., 2010. Common criteria for the
redefinition of intermediate less favoured areas in the
European Union. Environmental science and policy 13:
766-777.
European Union, 2013. Regulation (EU) no 1305/2013 of
the European Parliament and of the Council of 17
December 2013 on support for rural development by
the European Agricultural Fund for Rural
Development (EAFRD) and repelling Council
Regulation (EC) No 1698/2005.
European Union, 2014. Rural development in the EU.
Statistical and economic information. Report 2013.
Directorate-General for Agriculture and Rural
development.
Eurostat -European Commission, 2017. Statistics on rural
areas in the EU. Statistics explained. Data access:
February 2017.
Jacobs-Crisioni, C., Diogo, V., Perpiña Castillo, C.,
Baranzelli, C., Batista e Silva, F., Rosina, K., Kavalov,
B., Lavalle, C., 2017. The LUISA Territorial Reference
Scenario: A technical description. Publications Office
of the European Union, Luxembourg. doi:10.2760
/902121.
Hart, K., Allen, B., Lindner, M., Keenleyside, C., Burgess,
P., Eggers, J., Buckwell, A., 2013. Land as an
Environmental Resource. Report prepared for DG
Environment, Contract No ENV.B.1/ETU/2011/0029,
Institute for European Environmental Policy, London.
Lasanta, T., et al., 2016. Space-time process and drivers of
land abandonment in Europe. Catena 149: 810–823.
MacDonald, D., et al., 2000. Agricultural abandonment in
mountain areas of Europeç Environmental
consequences end policy response. Journal of
Environmental Management 59: 47-69.
Perpiña Castillo, C., Lavalle, C., Baranzelli, C., Mubareka,
S., 2015. Modelling the spatial allocation of second-
generation feedstock (lignocellulosic crops) in Europe.
International Journal of Geographical Information
Science, 29:10, 1807-1825, DOI: 10.1080/1365
8816.2015.1051486
Pointereau, P., et al., 2008. Analysis of farmland
abandonment and the extent and location of
agricultural areas that are actually abandoned or are
in risk to be abandoned. Joint Research Centre, Institute
for Environment and Sustainability.
Terres, J. M., et al., 2014. Scientific contribution on
combining biophysical criteria underpinning the
delineation of agricultural areas affected by specific
constraints. Joint Research Centre, Institute for
Environment and Sustainability. JRC92686.
Van der Zanden, E.H., et al., 2017. Trade-offs of European
agricultural abandonment. Land Use policy 62: 290-
301.
GISTAM 2019 - 5th International Conference on Geographical Information Systems Theory, Applications and Management
258
