
Front-View Vehicle Damage Detection using Roadway Surveillance
Camera Images
Burak Balci, Yusuf Artan, Bensu Alkan and Alperen Elihos
Video Analysis Group, HAVELSAN Incorporation, Ankara, Turkey
Keywords: Intelligent Transportation Systems (ITS), Deep Learning, Object Detection, Image Classification.
Abstract: Vehicle body damage detection from still images has received considerable interest in the computer vision
community in recent years. Existing methods are typically developed towards the auto insurance industry to
minimize the claim leakage problem. Earlier studies utilized images taken from short proximity (< 3 meters)
to the vehicle or to the damaged region of vehicle. In this study, we investigate the vehicle frontal body
damage detection using roadway surveillance camera images. The proposed method utilizes deep learning
based object detection and image classification methods to determine damage status of a vehicle. The
proposed method combines the symmetry property of vehicles’ frontal view and transfer learning concept in
its inference process. Experimental results show that the proposed method achieves 91 % accuracy on a test
dataset.
1 INTRODUCTION
Computer vision and video analytics have been
ubiquitously used in many ITS solutions in recent
years (Tractable 2018; IBM 2012, Seshadri et al.,
2015; Li et al. 2018; Balcı et al., 2018; Elihos et al.,
2018). By utilizing cameras placed on highways and
roads, transportation authorities are able to reduce
their service and staffing costs while improving
operational efficiency. These technological advances
have also impacted traffic security industry as well.
With the proliferation of video surveillance systems,
manual police effort has been reduced significantly in
many enforcement tasks such as passenger/driver seat
belt enforcement, front seat child occupancy
enforcement, cell-phone usage violation enforcement
tasks (Artan et al., 2016; Balcı et al. 2018; Elihos et
al., 2018).
Recently, traffic authorities are interested in
automated body-damaged vehicle detection system to
quickly identify hit and run vehicles that are involved
in motor vehicle accidents and pose danger to traffic
safety. Moreover, they desire this automated system
to utilize existing camera infrastructure that is already
installed on fixed platforms on roads.
In the literature, vehicle damage detection and
recognition solutions have typically been proposed
towards auto insurance industry to reduce the claim
leakage (Jayawardena et al., 2013; Li et al. 2018; Patil
et al. 2017, Tractable 2018). However, these methods
require a close-up picture of the damaged vehicle in
its damage region detection and categorization
process. Unfortunately, existing studies that propose
solutions towards this problem are not directly
applicable to fixed platform cameras since these
cameras are designed for monitoring a large area in
the roads.
In the damaged vehicle detection problem using
roadway cameras, the presence of symmetry is an
important indicator in differentiating between
damaged and non-damaged vehicles. Therefore, we
proposed a method that combines vehicles’ frontal
image information with a term that computes the
similarity of the left and right halves of the vehicles’
front view image. As shown in our experiments,
adding symmetry information substantially improves
prediction performance in this task.
In this study, we propose a deep learning based
method on the damaged vehicle detection problem
from front view roadway camera images. Single shot
multi box (SSD) (Liu et al., 2016; Huang et al. 2017)
object detector is utilized to extract a tight region of
the front side of the vehicle. Next, InceptionV3
convolutional neural network (CNN) (Szegedy et al.,
2015) based novel feature extraction approach is used
to derive feature vectors, which are used by a linear
support vector machine (SVM) classifier to determine
Balci, B., Artan, Y., Alkan, B. and Elihos, A.
Front-View Vehicle Damage Detection using Roadway Surveillance Camera Images.
DOI: 10.5220/0007724601930198
In Proceedings of the 5th International Conference on Vehicle Technology and Intelligent Transport Systems (VEHITS 2019), pages 193-198
ISBN: 978-989-758-374-2
Copyright
c
2019 by SCITEPRESS – Science and Technology Publications, Lda. All rights reserved
193
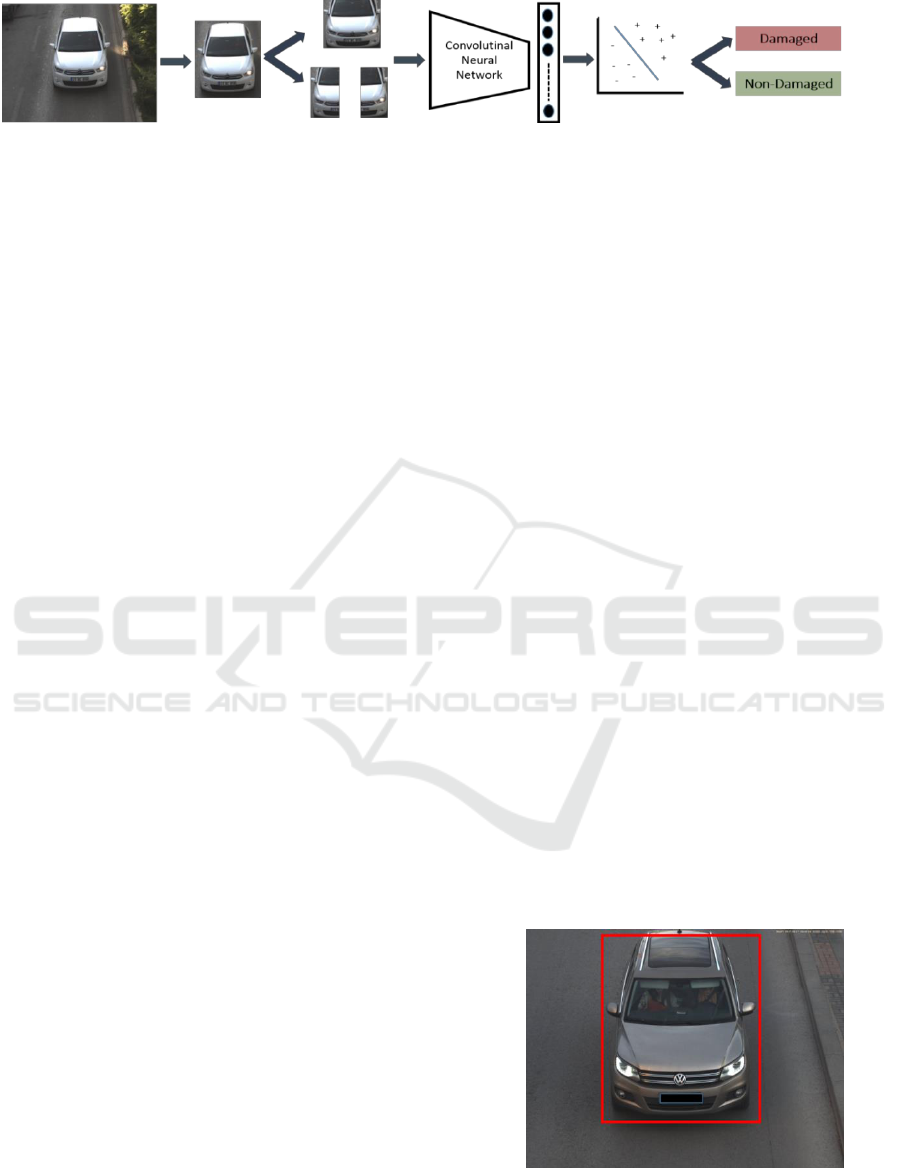
Figure 1: Overview of the proposed vehicle damage assessment method. Vehicle detection is performed on the raw image.
Next, we extract features using CNN and perform classification using SVMs.
damaged/non-damaged class of the vehicle. Figure 1
shows the general outline of the method proposed in
this study.
In Section 2, we summarize the previous work
related to vehicle damage detection problem. In
Section 3, we will describe the details of the proposed
methods in more details. In Section 4, we first
describe our experimental setup and data collection.
Next, we present a comparison of the performances
of the proposed methods. Finally, we present our
conclusions in Section 4.
2 RELATED WORK
2.1 Deep Network based Damage
Detection
Earlier studies on vehicle body-damage detection task
typically proposed view agnostic methods using
close–up pictures of the damaged region. These
methods utilized machine learning and deep learning
methods in their analysis. For instance, (Jayawardena
et al., 2013) developed a 3D computer aided design
(CAD) model based approach in which a CAD model
and RGB image are analysed together to determine
damaged regions of a vehicle using machine learning
techniques. However, the fact that we cannot obtain a
3D model for every car model prohibits the common
usage of this method. In another study, (Patil et al.,
2017) introduced a deep learning based car damage
classification method to classify vehicle damage into
one of 8 classes (bumper dent, door dent, glass
shatter, headlamp broken, scratch, smash, tail-lamp
broken, non-damaged). The success of the method
depends strongly on the localization of the damaged
area. In that study, the authors utilized a close-up
image of the damaged region which did not pose a
challenge in their analysis. Another study
(MaskRCNN2018) recently proposed a Mask R-
CNN based approach to localize damaged regions of
vehicles. Similar to others, this method works well for
close up images and is not tested on distant images.
In general, CNNs (Simonyan et al., 2014; Szegedy et
al., 2015) have been applied to structural damage
assessment in these studies (Cha et al., 2017). A
recent study (Li et al., 2018) proposed a deep learning
based object detector to detect damaged regions and
CNN based classification of damage regions. As
mentioned earlier, these methods are designed for
insurance company claims and they have not been
tested on roadway images.
3 METHODOLOGY
Overview of the proposed approach is shown in
Figure 1. First, we detect the vehicle within the raw
image using a novel SSD model described in Section
3.1. Second, using the cropped image, we generate
deep feature representations of vehicle as explained
in Section 3.2. Finally, by applying a classification
operation on the feature vectors, we determine the
damage status of the vehicle.
3.1 Vehicle Detection
As the first step in vehicle damage detection task, we
need to localize the vehicle within the image captured
by the surveillance camera. For this purpose, we
utilized a deep learning based SSD model to localize
the vehicle. It has shown that SSD model trained with
PASCAL VOC dataset (Everingham et al., 2010) is
able to detect objects belonging 20 classes including
cars successfully (Liu et al., 2016). Sample detection
result is shown in Figure 2.
Figure 2: SSD vehicle detection example. SSD produces the
coordinates of red rectangle.
VEHITS 2019 - 5th International Conference on Vehicle Technology and Intelligent Transport Systems
194
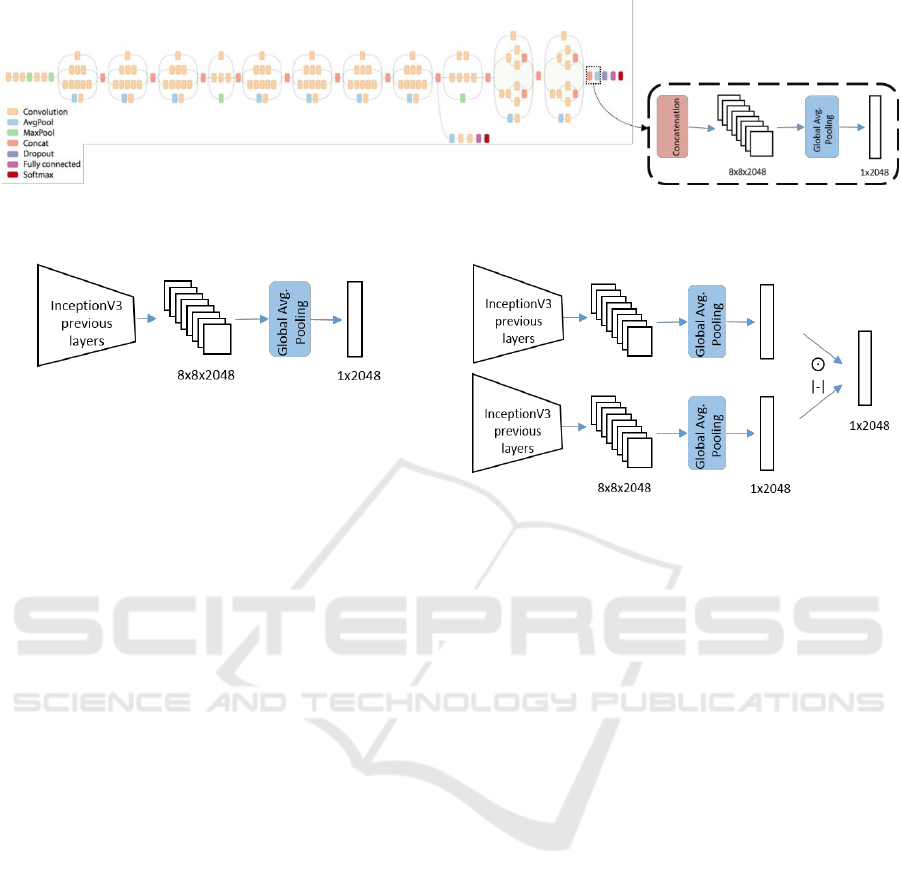
Figure 3: InceptionV3 model architecture diagram (Szegedy et al., 2015). Utilized feature extraction layers and their outputs
are shown in dashed rectangle.
Figure 4: Transfer learning feature extraction method.
3.2 Feature Extraction
In our analysis, we compared the performances of
several deep feature representation approaches. In
terms of the deep feature extraction, we utilized
InceptionV3 model (Szegedy et al., 2015) trained on
ImageNet image classification dataset (Deng et al.,
2009) due to its computational efficiency and success
in vehicle re-identification problem as described in
(Kanacı et al. 2017). Details of these feature
representation approaches are explained in next
subsections.
3.2.1 Transfer Learning
In the first approach, we utilized InceptionV3 model
trained on Imagenet data without further training or
fine-tuning since we have not much data. Deep CNN
models trained with ImageNet data are strong
candidates to derive meaningful feature vectors in our
case since car class is included as one of the learned
1000 classes in ImageNet dataset. In this approach,
we use a pre-trained InceptionV3 model as a feature
extractor by getting a 2048-d vector output of global
average pooling layer as shown in Figure 3. Figure 4
illustrates transfer learning approach to feature
representation of the original image. For the
remainder of this study, we refer this feature as F
TL
.
3.2.2 Early Symmetrical Analysis
In the second approach, we utilize visual symmetry
property of non-damaged vehicles. To this end, we
divide the detected vehicle image into left and right
Figure 5: Early symmetrical analysis feature extraction
method. One branch for each of the right side and mirrored
lefts side images.
parts, and mirror the left part image. Then, we derive
a feature vector for each of these parts using the
technique specified in Section 3.2.1. Assuming that
the symmetrical parts have also similar
representations in the feature space, we may combine
the feature vectors of both parts using Eq. (1) or Eq.
(2) as employed in previous Natural Language
Processing studies (Blacoe, 2012) to represent
semantic similarity.
𝑋
𝑑𝑖𝑓𝑓
= 𝑎𝑏𝑠( 𝑋
𝐿𝑒𝑓𝑡
− 𝑋
𝑅𝑖𝑔ℎ𝑡
) (1)
𝑋
𝑝𝑟𝑜𝑑
= 𝑋
𝐿𝑒𝑓𝑡
ʘ 𝑋
𝑅𝑖𝑔ℎ𝑡
(2)
where 𝑋
𝐿𝑒𝑓𝑡
is the deep feature vector representation
extracted for the left half of the image and 𝑋
𝑅𝑖𝑔ℎ𝑡
represents the deep feature vector representation
extracted for the right half of the image. Note that ʘ
operation shown in Eq. (2) is the element-wise
product (a.k.a hadamard product) of 𝑋
𝐿𝑒𝑓𝑡
and 𝑋
𝑅𝑖𝑔ℎ𝑡
feature representations. While Eq. (1) is attenuating
similar features, Eq. (2) stimulates the features of
similar regions.
Finally we obtain a 2048-d feature vector
representing the vehicle. Figure 5 visually illustrates
the feature extraction process. For the remaining part
of this study, we refer this feature as F
ESA-DIFF
or F
ESA-
MUL
with respect to the employed equation type.
Front-View Vehicle Damage Detection using Roadway Surveillance Camera Images
195
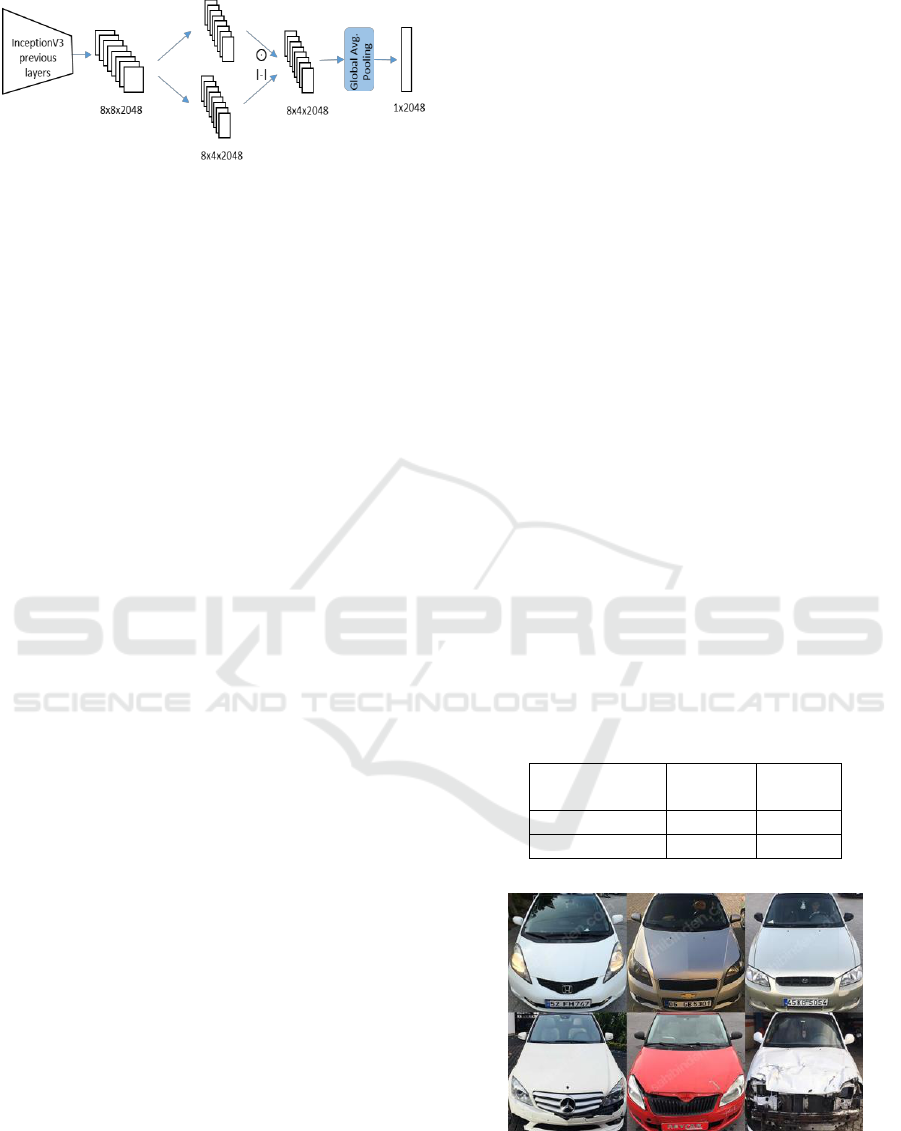
Figure 6: Late symmetrical analysis feature extraction
method.
3.2.3 Late Symmetrical Analysis
In the third approach, we again apply the visual
symmetry property of vehicles. Differently from the
previous approach, we analyse symmetry in the
produced feature map instead of the original image.
Throughout the convolutional blocks, CNNs
transform the original image into feature maps by
preserving spatial distribution of learned features.
Thus, feature map of a non-damaged vehicle that is
more compact representations of input image carries
the symmetry property of the original image. This
approach introduces more efficient way to utilize the
symmetry property because it needs one forward pass
in feature extractor network unlike the method
described in Section 3.2.2.
We utilize a pre-trained InceptionV3 model by
getting its 8x8x2048 shaped feature map output of
last concatenation layer shown in Figure 3. Behaving
to this feature map as symmetrical representation of
original image, we divide it into 8x4x2048 shaped
left/right parts and mirror the left side. Then, we
combine halves using operations shown in Eq. (1) and
Eq. (2) alternatively. Finally, we apply global average
filtering as in original InceptionV3 architecture to
resulting feature map to obtain 2048-d feature vector
representation of vehicle. A visual illustration of this
approach can be found in Figure 6. For the remaining
part of this study, we refer this feature as F
LSA-DIFF
or
F
LSA-MUL
with respect to the employed equation type.
3.2.4 Combined Feature Representation
In this approach, we utilize both symmetrical analysis
features obtained in Section 3.2.3 and features of
original image obtained in Section 3.2.1 to enrich the
representation of vehicle image. We concatenate two
feature vectors to combine the information and get
4096-d feature vector. For the remainder of this study,
we refer this feature as F
COMB
.
3.3 Classification
Upon the completion of feature extraction for
damaged and non-damaged vehicle images, next, we
build a separate binary classifier model for each type
of feature representation approach mentioned in
Section 3.2. Similar to (Razavian et al. 2015), we
utilized a linear support vector machine (SVM) to
perform the classification using these feature vectors.
4 EXPERIMENTS
4.1 Dataset
In this study, we utilized RGB camera images
containing the frontal view of vehicles. Figure 7
shows several sample images used in our study.
In contrast to the abundance of vehicle images,
damaged vehicles could be rarely seen in real life
images. Thus, firstly we collected damaged vehicle
images from the Internet and then we added same
number of non-damaged vehicle images to prevent
uneven distribution of training dataset classes. Apart
from the training dataset, we formed a completely
distinct test dataset. In order to test the models, we
collected 1000 non-damaged vehicle images and 183
damaged vehicle images. Table 1 shows the
distribution of the number of images in our training
and test datasets.
Table 1: Number of images used in this study.
No.
Images
Training
Dataset
Test
Dataset
Damaged
350
183
Non-damaged
350
1000
Figure 7: Sample detected vehicle images from the dataset.
The first row shows non-damaged vehicles, the second row
shows damaged vehicles.
VEHITS 2019 - 5th International Conference on Vehicle Technology and Intelligent Transport Systems
196
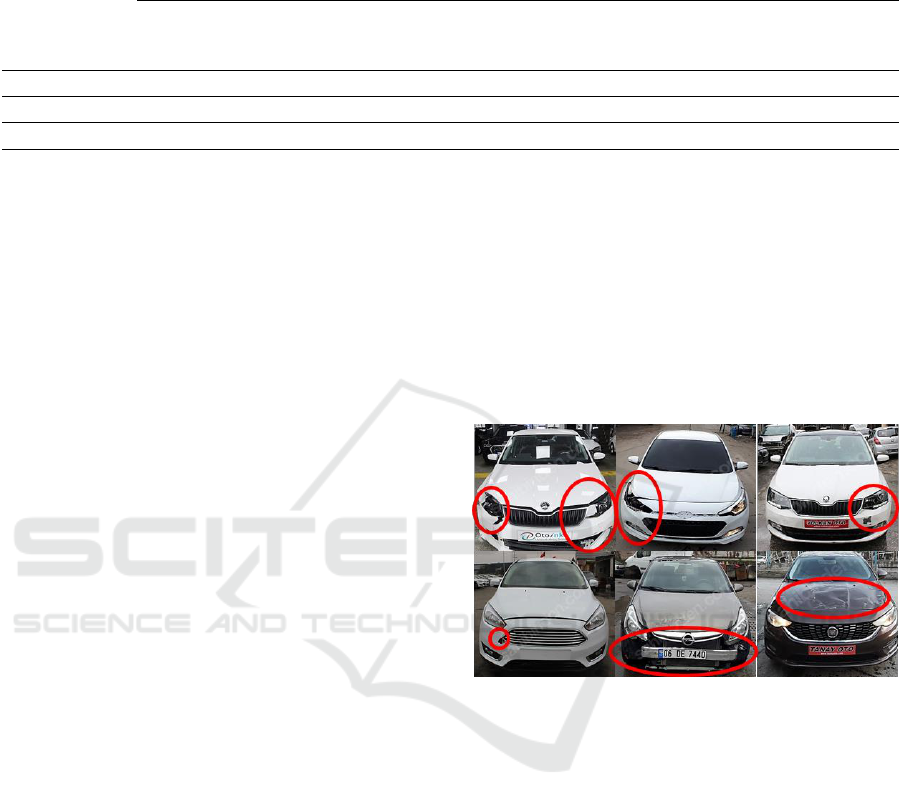
Table 2: Accuracy rates of feature representations (F
TL
approach is independent of the absolute difference and hadamard
product operations).
Absolute Difference (DIFF)
Hadamard Product (MUL)
Damaged
Class
Accuracy
Nondamaged
Class
Accuracy
Average
Accuracy
Damaged
Class
Accuracy
Nondamaged
Class
Accuracy
Average
Accuracy
F
TL
0.924
0.852
0.888
0.924
0.852
0.888
F
ESA
0.910
0.704
0.807
0.951
0.792
0.871
F
LSA
0.930
0.814
0.872
0.903
0.874
0.889
F
COMB
0.939
0.880
0.910
0.932
0.863
0.898
4.2 SVM Training
In the training stage of linear SVM model, we utilized
700 feature vectors (350/350 images for damaged and
non-damaged classes) computed from images in
training dataset. We utilized 80 % of training data for
training and 20 % for validation purposes. In our
training process, parameter selection is performed
using validation performances.
4.3 Experimental Results
In this section, we evaluated the performance of the
SVM classifiers trained using reported feature
representations on test images. We utilize accuracy
metric to compare the performances. In our results,
we report damaged and non-damaged class
accuracies as well as the average accuracy values so
that class imbalance would not mislead overall
performance results.
Table 2 presents the performance results of 4
different feature representation techniques using
absolute difference and hadamard product in their
feature generation process. When comparing the
average accuracy performances of the classifiers,
F
COMB
yields the highest accuracy value in terms of
both absolute difference (% 91.0) and hadamard
product (% 89.8) cases. Note that the performances of
the F
TL
, F
LSA
, and F
ESA
methods are close to each
other.
Among the symmetrical analysis techniques, late
symmetrical analysis approach gives higher overall
accuracies than the early symmetrical analysis
technique in both cases (F
LSA-DIFF
or F
LSA-MUL
).
Despite the similar theoretical background, F
LSA
methods outperform the F
ESA
methods in terms of
both computational efficiency (as stated in Section
3.2.3) and overall accuracy. Thus, we ignored F
ESA
features and combined two feature representations,
F
LSA
and F
TL
, as described in Section 3.2.4 to boost
the performance of similarity analysis.
Visual analysis of classification results produced
by F
COMB
presents the performance of the model in a
more intuitive way. The first row in Figure 8 presents
accurately classified vehicles with varying damages.
The second row in Figure 8 presents incorrectly
classified vehicles with some minor or evenly
distributed damages. These results show that F
COMB
is
able to represent vehicles with non-symmetrical and
noticeable damages successfully in its feature space.
Figure 8: Sample damaged vehicle images from the test set
with red ellipses enclosing the ground truth damaged areas.
The first row shows samples successfully classified as
damaged. The second row shows incorrectly classified
damaged vehicle samples.
5 CONCLUSION
In this study, we have analysed the performance of
various deep learning based approaches in the vehicle
damage detection task. Semantic similarity analysis
concept in Natural Language Processing literature is
employed to utilize symmetry property of vehicles’
frontal view by using Eq. (1) and Eq. (2) along with
the output of deep feature extraction models.
Performance of the proposed methods indicates that
the ensemble model (F
COMB
) that combines the
symmetrical analysis feature representation (F
LSA
)
and transfer learning feature representation (F
TL
)
yields the most accurate result with the accuracy rates
Front-View Vehicle Damage Detection using Roadway Surveillance Camera Images
197

of 91 % and 89.8 % as shown in Table 2. In our future
analysis, we plan to test the performance of the
proposed model on a larger dataset.
REFERENCES
Artan, Y., Bulan, O., Loce, R. P., Paul, P., (2016) Passenger
compartment violation detection in HOV/HOT lanes, in
IEEE Transactions on Intelligent Transportation
Systems, vol. 17, no. 2, 395-405, 2016.
Seshadri, K., Juefei-Xu, F., Pal, D. K., Savvides, M., Thor,
C., (2015). Driver cell phone usage detection on
Strategic Highway Research Program (shrp2) face view
videos", in CVPR’2015, IEEE Conf. CVPRW, pp. 35-
43, 2015.
Elihos, A., Alkan, B., Balci, B., Artan, Y., (2018).
Comparison of Image Classification and Object
Detection for Passenger Seat Belt Violation Detection
Using NIR & RGB Surveillance Camera Images, In
AVSS’2018, IEEE Conference on Advanced Visual
Surveillance Systems, 2018.
Balci, B., Alkan, B., Elihos, A., Artan, Y., (2018). Front
Seat Child Occupancy Detection in Roadway
Surveillance Images, In ICIP’2018, IEEE Conference
on Image Processing, 2018.
Simonyan, K., Zisserman, A., (2014). Very Deep
Convolutional Networks for Large-Scale Image
Recognition, arXiv:1409.1556, 2014.
Liu, W., Anguelov, D., Erhan, D., Szegedy, C., Reed, S.,
Fu, C., Berg., A., (2016). “SSD: Single shot multibox
detector.” In ECCV’2016. European Conference on
Computer Vision, pp. 21–37, Springer, 2016.
Huang, J., Rathod, V., Sun, C., Zhu, M., Korattika, A.,
Fathi, A., Fischer, I., Wojna, Z., Song, Y., Guadarrama,
S., Murphy, K. (2017). Speed/accuracy trade-offs for
modern convolutional object detectors, arXiv:
1611.10012v3, 2017.
IBM, (2012). IBM Smarter Cities Public Safety, Law
Enforcement Report, 2012.
Patil, K., Kulkarn, M., Sriraman, A., Karande, S., (2017).
Deep Learning Based Car Damage Classification, In
ICMLA’2017, IEEE Conference on Mac. Learn. App.,
2017.
Kanacı, A., Zhu, X., Gong, S., (2017). Vehicle
reidentification by Fine grained cross-level deep
learning, In British Machine Vision Conference
(BMVC), 2017.
Blacoe, W., Lapata, M., (2012). A comparison of Vector
based Representation for Semantic Composition, In
Proceedings of 2012 Joint Conference on Emprical
Methods in natural Language Processing and
Computational Natural Language Learning, pp. 546-
556, 2012.
Jayawardena, S., (2013). Image based automatic vehicle
damage detection. Ph.D. Dissertation, Australian
National University, 2013.
Li, P., Shen, B.Y., Dong, W., (2018). An Anti-fraud System
for Car Insurance Claim Based on Visual Evidence,
arXiv:1804.11207v1, 2018.
Cha, Y.J., Choi, W., Buyukozturk, O., (2017). Deep
Learning based crack damage detection using
convolutional neural networks, Computer Aided Civil
and Infrastructure Engineering, 32(5), 361-378, 2017.
MaskRCNN,(2018).https://www.analyticsvidhya.com/blo
g/2018/07/building-mask-r-cnn-model-detecting-
damage-cars-python
Tractable, (2018). https://www.tractable.io
Szegedy, C., Vanhoucke, V., Ioffe, S., Shlens J., Wojna, Z.,
(2015). Rethinking the Inception Architecture in
Computer Vision, arXiv: 1512.00567v3, 2015.
Deng, J., Dong, W., et al.,, (2009). ImageNet: A large scale
hierarchical image database, in CVPR’2009. IEEE
Conference on Computer Vision and Pattern
Recognition (CVPR), 2009.
Everingham, M., Gool, L.V., Williams, W.K.I, Winn, J.,
Zisserman, A., (2010). The PASCAL Visual Object
Classes (VOC) Challenge, IJCV, 2010.
Razavian, A.S., et al. (2014). CNN features off the shelf:
An astounding Baseline for Recognition, arXiv:
1403.6382v3.
VEHITS 2019 - 5th International Conference on Vehicle Technology and Intelligent Transport Systems
198
