
Prediction of Bike Mobility in Cascais’s Sharing System
Nuno Oliveira, Maricica Nistor and Andr
´
e Dias
CEiiA // Centre of Engineering and Product Development, Av. D. Afonso Henriques, 1825, 4450-017 Matosinhos, Portugal
Keywords:
Bike Sharing Systems, Prediction Models, Relocation Operation, Small Systems and Cities.
Abstract:
Bike sharing systems offer a convenient, ecologic, and economic transport mode that has been increasingly
adopted. However, the distribution of bikes is often unbalanced, which decreases user satisfaction and poten-
tial revenues. Moreover, bike sharing literature is mostly focused on the prediction of demand on large scale
systems and uses simulations for the assessment of relocation operations to increase the number of utilizations.
We propose prediction models based on machine learning approaches to improve the bike sharing re-balancing
in a small city of Portugal. The algorithm aims to improve three metrics, namely (1) increase the number of
utilizations, (2) reduce the number of stations without bikes, (3) reduce the time without available bikes in
the stations. The relocation operations are validated using real data. Our findings show that (a) the estimated
number of utilizations created by this system is substantially higher than the current system by 223%, (b)
our model allows the correct identification of more 70%, 165%, 249% empty stations with the same or sub-
stantially higher precision than the existing approach, (c) the total time of bike unavailability reduced by the
predictive model is 283% higher than the time reduced by current approach (1,394,454 vs 363,971 minutes).
1 INTRODUCTION
Green mobility in the urban areas is a strategic topic
for the city municipalities. This subject is also en-
hanced by the sustainable actions promoted by the
United Nations goals (UN, 2018) and is addressed
by the current emerging technologies, i.e., digitaliza-
tion, electric vehicles. Shared utilization of different
modes of transportation (e.g., bike sharing, car shar-
ing, ride sharing) is a common urban mobility solu-
tion. The bike is one of the most encouraged trans-
portation mode in the cities due to its easy and eco-
nomic utilization in crowded areas and positive envi-
ronmental impact for the city. The city municipalities
together with the stakeholders (e.g., installers, oper-
ators) work together for a smooth integration of the
docked bike sharing systems into the cities, where the
users play a decisive role. Data generated by the bike
sharing systems is valuable to both the city municipal-
ities and the users and it can be used for further analy-
sis, e.g., usage patterns, bike demand, traffic analysis,
environmental conditions.
Many cities have provided their bike sharing data
for research. Literature about this topic applies di-
verse methodologies, analyzes different objectives
and studies various cities. In particular, we analyze
some important works and identify their main objec-
tives, type of applied features and the corresponding
cities. The summary is provided in Table 1. The
majority of these studies focus on the prediction of
demand. Only two papers predict related indicators
such as the number of available bikes or the probabil-
ity of bike unavailability. These works are performed
on large scale bike sharing systems, e.g., New York,
Washington, Hanghzou. The main factors that impact
the bike sharing prediction are mostly related to bike
usage, date, time, weather, and very few consider the
events and the traffic.
In the literature, two main approaches have been
considered for the redistribution of the bikes. In the
first, users get incentives to park the bikes in neigh-
boring stations to reduce the utilization of dedicated
operating staff to relocate the bikes, e.g., (Haider
et al., 2017). In the second, the re-balancing is done
by a fleet of trucks that move around the city to re-
locate the bikes according to the demand. But, as re-
ported by (ITDP, 2014), the redistribution of the bikes
has a significant cost which is 30% of the total oper-
ating cost.
Bike sharing prediction is valuable for re-
balancing operations. The asymmetric utilization pat-
terns in diverse stations often create unbalanced distri-
butions of bikes. Some stations may be empty or full,
preventing many users from requesting or returning
Oliveira, N., Nistor, M. and Dias, A.
Prediction of Bike Mobility in Cascais’s Sharing System.
DOI: 10.5220/0007724401810192
In Proceedings of the 5th International Conference on Vehicle Technology and Intelligent Transport Systems (VEHITS 2019), pages 181-192
ISBN: 978-989-758-374-2
Copyright
c
2019 by SCITEPRESS – Science and Technology Publications, Lda. All rights reserved
181

Table 1: Literature review for bike sharing prediction models.
Work Objectives Type of Features City
(Frade and Ribeiro, 2014) identify informative traffic, trip characteristics, Coimbra
features for demand prediction slopes
(Gast et al., 2015) prediction of number of date, time, Paris
available bikes bike usage
(Singhvi et al., 2015) demand prediction bike and taxi usage, New York
in stations weather,
and clusters location
(Lin et al., 2018) demand prediction time, bike usage, New York
in stations date, location
(Datta, 2014) demand prediction weather, time, Seattle
in stations location, date,
bike usage
(Yang et al., 2016) demand prediction weather, time, Hanghzou
in stations location,
bike usage, events
(Chen et al., 2016) demand prediction time, weather, New York,
in clusters, bike usage, events, Washington
probability of bike traffic, user
unavailability in stations
(Zhang et al., 2016) trip user, location, Chicago
prediction time, trip,
events
bikes. Diverse works create models to optimize relo-
cation operations (e.g., (Raviv et al., 2013), (Waser-
hole and Jost, 2013)). These operations depend on
various factors such as the number of vehicles, the
capacity of vehicles and the time available for repo-
sitioning. Additionally, these models use predictions
of diverse factors (e.g., unmet demand, probability of
bike unavailability or time of unavailability) to max-
imize the objective function. The main objectives of
these approaches are the reduction of number of sta-
tions without bikes (Freund et al., 2018), (Raviv et al.,
2013), (Fricker and Gast, 2016) and the increase of
the number of utilizations (Waserhole and Jost, 2013).
From the previous literature, we summarize the
following main insights. (1) Most works focus on the
prediction of demand in stations. The improvement of
critical metrics such as the increase of the number of
utilizations and the reduction of the number of empty
stations requires more information to obtain better de-
cisions for relocations (e.g., probability of empty sta-
tion). (2) The analyzed bike sharing systems have
high utilization volumes. Thus, the assessment of the
impact of application of predictive models on small
scale bike sharing systems remains unclear. (3) The
literature using data about performed relocation oper-
ations to validate their results is scarce. Most works
about relocations use simulations to measure their im-
pact. However, the evaluation of the number of addi-
tional utilizations created by relocations is more ro-
bust using real data. (4) The prediction of the time of
bike unavailability has not been explored. These fore-
casts are distinct from the prediction of the probability
of stations without bikes and provide more informa-
tion to calculate the unmet demand.
We address these research opportunities by creat-
ing predictive models to improve three metrics: (1) in-
crease the number of utilizations, (2) reduce the num-
ber of stations without available bikes, (3) reduce the
time of bike unavailability. These predictions are used
to select the stations that shall receive bikes in order to
enhance these indicators. For these purposes, we cre-
ate three different models to predict for each station:
(i) number of check-outs (demand), (ii) time without
available bikes, (iii) probability of bike unavailabil-
ity. Based on the predictions of the demand and time
of bike unavailability, we predict the number of addi-
tional utilizations generated by relocations.
We use data from the MobiCascais bike shar-
ing system (MobiCascais, 2018) in Cascais, Portugal,
which is a bike sharing system with small utilization
volume. This system is continuously increasing its
size, both in stations and number of bikes. Hence, the
prediction is a challenging task and the impact of the
predictive system may be more limited than in large
scale systems, e.g., New York. Moreover, MobiCas-
cais has already executed re-balancing operations to
enhance bike distribution. The data is applied in this
work to: (a) evaluate the prediction of the additional
utilizations, and (b) calculate the improvements on
each evaluation metric relatively to the current Mo-
biCascais relocation strategy. In summary, our main
contributions are:
VEHITS 2019 - 5th International Conference on Vehicle Technology and Intelligent Transport Systems
182

1. Create predictive models that provide better sup-
port for decisions related to the improvement of
three metrics:
• number of utilizations,
• number of empty stations,
• time without available bikes.
2. Evaluate the utility of machine learning ap-
proaches to support the re-balancing operations
on bike sharing systems with small utilization vol-
ume (e.g., MobiCascais).
3. Apply data of performed relocation operations to
evaluate the forecasting of the number of utiliza-
tions created by relocations and measure the im-
provements to the existing re-balancing approach.
The rest of the work is organized as follows. Sec-
tion 2 provides the data analysis, while Section 3
presents the methodology. The results are discussed
in Section 4 and the work concludes with Section 5.
2 DATA ANALYSIS
MobiCascais is an integrated mobility system that in-
cludes bikes, buses, trains and parking services for the
municipality of Cascais, Portugal. Bike sharing is an
important component of this system because it per-
mits an ecologic transportation without major time
schedule constraints and provides an easy intercon-
nection with other services. The service has started
in 2016 and has been gradually increasing its activ-
ity. This work uses data from 1st of January, 2017
to 16th of November, 2018. Bike sharing data con-
tains information about each utilization, namely: (a)
identification of the user and bike associated with the
utilization, (b) start and end time of the utilization,
(c) identification of the start and end stations and cor-
responding GPS coordinates, (d) identification of the
start and end docks. In addition, we collect the mete-
orological data from Weather Underground API (Un-
derground, 2018) that contains information about the
precipitation intensity, temperature, wind speed, visi-
bility and cloudiness for each hour in Cascais.
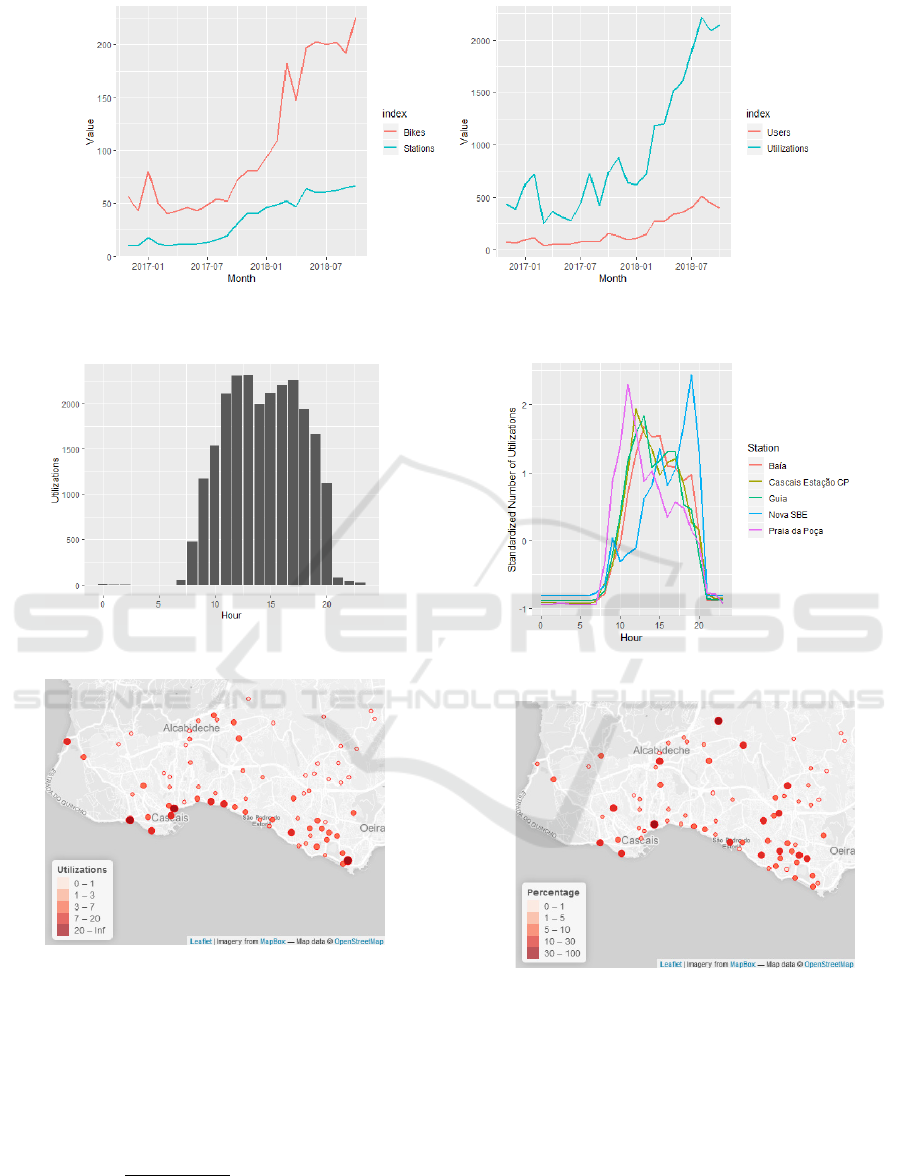
Figure 1 shows the monthly number of bikes, sta-
tions, users, and utilizations. MobiCascais has been
providing more bikes and stations to correspond to
the increasing number of active users. Moreover,
users are becoming more frequent because the num-
ber of utilizations is growing at a higher rate than
the number of users. The demand for these services
varies with time and geography. For instance, Fig-
ure 2 demonstrates that utilization fluctuates during
each day, starting from 08:00 AM until 08:00 PM hav-
ing its peak at lunch time.
Furthermore, stations present different activity
patterns. Figure 3 presents the median of weekly de-
mand for each station. Some stations have more than
20 weekly utilizations while many others have nearly
none. However, this volume is insignificant when
compared to big cities bike systems (e.g., New York).
Temporal patterns of utilization are also quite dif-
ferent between stations. Figure 4 depicts activity lev-
els for each hour of the day of the five most active sta-
tions. The fluctuating temporal and spatial utilizations
cause an unbalanced distribution of bikes that create
major limitations. For instance, it is usual that some
stations are empty preventing users from using bikes
from their favorite station. Indeed, there are diverse
situations of empty stations. The percentage of time
without available bikes for each station is presented in
Figure 5. Some stations are empty more than 10% of
the time, including some of the most active stations.
Therefore, it is obvious that a more balanced distribu-
tion could permit a higher number of utilizations.
MobiCascais is already performing relocation op-
erations to improve bike distribution. These opera-
tions are decided based on personal experience. How-
ever, predictive models may suggest more accurate
real-time relocation decisions. Bikes can be used by
common users or by MobiCascais maintenance staff
to execute maintenance tasks. These latter situations
could be related to bike repairs or just to relocate bikes
between stations to obtain a better bike distribution
and increase bikes availability. The number of these
utilizations is shown in Figure 6. Approximately 1900
bikes are moved by maintenance services to enhance
bike distribution.
3 METHODOLOGY
To create predictive models, we apply bike shar-
ing data extracted from the MobiCascais system
and weather data collected from the Weather Under-
ground API. The overview of the methodology is pre-
sented in Figure 7.
3.1 Prediction Models
This work provides predictive models to improve
three main metrics: (a) reduce the number of stations
without bikes, (b) reduce time without available bikes,
(c) increase the number of utilizations. Therefore,
to minimize the number of empty stations, we create
models that predict the probability that each station
will be empty during the next period. To minimize
the time without available bikes, we develop models
that forecast the number of minutes without bikes in
Prediction of Bike Mobility in Cascais’s Sharing System
183
(a) (b)
Figure 1: Number of bikes, stations, utilizations, and users during the defined period.
Figure 2: Hourly utilization per day.
Figure 3: Median weekly pick-ups for each station.
each station. To maximize the number of utilizations,
we produce models that predict the number of utiliza-
tions created by re-balancing operations in each sta-
tion. The predicted number of additional utilizations
obtained by relocations is calculated based on the pre-
dicted demand and the predicted number of minutes
without bikes using the following formula:
prediction ·
minutes w/o bikes
total minutes
.
The predictive models should be flexible to fore-
cast for new stations because MobiCascais has been
expanding its bike sharing system. Thus, we create
Figure 4: Hourly utilization for the five most used stations.
Figure 5: Time percentage w/o bikes at each station.
predictive models able to predict for new installed sta-
tions. These models perform hourly predictions for
the next 24 hours. For example, the predicted utiliza-
tion for a specific station is the estimated number of
bike pickups for the next 24 hours. We decided to
use this approach for two main reasons: (1) hourly
predictions to be able to have more solid comparisons
with existing relocation tasks that are made at differ-
ent hours of day, (2) predictions for 24 hour windows
because the volume of utilizations is too low to use a
VEHITS 2019 - 5th International Conference on Vehicle Technology and Intelligent Transport Systems
184
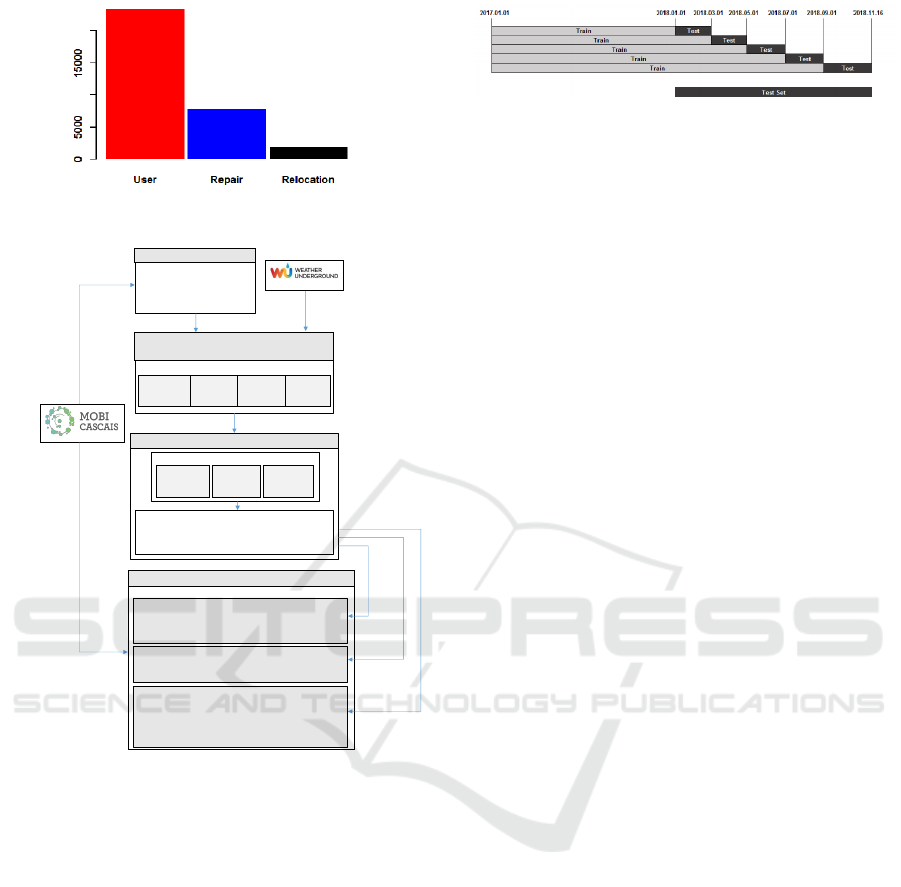
Figure 6: Number of bike utilization by each type.
Time without available bikes
Number of check-outs
Number of check-ins
Bike unavailability
Number of available bikes
Calculation of indicators
Feature datasets (January 1, 2017 to November 16, 2018)
Feature creation (lags, statistics, date and time, number of
available bikes, weather)
Time
without
bikes
Number of
check-outs
Number of
check-ins
Bike
unavailability
Weather data
Bike sharing indicators
Predictive models (XGBoost)
Time
without
bikes
Demand
Probability
bike
unavailability
Forecasts (January 1, 2018 to November 16, 2018):
Time without available bikes
Probability of bike unavailability
Additional utilizations
Prediction
Bike sharing data
Feature Datasets
Improvements for three metrics (January 1, 2018 to November 16, 2018)
Reduce number of stations without bikes:
Predict bike unavailability (precision, recall, F1 score)
Number of stations without bikes avoided (algorithm vs
baseline)
Reduce time without available bikes:
Prediction quality (RMSE, MAE)
Total time without bikes avoided (algorithm vs baseline)
Increase number of utilizations:
Identify situations that increase utilization (precision, recall,
F1 score)
Average and median number of additional utilizations
Estimated number of additional utilizations (algorithm vs
baseline)
Evaluation
Forecasts:
probability of
bike
unavailability
Forecasts: time
without bikes
Forecasts: additional
utilizations
Real relocation operations
(baseline)
Figure 7: Overview of the methodology.
shorter time interval, e.g., one hour interval. More-
over, a longer time window permits an easier relo-
cation planning. This scheme produces overlapping
periods that are properly considered in evaluation.
Bike sharing data contains diverse relocation oper-
ations already performed by MobiCascais. However,
we intend to forecast re-balancing factors based ex-
clusively on user activity. Therefore, we minimize the
maintenance influence by reducing their activity on
the prediction of the probability of empty stations and
time without available bikes. If we exclude all main-
tenance activity, some stations would have long peri-
ods with large negative number of bikes and other sta-
tions would have very large positive number of bikes,
exceeding their capacity by a considerable margin.
Thus, we assume the real number of bikes at the pre-
diction moment, but we exclude all relocation tasks
during the remaining period. The number of available
bikes at each station is recalculated for each dataset
Figure 8: Data sets.
instance by subtracting relocation arrivals and adding
relocation departures that occurred during the corre-
sponding period. The identification of empty stations
and the calculation of time with unavailable bikes are
executed based on these recomputed values.
For the creation of each predictive model, we pro-
duce a large set of features to characterize four differ-
ent time series: number of check-ins and check-outs,
time of bike unavailability and minimum number of
bikes at each station. The following set of features is
created for each series:
• values of last 10 hours, last 6 days at the same
time and last 6 weeks at the same time and day of
the week,
• average values of last 7 days,
• median, maximum, minimum and standard devia-
tion of last 6 days and 6 weeks.
The values of the last hours correspond to one
hour intervals to avoid data leakage. Moreover, we
add other features to each predictive model: (a) num-
ber of available bikes at the station at prediction mo-
ment, (b) hour of day, day of the week, month and hol-
idays, (c) precipitation, intensity, temperature, wind
speed, visibility, cloudiness.
A robust evaluation of time series problems re-
quires that data splitting for training and testing
should be made chronologically to avoid data leakage.
Thus, test data must be posterior to all training data.
This scheme also simulates real world prediction en-
vironment, in which we are restricted to data up to
the present to forecast future (Tashman, 2000). The
evolution of MobiCascais bike sharing system (e.g.,
growing number of utilizations, users and stations)
makes long-term forecasts more difficult. The con-
stant modification of the characteristics of MobiCas-
cais time series may impact the performance of mod-
els that are trained with distant data from the predic-
tion moment. Therefore, we implement the scheme
illustrated in Figure 8 to obtain a larger forecast pe-
riod that may permit a more solid evaluation. The
training dataset is extended in five different moments
to produce forecasts for the next time window (usu-
ally two months). Hence, we obtain and extend test
dataset (more than 10 months) with acceptable accu-
racy levels.
This work applies the XGBoost algorithm for
all predictive models. XGBoost is a gradient tree
Prediction of Bike Mobility in Cascais’s Sharing System
185

boosting algorithm known for its accuracy and ef-
ficient utilization of computational resources (Chen
and Guestrin, 2016). XGBoost is the winning algo-
rithm of many machine learning competitions, partic-
ularly for classification and regression problems using
structured data. R tool (http://www.r-project.org) is
applied in all processing tasks such as data collection,
pre-processing, modeling and evaluation.
All predictive models apply the default XG-
Boost parameters, except objective function, evalua-
tion metric and number of boosting iterations. The
objective function for regressions problems (predic-
tion of time of bike unavailability and demand) is lin-
ear regression (reg:linear), while logistic regression
(binary:logistic) is applied for the classification model
(prediction of the probability of empty station). The
number of boosting iterations for each training model
is set according to the evaluation values obtained in
the validation set (last 25% of training data) using
50 early stopping rounds. For this procedure, we se-
lect Root-Mean-Squared Error (RMSE) as the eval-
uation metric for regression problems and area under
precision-recall curve (aucpr) for the prediction of the
probability of empty stations.
3.2 Evaluation
In this section, we will evaluate the contributions of
our predictive algorithms for the test period (Jan.,
2018 to Nov., 2018) by assessing three main metrics:
(a) number of stations without bikes, (b) time without
available bikes, (c) number of utilizations.
3.2.1 Number of Stations without Bikes
The contribution to reduce the number of stations
without bikes is measured by analyzing the perfor-
mance of the predictive model for empty stations to
identify stations that will not have any available bike
at some point in the next 24 hours. To avoid overlap-
ping situations, we evaluate predictions for an unique
hour of the day (00:00 AM). Moreover, we exclude
stations that are already empty at the prediction mo-
ment because the output is already known. The per-
formance of the predictive model is measured by three
metrics:
• Precision:
T P
T P+FP
• Recall:
T P
T P+FN
• F1 Score: 2 ·
Precision·Recall
Precision+Recall
,
where TP is the number of true positives (empty sta-
tions correctly predicted by the model), FP is the
number of false positives (stations wrongly predicted
as empty), FN is the number of false negatives (sta-
tions wrongly predicted as non-empty). F1 score is
useful because aggregates precision and recall into a
single measure.
The precision-recall curve analyzes the trade-off
between precision and recall for different thresh-
old values and is particularly useful for imbalanced
datasets like this one. The selection of the threshold
value can be motivated by different business criteria.
For instance, a lower budget for relocations may mo-
tivate the selection of a high precision value and a
lower recall value. To quantify the potential benefits
obtained by this predictive model when compared to
the existing MobiCascais approach, we calculate the
number of correctly identified situations by the algo-
rithm according to three criteria: (a) select the same
number of relocations made by MobiCascais services
in the same period, (b) use the same precision value
obtained by MobiCascais relocations, (c) apply the
threshold that maximizes the F1 score. Therefore, we
assess the impact that the predictive model for empty
stations could have on reducing the number of empty
stations relatively to the actual approach.
3.2.2 Time without Available Bikes
The contribution to reduce the time without available
bikes is made by the predictive model of time unavail-
ability. We apply RMSE and Mean Absolute Error
(MAE) to measure the quality of predictions. These
metrics are given by:
RMSE =
s
1
n
n
∑
j=1
(y
j
− ˆy
j
)
2
(1)
MAE =
1
n
n
∑
j=1
|y
j
− ˆy
2
j
| (2)
where y
j
and ˆy
j
are the target and predicted value
for the j-th situation and n is the number of forecasts
considered. RMSE is more sensitive to large errors
than MAE. The improvements achieved by this model
relatively to the current approach are measured by
comparing the total number of minutes of bike un-
availability avoided by both methods using the same
number of relocations. The selection of situations by
the predictive model is performed on the forecasts
made for the same hour of the day (00:00 AM) to
avoid overlapping situations.
3.2.3 Number of Utilizations
The contribution to increase the number of bike uti-
lizations is ensured by the predictive algorithm for
additional utilizations. The dataset about the relo-
cation operations already performed by MobiCascais
VEHITS 2019 - 5th International Conference on Vehicle Technology and Intelligent Transport Systems
186

has higher value in this evaluation because the cor-
rect number of additional usages due to relocations
are only available for the real executed relocations.
For the remaining cases, these values are only esti-
mates. A precision-recall curve is used to assess the
predictive capability to identify situations leading to
additional utilizations by applying a binary output (0
meaning zero additional utilizations, 1 meaning posi-
tive additional utilizations).
The ability to predict the number of additional uti-
lizations is also analyzed by showing the median and
average number of additional usages for different sets
selected by the algorithm. These groups correspond
to the top predictions sorted by decreasing order. The
average number is calculated for all selected situa-
tions while the median is only calculated for the se-
lected situations that have additional utilizations be-
cause most cases do not have additional utilizations.
These values are compared with the precision, aver-
age and median number of additional utilizations ob-
tained by MobiCascais relocations. To estimate the
benefits that could be obtained by the application of
the algorithm in the whole test period without the
relocation data restrictions, we project the potential
number of additional utilizations caused by the sug-
gested relocations. For this purpose, we select the
threshold that maximizes the F1 score in the reloca-
tion dataset and its corresponding average number of
additional utilizations. The suggested relocations are
the predictions made for 00:00 AM of the whole test
period that are higher or equal than the threshold. The
total number of additional utilizations is calculated as:
Tutl = Treloc ·Uavg (3)
where Treloc is the number of proposed relocations
and U avg is the average number of additional uti-
lizations obtained by the threshold in the relocation
dataset evaluation. The potential contribution to in-
crease the number of utilizations relatively to the cur-
rent relocation strategy is the difference between Tutl
and the total number of additional utilizations ob-
tained by the existing approach.
4 RESULTS
This section analyzes the results obtained with this
work. The findings are presented and discussed ac-
cording to the evaluation procedure described in the
previous section.
Figure 9: Precision-recall for the number of stations without
bikes.
4.1 Impact on the Number of Stations
without Bikes
The relocation operations performed by MobiCascais
successfully identified 196 stations during the test pe-
riod that ran out of bikes at some point in the next 24
hours. This value corresponds to 25.8% of the total
number of relocations tasks executed on stations that
were not empty at the time of the operation (761 relo-
cations). Figure 9 shows the precision-recall curve for
forecasts made by the predictive model for the prob-
ability of empty stations on the test set. As explained
in the evaluation subsection, this assessment is per-
formed on all predictions made at 00:00 AM in the
complete test period (i.e., 19,394 forecasts).
The precision-recall curve shows that the predic-
tive model reaches an accuracy higher than 45% for
a recall score of 10% recall. Then, the precision
slightly decreases until the recall score reaches 45%.
The predictive model maximizes the F1 score with
a precision of 36% and a recall of 46%. To mea-
sure the potential improvements, we verify the num-
ber of empty stations that are correctly identified by
the algorithm using three different parameters: (1) se-
lection of the same number of relocations executed
by MobiCascais, (2) utilization of the same precision
achieved by MobiCascais relocations, (3) application
of the threshold that maximizes the F1 score. The se-
lection of the same number of relocations (i.e., 761)
permits the correct identification of 334 empty sta-
tions with a precision of 43.9%. This is a substan-
tially higher precision value than the obtained by the
current relocation strategy (43.9% vs 25.8%) for also
a higher recall. The utilization of the same preci-
sion (i.e., 25.8%) allows the successful detection of
685 empty stations, corresponding to a recall greater
than 60%. For the same precision, this strategy could
identify more 489 empty stations than the current ap-
proach. The application of the threshold maximizing
F1 score enables the correct identification of 519 sit-
uations with a precision of 36%. Therefore, the ap-
Prediction of Bike Mobility in Cascais’s Sharing System
187

plication of these three criteria always enables im-
provements when compare to the current approach. It
would be possible to correctly identify more 138 (i.e.,
70%), 323 (i.e., 165%) or 489 (i.e., 249%) empty sta-
tions with the same or substantially higher precision.
4.2 Impact on the Time without
Available Bikes
The model for the time of bike unavailability predicts
the number of minutes without bikes in the next 24
hours for each station. Thus, the predictions and tar-
get values range from 0 to 1,440. These forecasts
obtained the following evaluation values: RMSE is
114.12 and MAE is 43.42. An example of the pre-
dicted and real number of minutes without available
bikes at each station is provided in Figure 10 for a
specific day, i.e., 23rd of August 2018.
To have a simple baseline for the predictive ac-
curacy, we also evaluate the utilization of the aver-
age number of minutes without bikes for each sta-
tion as the forecast for each instance. The baseline
obtains the following values: RMSE is 289.14 and
MAE is 135.88. The evaluation results of the model
of time of bike unavailability are significantly lower
than this baseline. To assess the ability of this predic-
tive model to reduce the time of bike unavailability
relatively to the current relocation approach, we com-
pare the total number of minutes without bikes using
the same number of relocations for both methods. In-
deed, the utilization of the predictive model permits to
reduce 1,394,454 minutes in bike unavailability while
the existing approach decreases 363,971 minutes of
bike unavailability, corresponding to 26% of the time
reduced by the predictive model.
4.3 Impact on the Number of
Utilizations
A major objective of relocation operations is to in-
crease the number of utilizations by moving unused
bikes to stations without enough bikes to satisfy their
demand. Therefore, more users can pick-up a bike
from their favorite station. This work suggests the ap-
plication of the predictive algorithm of additional uti-
lizations caused by relocations to improve the identi-
fication of re-balancing operations that may increase
the number of utilizations. An example of the pre-
dicted and real number of check-outs for each station
is provided in Figure 11 for a specific day, i.e., 23rd of
August 2018. The results from the prediction model
are close to the real one, as indicated by the figure.
The additional utilizations of bikes caused by re-
location of the bikes from one station to another is
provided in Figure 12. Approximately 17% of the re-
location operations made by MobiCascais permit to
increase the total number of utilizations. In these sit-
uations, there are pick-ups of bikes that would not
be available without those relocations. The average
number of these additional utilizations is 0.61. Fig-
ure 13 shows the median and average number of ad-
ditional usages for different selections made by the
algorithm. These selected sets are the top predictions
sorted by decreasing order (e.g., 10% in the x-axis are
the 10% highest forecasts).
The algorithm demonstrates the capacity to iden-
tify those situations that generate more utilizations.
Both median and average number of utilizations de-
crease as the selected number of predictions in-
creases. Figure 14 presents the precision-recall curve
for the identification of situations that may generate
additional utilizations. In general, the precision of the
algorithm decreases with the increase of the recall.
Thus, the forecast value is correlated with the prob-
ability of additional utilizations. The highest F1 score
is 48.22% corresponding to a precision of 35.44% and
a recall of 75.44%. It is a precision value that is sub-
stantially higher than the obtained by the Cascais ser-
vices (35.44% vs 17%) for a very high recall value.
Nevertheless, it can be argued that the precision of
MobiCascais services is for a larger number of reloca-
tions. Indeed, this precision-recall curve is restricted
to the same relocation operations made by MobiCas-
cais. Therefore, the algorithm will always obtain the
same precision of MobiCascais for a recall score of
100% with these evaluation settings. The utilization
of the relocation dataset is very important to perform
a solid evaluation of predictive capacity of additional
utilizations, but it limits the scope of application of the
algorithm. To measure the potential improvements
in the number of utilizations, it is necessary to apply
the algorithm in a larger test set, without the restric-
tions of the performed relocations. As described in
the evaluation section, we calculate the potential num-
ber of additional utilizations during the test period
by using the threshold that maximizes the F1 score
in the relocation dataset and its corresponding aver-
age number of additional utilizations. The utilization
of this threshold allows the selection of 1,380 relo-
cations (Treloc). The average number of generated
utilizations for this threshold is 1.428 (Uavg). The
estimated number of additional utilizations is 1,971
(Tutl), which is substantially higher (i.e., 223%) than
the 610 relocations obtained by MobiCascais in the
same period.
In summary, the algorithm shows predictive ca-
pacity to identify stations that shall receive bikes to
increase the number of utilizations. For example, the
VEHITS 2019 - 5th International Conference on Vehicle Technology and Intelligent Transport Systems
188
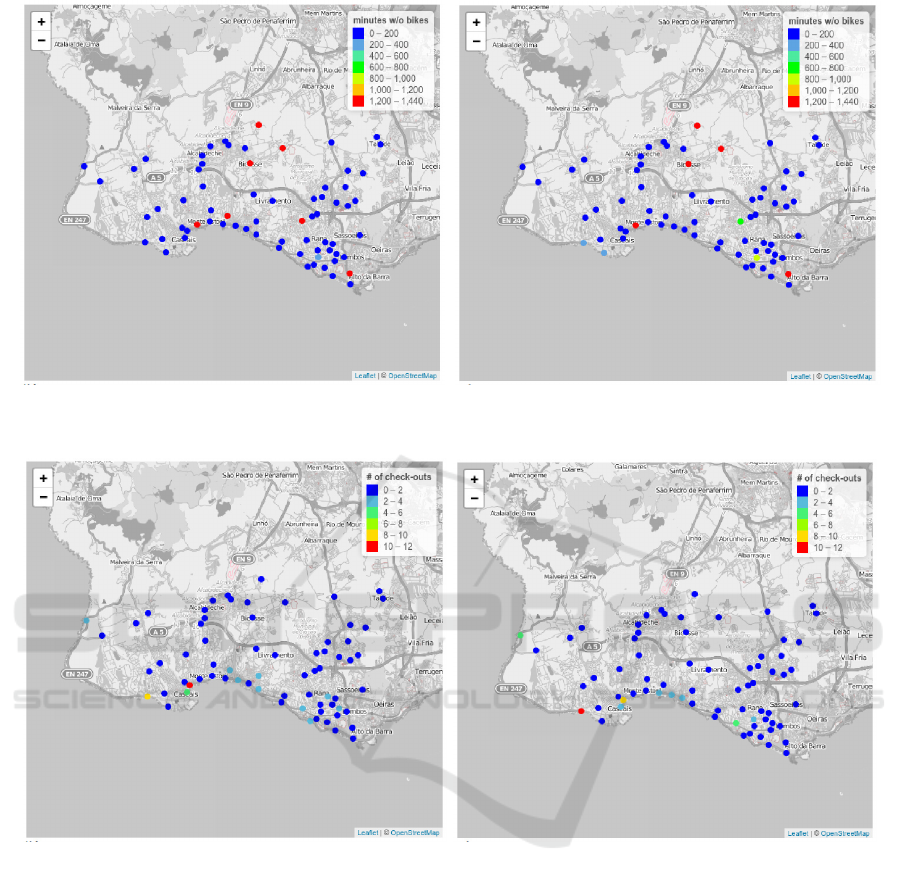
(a) Real (b) Predicted
Figure 10: Number of minutes w/o available bikes at each station.
(a) Real (b) Predicted
Figure 11: Demand prediction at each station.
highest predictions permit a more accurate selection
of relocations that may generate utilizations. More-
over, these top selections usually create a larger num-
ber of utilizations. This superior predictive ability is
valuable because it allows to increase the number of
utilizations and consequently revenues and user satis-
faction. For instance, the estimated number of utiliza-
tions created by relocations suggested by the predic-
tive algorithm in the whole test period is three times
higher than the number of utilizations created by the
MobiCascais operations.
5 CONCLUSIONS AND FUTURE
WORK
The asymmetric and fluctuating usage patterns in bike
sharing systems create diverse situations of empty or
full stations, preventing their users from using or re-
turning bikes. Therefore, the unbalanced distribution
of bikes has serious impact on user satisfaction and
number of utilizations. Re-balancing operations per-
mit to reduce these problematic situations. Planning
these relocations requires accurate predictions of dif-
ferent bike sharing indicators. For instance, the se-
lection of stations that should receive bikes may ben-
Prediction of Bike Mobility in Cascais’s Sharing System
189
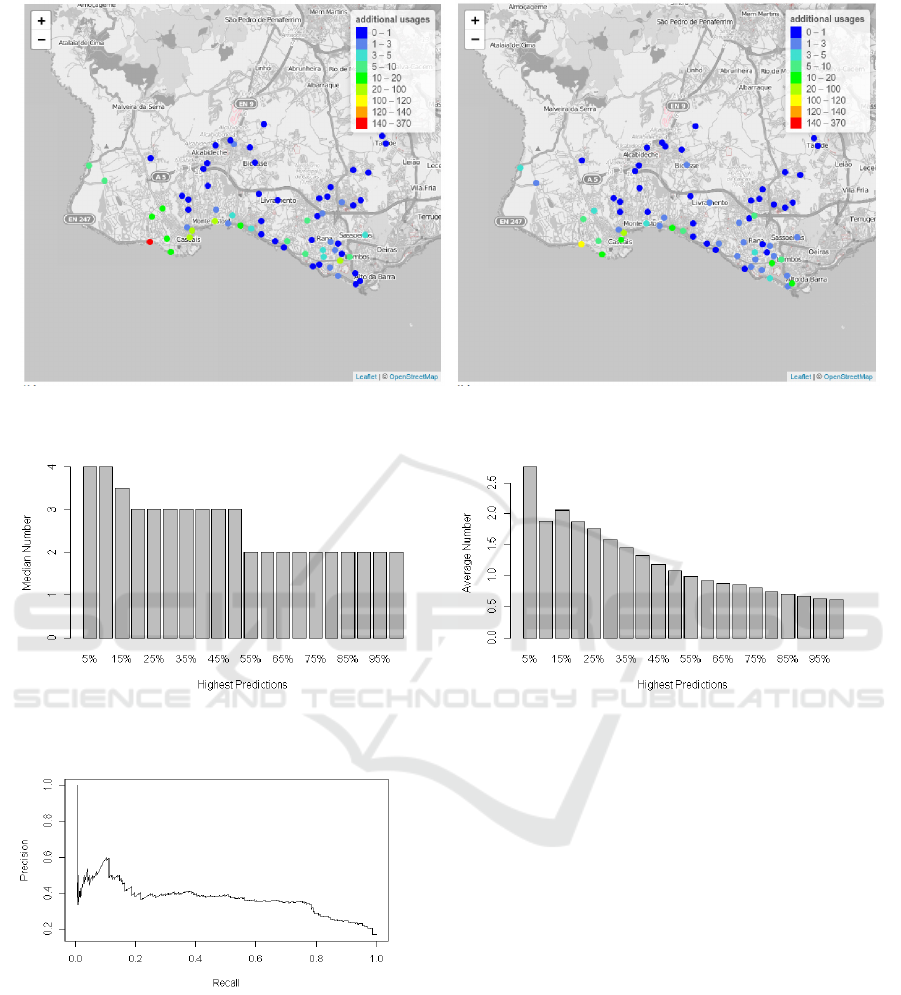
(a) Real (b) Predicted
Figure 12: Additional bike utilizations by relocation of bikes at each station.
(a) Median (b) Average
Figure 13: Median and average number of additional usages.
Figure 14: Precision-recall for the number of additional uti-
lizations.
efit from the utilization of accurate forecasts of the
probability of stations running out of bikes in the
next hours. Literature about bike sharing prediction is
mostly focused on the prediction of demand on large
scale systems. However, other predictions (e.g., ad-
ditional utilizations created by relocations, probabil-
ity of empty stations) may improve re-balancing de-
cisions and consequently enhance some performance
metrics (e.g., number of utilizations, number of empty
stations). Moreover, the assessment of the contribu-
tion of relocation operations to increase the number
of utilizations has mainly used simulations. How-
ever, the application of data about real executed relo-
cations permits a more robust evaluation of this con-
tribution. This work analyzed the potential benefits
of the utilization of a machine learning approach to
support the re-balancing strategy of MobiCascais, a
bike sharing system with low utilization volume. Pre-
dictive models were created to support the selection
of stations that should receive bikes to improve three
different metrics: (a) number of utilizations, (b) num-
ber of stations without bikes, (c) time without avail-
able bikes. Data of relocation operations already per-
formed by MobiCascais was used to evaluate the pre-
diction of the number of utilizations created by relo-
cations and to measure the improvements to the cur-
rent re-balancing strategy. Evaluation results indicate
that the proposed machine learning approach permits
to enhance relocation decisions. The predictive al-
VEHITS 2019 - 5th International Conference on Vehicle Technology and Intelligent Transport Systems
190

gorithm of the number of utilizations generated by
relocations seems to have substantially higher preci-
sion to identify situations leading to additional utiliza-
tions. For instance, its predictions obtain a precision
score higher than 35% for a recall score higher than
75% in the evaluation on performed relocations. Only
17% of the relocation operations made by MobiCas-
cais increased the total number of utilizations. The
estimated number of utilizations created by the relo-
cations is also much higher than the ones obtained by
the MobiCascais relocation services in the same pe-
riod (1,971 vs 610).
The predictive model of the probability of sta-
tions running out of bikes in the next 24 hours al-
lows to reduce the number of empty stations. While
the existing re-balancing approach correctly identified
196 stations that became empty, our model obtained
the following values: (a) 334 empty stations for the
same number of relocations; (b) 685 empty stations
for the same precision; (c) 519 empty stations using
the threshold that maximizes the F1 score. Therefore,
it allowed the correct identification of more 138, 323
or 489 empty stations with the same or substantially
higher precision than the existing approach.
The predictive model of the number of minutes
without bikes also improves another performance
metric. The number of minutes of bike unavailabil-
ity was reduced by 1,394,454, while the existing re-
location strategy approach decreased 363,971 min-
utes (i.e., 26% of the time reduced by the predictive
model).
In summary, the predictive models created in this
work improve the performance of the re-balancing op-
erations according to three different criteria. Thus,
the utilization of machine learning approaches seems
to be valuable even for bike sharing systems with
much lower utilization than most systems studied in
this topic. Hyper-parameter tuning, feature selection
and the utilization of other machine learning meth-
ods may enlarge these benefits. Improvements on
the efficiency of re-balancing operations may have di-
verse advantages such as the increase of the number
of utilizations, revenues, user satisfaction, number of
frequent users and the reduction of the operational
costs. The predictive models created in this work
answer an important question of the relocation deci-
sions: what stations should receive bikes?. However,
diverse questions remains unanswered and should be
analyzed in future research. For instance, a complete
decision support system for relocation should also
suggest the number of bikes that each station should
receive or provide.
ACKNOWLEDGEMENTS
This article is a result of the Generation.mobi
project (17369), supported by Competitiveness and
Internationalization Operational Programme (COM-
PETE 2020), under the PORTUGAL 2020 Part-
nership Agreement, through the European Regional
Development Fund (ERDF) and the Sharing Cities
project (691895-SHAR-LLM), under Horizon 2020
programme (H2020-SCC-2014-2015). We would like
to thank the Cascais team for the information pro-
vided.
REFERENCES
Chen, L., Zhang, D., Wang, L., Yang, D., Ma, X., Li,
S., Wu, Z., Pan, G., Nguyen, T., and Jakubowicz, J.
(2016). Dynamic cluster-based over-demand predic-
tion in bike sharing systems. In UbiComp, Heidelberg,
Germany.
Chen, T. and Guestrin, C. (2016). Xgboost: A scalable
tree boosting system. In Proceedings of the 22nd
ACM SIGKDD International Conference on Knowl-
edge Discovery and Data Mining, San Francisco, Cal-
ifornia.
Datta, A. (2014). Predicting bike-share usage patterns with
machine learning. Master’s Thesis Autumn 2014, Uni-
versity of Oslo.
Frade, I. and Ribeiro, A. (2014). Bicycle sharing systems
demand. Procedia - Social and Behavioral Sciences,
111.
Freund, D., Henderson, S., and Shmoys, D. (2018). Min-
imizing multimodular functions and allocating ca-
pacity in bike-sharing systems? In Available at:
https://arxiv.org/abs/1611.09304.
Fricker, C. and Gast, N. (2016). Incentives and redistri-
bution in homogeneous bike-sharing system with sta-
tions of finite capacity. Euro Journal on Transporta-
tion and Logistics, 5.
Gast, N., Massonnet, G., and Reijsbergen, D. (2015). Prob-
abilistic forecasts of bike-sharing systems for journey
planning. In Proceedings of the 24th ACM Interna-
tional on Conference on Information and Knowledge
Management, Melbourne, Australia.
Haider, Z., Nikolaev, A., Kang, J., and Kwon, C. (2017).
Inventory rebalancing through pricing in public bike
sharing systems. 17h IEEE International Conference
on Mobile Data Management, 270.
ITDP (2014). European electricity grid initiative roadmap
and implementation plan. Technical report.
Lin, L., Peeta, S., He, Z., and Wen, X. (2018). Pre-
dicting station-level hourly demands in a large-
scale bike-sharing network: A graph convolu-
tional neural network approach. Available at:
http://arxiv.org/abs/1712.04997.
MobiCascais (2018). Mobicascais project. https://
www.mobicascais.pt/. Online; accessed Nov. 2018.
Prediction of Bike Mobility in Cascais’s Sharing System
191

Raviv, T., Tzur, M., and Forma, I. (2013). Static reposi-
tioning in a bike-sharing system: models and solution
approaches. Euro Journal on Transportation and Lo-
gistics, 2.
Singhvi, D., Singhvi, S., Frazier, P., Henderson, S., Ma-
hony, E., Shmoys, D., and Woodard, D. (2015). Pre-
dicting bike usage for new york city’s bike sharing
system. In AAAI Workshop: Computational Sustain-
ability, Texas, USA.
Tashman, L. (2000). Out-of-sample tests of forecasting ac-
curacy: an analysis and review. International Journal
of Forecasting, 16.
UN (2018). Sustainable development goals. https://
www.un.org/sustainabledevelopment/ sustainable-
development-goals/. Online; accessed Aug. 2018.
Underground, W. (2018). Weather data set.
www.wunderground.com. Online; accessed Aug
2018.
Waserhole, A. and Jost, V. (2013). Vehicle shar-
ing system pricing regulation: A fluid approxima-
tion. In Available at: https://hal.archives-ouvertes.fr/
hal-00727041.
Yang, Z., Hu, J., Shu, Y., Cheng, P., Chen, J., and Mosci-
broda, T. (2016). Mobility modeling and prediction in
bike-sharing systems. In MobiSys, Singapore.
Zhang, J., Pan, X., Li, M., and Yu, P. (2016). Bicycle-
sharing system analysis and trip prediction. In 17h
IEEE International Conference on Mobile Data Man-
agement, Porto, Portugal.
VEHITS 2019 - 5th International Conference on Vehicle Technology and Intelligent Transport Systems
192
