
Learning from Others’ Mistakes: An Analysis of Cyber-security Incidents
Giovanni Abbiati
1,3
, Silvio Ranise
3
, Antonio Schizzerotto
2,3
and Alberto Siena
3
1
Fondazione Rodolfo Debenedetti, Milan, Italy
2
University of Trento, Trento, Italy
3
Fondazione Bruno Kessler, Trento, Italy
Keywords:
Cybersecurity, Data Analytics.
Abstract:
Cyber security incidents can have dramatic economic, social and institutional impact. The task of providing an
adequate cyber-security posture to companies and organisations is far far from trivial and need the collection
of information about threats from a wide range of sources. One such a source is history in the form of datasets
containing information about past cyber-security incidents including date, size, type of attacks, and industry
sector. Unfortunately, there are few publicly available datasets of this kind that are of good quality. The paper
reports our initial efforts in building a large datasets of cyber-security incidents that contains around 14,000
entries by merging a collection of four publicly available datasets of different size and provenance. We also
perform an analysis of the combined dataset, discuss our findings, and discuss the limitations of the proposed
approach.
1 INTRODUCTION
Cyber security incidents, such as intentional attacks
or accidental disclosures, can have serious economic,
social and institutional effects. The average total cost
for companies and institutions spans from $7.35 mil-
lions in the U.S. to $1.52 million in Brazil, with a
notable relation between the cost of the data breach
and the number of lost records (Ponemon Institute,
2017). In this context, data about past cyber security
incidents can give an insight on potential vulnerabil-
ities and attack types, thus helping to prevent them,
provided that the data are available and have enough
quality. Commercial reports on security incidents and
data breaches can be easily retrieved; for example,
(statista, 2018) is a well known online service that re-
ports the annual number of data breaches and exposed
records in the U.S. from 2005 to 2018. While these
reports are potentially interesting, the lack of trans-
parency on their generation method, as well as their
(intended) non-academic audience, makes it difficult
to use them in scientific work. On the other hand, aca-
demic works that take a quantitative approach to the
analysis of data breaches are less numerous. In (Ed-
wards et al., 2016), authors analyse data from the Pri-
vacy Rights Clearinghouse (PRC), and draw the con-
clusion that publicly reported data breaches in the
USA have not increased significantly over the past 10
years, either in frequency or in size. (Wheatley et al.,
2016) combined two different datasets, DataLossDB
(currently unmaintained as public dataset) and the
mentioned PRC, finding divergent trends between US
and non-US firms. (Xu et al., 2018) also uses the PRC
dataset to analyse whether the data breaches caused
by cyber attacks are increasing, decreasing, or stabil-
ising. (Romanosky, 2016) reports to have analysed
a commercial dataset of 300,000 observations about
corporate loss events, having extracted a subset of
around 15,000 observations about cybersecurity inci-
dents out of it. As this last work confirms, having ac-
cess to a commercial dataset seems to be a necessity
since publicly available datasets are limited in size (up
to 5,000 events) and this reduces the effectiveness of
several data analysis techniques.
To overcome this data availability limitation, in
this paper we follow the intuition of (Wheatley et al.,
2016), investigating on the possibility to combine
multiple publicly available datasets to obtain a larger
one, capable to support statistically grounded analysis
of security incidents. Specifically, the paper reports
on two main activities. First, we present the under-
taken methodology, highlighting in particular the en-
countered issues, limitations and workarounds. Sec-
ond, we analyse the generated dataset with respect to
the yearly trend, the target business sector, the type
of attack and the magnitude of the attack, with the
Abbiati, G., Ranise, S., Schizzerotto, A. and Siena, A.
Learning from Others’ Mistakes: An Analysis of Cyber-security Incidents.
DOI: 10.5220/0007721202990306
In Proceedings of the 4th International Conference on Internet of Things, Big Data and Security (IoTBDS 2019), pages 299-306
ISBN: 978-989-758-369-8
Copyright
c
2019 by SCITEPRESS – Science and Technology Publications, Lda. All rights reserved
299

twofold objective of extracting useful information and
evaluate the methodology used to generate the data.
The paper is structured as follow: Section 2 de-
scribes the methodology undertaken to collect data
and merge them into a single dataset. Section 3
presents the statistical analysis of the generated data
and the produced results. Section 4 discusses the re-
sults with respect to the objectives and concludes the
paper, outlining the future challenges.
2 METHODOLOGY
Information about cyber-security incidents are re-
ported every day on the media, but a systematic access
to the sources is problematic because is distributed
across a large number of websites and is described in
natural language. Fortunately, there are initiatives that
aggregate news about cyber-security incidents from
third party sites as part of a professional work, making
them available on-line as structured datasets. To have
a wider coverage of the incidents’ reports, we further
aggregate four databases into a larger one. However,
the datasets adopt different structures and are based
on different classifications on key variables, such as
the type of attacks or the economic sector of the firms
affected. For this reason, the first step of this work
aimed at developing a method to overcome the tech-
nical and conceptual discrepancies between different
sources. Below, we report our method, which con-
sists of three main steps: Identification and Collection
(Section 2.1); Mapping and Selection (Section 2.2);
and Redundancy Elimination (Section 2.3). We con-
clude (Section 2.4) with a description of the main fea-
tures of the combined dataset.
2.1 Identification and Collection
We consider in particular four datasets of cyber-
security incidents derived from four websites, de-
tailed in Table 1: PRC: Privacy Rights Clearing-
house — a U.S. -based nonprofit organisation for pri-
vacy awareness and protection of individuals, main-
taining a collections of data-breaches. ITRC: The
Identity Theft Resource Center — a U.S.-based non-
profit organisation, whose mission is to help victims
of identity crimes (e.g., identity theft, scams, and
frauds), provides a collection of data-breaches on
yearly basis. BLI: The Data Breach Level Index —
a website sponsored by Gemalto (which also offers
cyber-security solutions), contains datasets of pub-
licly disclosed data-breaches as well as related statis-
tics with graphical representations. IiB: The ‘In-
formation is Beautiful’ website — which offers vi-
sual representation of data about different phenomena
ranging from infectuous diseases to cyber-security in-
cidents.
Looking at column ‘Description’ in Table 1, the
four datasets appear quite heterogeneous. They are
made available in different formats (CSV, PDF or
HTML), the number of categories associated to in-
cidents varies from 6 to 14, the number of incidents
greatly differ—ranging from few hundreds to several
thousands—as well as their time span. . Additional
sources of heterogeneity emerge as soon as we take a
closer look. First, consider column ‘Attack types’ of
Table 1; two observations are in order: (a) PRC, BLI,
and IiB consider several types of attacks while ITRC
focuses just on one type and (b) the three used classi-
fications differ in the number and types of classes of
attacks. Then, consider column ‘Organization types’
of Table 1; the main remark is that PRC and ITRC use
(different) classifications while BLI and IiB does not.
Finally, observe that BLI also contains a classification
of the attackers.
On the other hand, a lesser degree of heterogene-
ity is detectable on other domains, where the fields
present a similar or identical schema or at least some
conceptual similarity. For these reasons, harmonising
them into a single dataset looks challenging but feasi-
ble, and potentially useful.
2.2 Mapping and Selection
Given the difference and similarities illustrated above,
we combine the four datasets into a single pool con-
taining all the incidents in each dataset with the fol-
lowing 7 categories: Year; Location; Compromised
Records; Source; Entity; Industry; and Cause. Table 2
shows the mapping from the original categories to the
harmonised ones. On the left-end side, our dataset
schema is reported (“Incident”), while the coloured
lines define the mapping of each field to the source
datasets. As concern the year of the incident, the in-
formation source, the target entity, its location, and
the number of compromised records, the mapping is
straightforward, because the values in such categories
are homogenous across the four datasets,. Much of
the effort is needed to harmonise the type of organisa-
tion (Industry) and the type of attack (Cause). More
precisely, we need to perform the following two activ-
ities (1) mapping the original codings and translating
into two homogeneous classifications and (2) check-
ing the homogeneity of the resulting dataset and se-
lecting one or more sub-sets that show some internal
coherence.
Data Mapping. A critical work has been the rec-
onciliation of the attack types — i.e., the cause
IoTBDS 2019 - 4th International Conference on Internet of Things, Big Data and Security
300
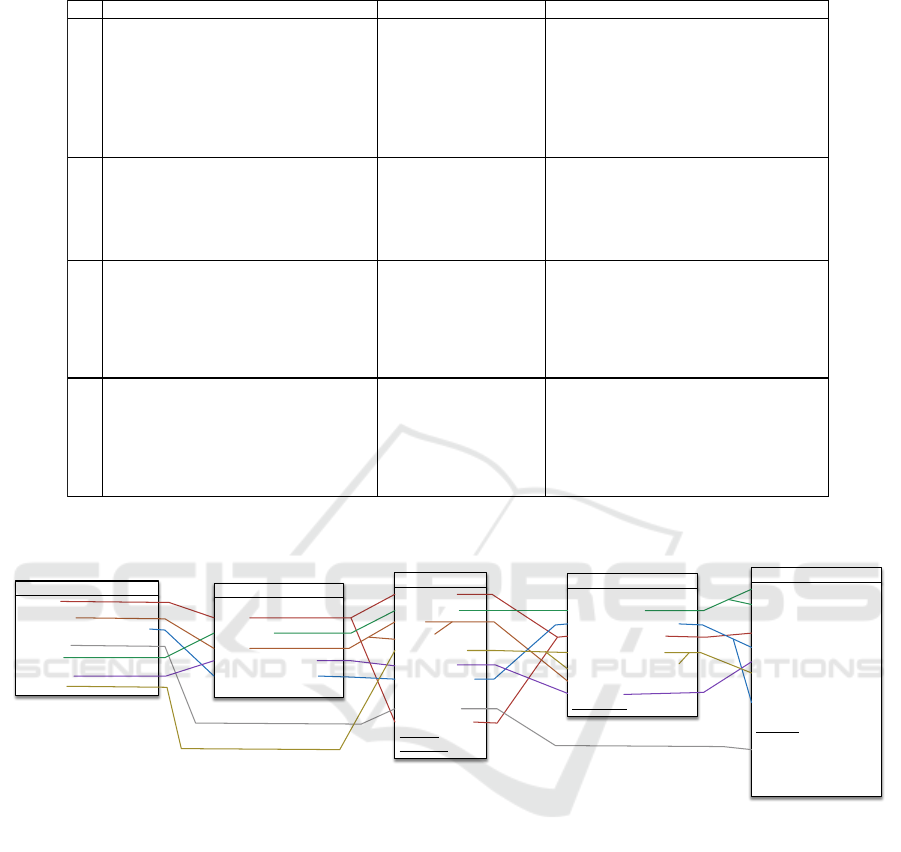
Table 1: Descrition of the four datasets.
ID
Attack types
Format:
CSV
Number of attributes:
12
Number of entries:
4,413
Time range:
2005-2017
Impact: number of records
Format:
set of PDF files
Number of attributes:
6
Number of entries:
5,924
Time range:
2005-2017
Impact:
number of records
Format:
set of HTML pages
Number of attributes:
9
Number of entries:
7,878
Time range:
2013-2018
Impact:
risk score
Format:
Google sheet
Number of attributes:
14
Number of entries:
292
Time range:
2004-2017
Impact: number of records
Description
Organization types
PRC
www.privacyrights.org/data-breaches
1. Payment Card Fraud
2. Hacking or Malware
3. Insider
4. Physical Loss
5. Portable Device
6. Stationary Device
7. Unintended
Disclosure 8. Unknown
1. Bus.-Financial and Insurance Services
2. Bus.-Other
3. Bus.-Retail/Merchant-Including Online
Retail
4. Educational Institutions
5. Government & Military
6. Healthcare, Med. Providers & Med.
Insurance Services
7. Nonprofits 8. Unknown
BLI
breachlevelindex.com/data-breach-
library
1. Identity Theft
2. Account Access
3. Financial Access
4. Existential Data
5. Nuisance
1. Education
2. Entertainment
3. Financial
4. Government
5. Healthcare
6. Hospitality
7. Industrial
8. Insurance
9. Non-profit
10. Retail
11. Social Media
12. Technology
13. Other
ITRC
www.idtheftcenter.org/data-breaches
1. Identity theft
1. Banking/Credit/Finance
2. Business
3. Educational
4. Government/Military
5. Medical/Healthcare
IiB
informationisbeautiful.net/visualizations/
worlds-biggest-data-breaches-hacks
1. accidentally published
2. hacked
3. inside job
4. lost/stolen device or
media
5. poor security
1. academic
2. app
3. energy
4. financial
5. gaming
6. government
7. healthcare
8. legal
9. media
10. military
11. retail
12. tech
13. telecoms
14. transport
15. web
Table 2: Redefinition of the data breach incident report.
breach_ID
year
company
state
breach_category
records_exposed
exposed_record_nr
ITRCIncident
pub_date
company
city
state
attack_type
org_type
total_records
description
source_url
breach_year
latitude
longitude
PRIncident
rank
organization
breached_records
date_od_breach
type_of_breach
source_of_breach
location
industry
risk_score
BLIIncident
entity
alternative_name
story
year
records_lost
organization
method_of_leak
interesting_story
nr_of_stolen_records
data_sensitivity
exclude
1st_source_link
2nd_source_link
3rd_source_link
source_name
IiBIncident
year
location
compromised_records
source
entity
industry
cause
Incident
field. While for some source categories the map-
ping was straightforward (e.g., Inside jobs), others
made it difficult to produce a coherent and shared tax-
onomy of attacks. For example, BLI has two fields,
“Type of breach” and “Source of breach”, which re-
port information about what kind of data has been ac-
cessed (e.g., Financial data, Existential data) and the
source of the breach (e.g., Malicious insider, Hack-
tivist, State sponsored); PRC has a dedicated cate-
gory for payment card frauds, and differentiates var-
ious types of physical losses; ITRC puts in the same
category physical losses and employee errors, while
Improper Disposal is kept separated from an Acciden-
tal disclosure. We ended up with a custom classifica-
tion, which attempts to minimise the number of cat-
egories. Specifically, the following categories have
been identified: (i) two main categories for inten-
tional disclosures: malicious attacks coming form in-
side (Insider job) and from outside (Hacking or Mal-
ware); (ii) one category for unintentional disclosures
(Unintended disclosure); (iii) one category for phys-
ical losses (Lost / Stolen device or media, which can
be hardly differentiated in practice); (iv) one residual
category for other unmapped incidents (Other / Un-
known). Attack types from the source datasets are as-
signed to one of these categories according to a case-
by-case evaluation.
Another field that required reconciliation was the
type of attacked organisation — i.e., the Industry
field. Source datasets classify organisations accord-
ing to differente taxonomies and with different level
of granularity. A complete manual reclassification
was therefore needed. We ended up defining a cus-
tom classification, which tries to optimise the cover-
Learning from Others’ Mistakes: An Analysis of Cyber-security Incidents
301

age and equal distribution of the source categories.
The adopted classification consists in the follow-
ing macro business sectors: (i) Education & Health-
care; (ii) Financial services; (iii) Industrial produc-
tion; (iv) Information & Technology; (v) Standard
commercial activities; (vi) Other privately-held busi-
nesses; (vii) Public administration; (viii) Non-profit;
(ix) Other.
Data Selection. At the end of the data mapping step,
we derived a single dataset containing 16,997 rows.
After an analysis of the entries, it resulted that the
largest number of incidents concerned organisations
or companies located in North America (either USA
or Canada). Specifically, 15,293 incidents occurred
to organisations/companies in North America, corre-
sponding to more than 90% of the total. This is proba-
bly due to two factors: (a) the dataset were taken from
online services located in USA, and (b) these coun-
tries (USA and Canada) are subject to laws and regu-
lations containing mandatory requirements for the no-
tification of security breaches since 2004/2005. We
hence decided to limit our analyses only to incidents
happened in North America.
2.3 Redundacy Elimination
Despite showing some internal coherence, the dataset
obtained after mapping and selection shows some re-
dundancy. There are several sources of redundancy,
that we describe below together with the techniques
that we use to detect and eliminate them.
Duplicated Events. First, redundancy refers to a se-
curity incident reported more than once. Duplicate
cases could be easily removed, but an issue emerges
on the actual definition of “duplicate”. In some cases
two rows reported a security incident in the same
year, concerning the same entity, but only in one case
the number of compromised records was known. A
check on a sample of original incident URL sources
suggested that these instances referred actually to the
same events. Such cases were removed, maintain-
ing the records reporting the number of compromised
records only. The trickiest case referred to records
with similar entity names. Different sources reported
the same incident recording the entity name with dif-
ferent acronyms, shortcuts, legal specifications and
mistakes. We hence identified an additional set of po-
tential duplicates. Here is a list of possible cases:
Differently Decorated Names. Differences could be
related to partial omissions, typically concerning legal
specification (e.g. “Google” and “Google, inc.”). In
this case the two names were unified through a simple
catalog of pattern templates.
Similar Names. A more problematic set of cases
was due to entity names that were actually simi-
lar but no precise detection rule could be defined.
These cases involved typically spelling or punctuation
mistakes (e.g. “HOMECARE OF MID-MISSOURI
INC.” and “HOME CARE OF MID MISSOURI”, or
“COHN HANDLER STURM” and “COHN HAN-
DLES STURM”). These are basically singletons, and
therefore defining pattern matching for all the in-
stances would have resulted in a huge but useless
effort. To overcome this problem, an algorithm has
been applied to spot similar entities.
The algorithm proceeded by comparing all the
possible (n(n − 1))/2 pairs of entities, assigning to
each pair a score, calculated using their Jaro-Winkler
distance. A manual identification of the duplicates
was performed below the threshold of 0.18, a thresh-
old identified after manual tests as the one minimis-
ing both false positives and false negatives.
False Positives. were a major issue in the activ-
ity of similarities identification. Particularly prob-
lematic was the case of entities sharing part of the
name but indicating different institutions (e.g. “Uni-
versity of ...”). This phenomenon had to be con-
trasted with cases of true positives, such as different
branches of a same organisation, such as territorial
units (e.g.“7eleven’ York”, “7eleven Baltimora”).
False Negatives. As for false positives, also false
negatives involve the use of human knowledge and
cannot be easily translated into clear-cut rules. For
example, “Google” and “Alphabet”, in which the lat-
ter is the new corporate name of the first; or “UNI-
VERSITY OF CALIFORNIA LOS ANGELES” and
“UCLA”, where the latter is an acronym for the first.
Once the algorithm has generated the list of candi-
date duplicates, a manual pass allowed us to identify
false positives. To deal with them, a further catalogs
of patterns have been defined, a white list, listing can-
didate duplicates. More difficult was to deal with false
negatives. So far, they are added to a third pattern cat-
alog, the black list, whenever they are identified.
Legal Entities. A last issue concern the legal set-
ting of reported entities. Companies and public ad-
ministrations can be articulated in hierarchies of con-
trolled companies. Controlled companies can have le-
gal personality, and therefore their own name, which
in some cases may differ completely from the origi-
nal. If the same security breach is reported multiple
times and using different names (of the controller and
controlled company), this is not easily identifiable in
an automatic way.
IoTBDS 2019 - 4th International Conference on Internet of Things, Big Data and Security
302
2.4 Merged Dataset
The merged dataset, as resulting from the described
process, contains 14.820 entries. We can not claim
that it is fully duplicate-free, but duplicates also ex-
isted in the source datasets, accounting for around 7%
of the total, on average, and this makes our work com-
parable with the literature. We also inherit other as-
pects of the source datasets: firstly, the dataset con-
tains only attacks reported to authorities, which do
not include foiled or unreported attacks; secondly,
there are many salient information (such as technolo-
gies used by firms and public administration depart-
ments) about which nothing is known. Finally, our
mapping of categories of attacks and organisation re-
mains somehow arbitrary, but unfortunately arbitrari-
ness also affects the source dataset, as none of the
publisher adopted an official classification, assigning
rather their own.
3 DATA ANALYSIS
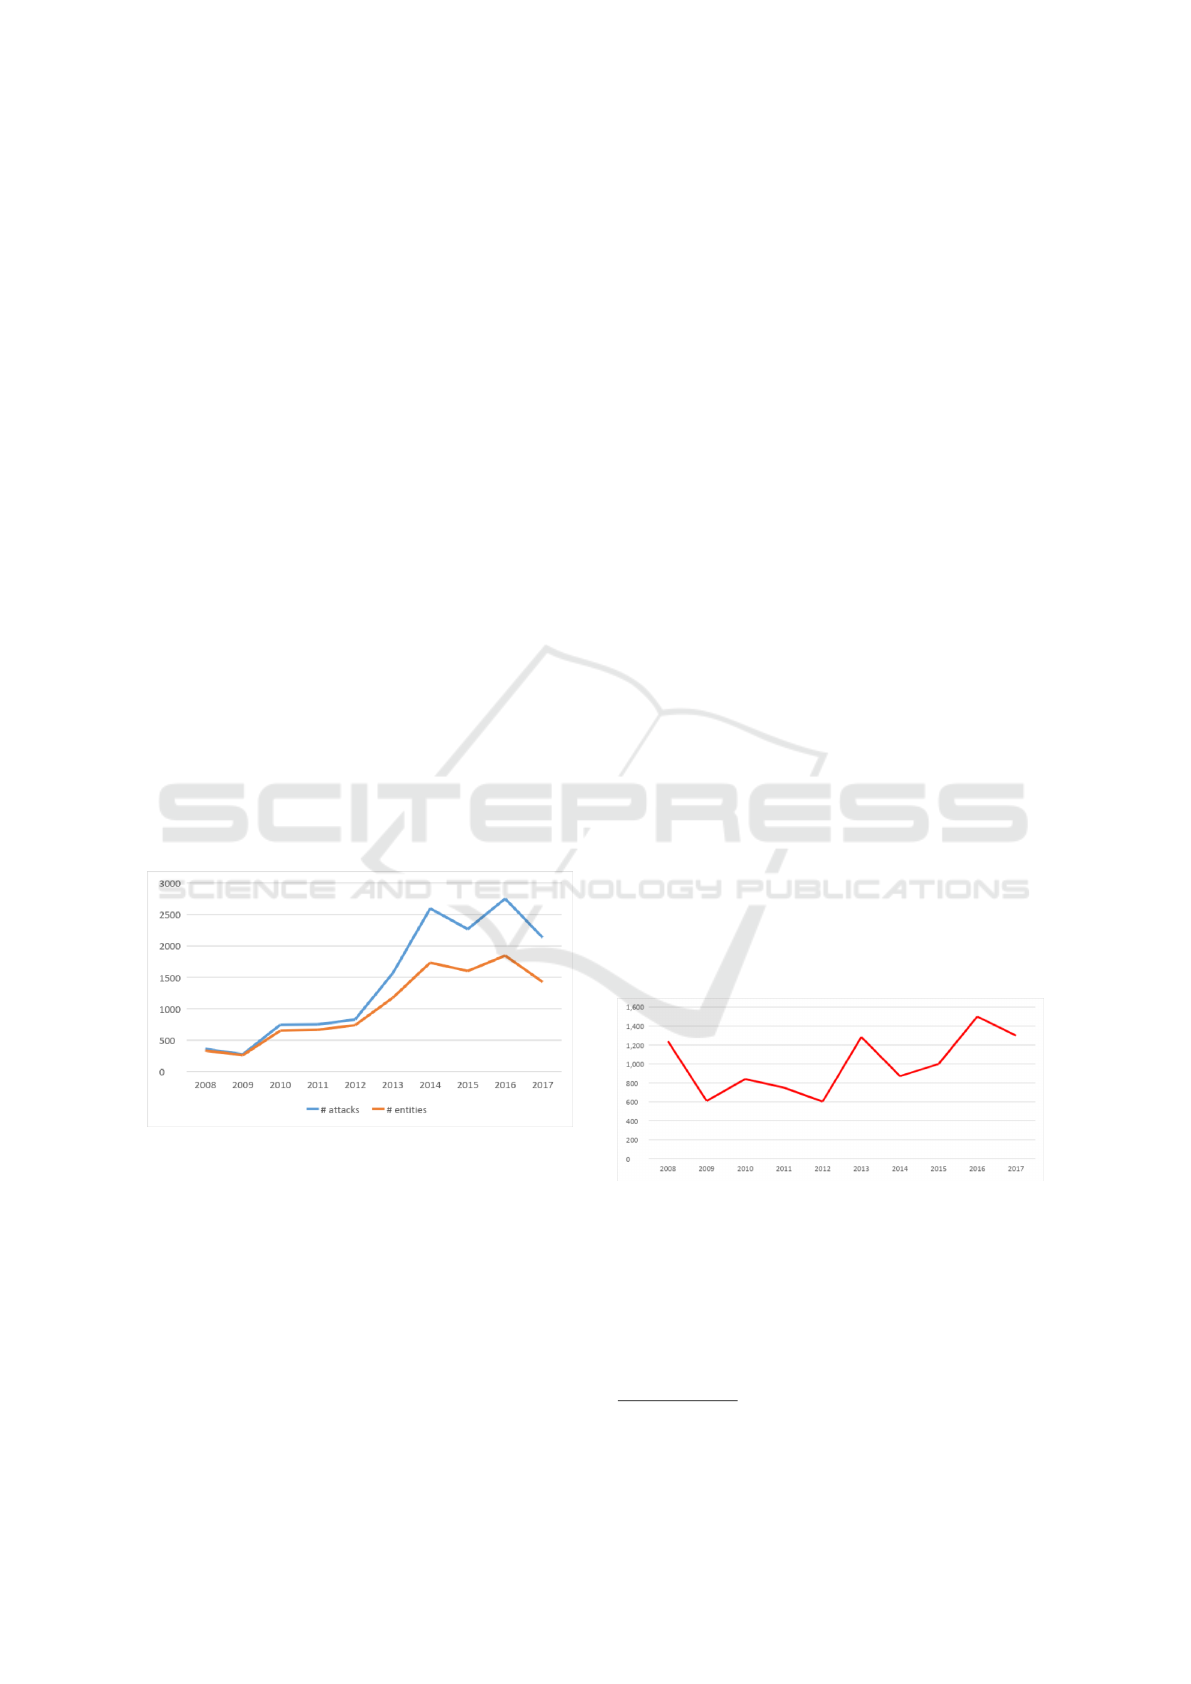
We start our preliminary inspection of the data by
plotting the trends of the number of cyber attacks,
the number of firms involved and a measure of the
damage they caused over the period 2008-2017 (Fig-
ures 1-2).
Figure 1: Yearly reported number of cyber attacks and enti-
ties involved - 2008/2017.
As Figure 1 shows, the reported number of attacks
constantly increased from 2008 onwards. The num-
ber almost tripled from 2009 to 2010 passing from
275 to 746 events and, after two years of relative sta-
bility, sharply increased again from 2012 to 2013, and
since then remained stable. As concern the number of
entities subject to attacks, we can observe that from
2012 onwards their number is steadily lower than the
number of attacks, indicating that a significant frac-
tion of entities received multiple attacks in the same
year. Figure 2 reports, for the same time-span, the
median number of compromised records. In this case
there is no clear-cut trend as in Figure 1. However, it
is worth noticing that the last three years rank among
the highest of the period considered. This evidence
contradicts the optimistic forecasts produced by the
predictive model of (Edwards et al., 2016), according
to which we should have observed a reduction in the
level of damage caused by the attacks, both in median
terms and considering extreme events.
The figure also shows that cyber-attacks can be ex-
tremely harmful for private and public organisations:
the median number of compromised records varies
from 600 up to over 1,400.
The following tables break down the information
on the number of attacks by year and sector (Ta-
ble 3) and their relative significance (Table 4). Ac-
cording to Table 3), the sector mostly damaged by
cyber-attackers is health and education (45%). Sec-
tors such as public administration, financial services,
standard commercial activities account for 11-13% of
reported attacks each. At the bottom of the ranking
stand information and technology (5.5%), industrial
production (0.9%) and no-profit (0.8%). For a resid-
ual 10% of attacks the activity sector was not coded
in the original source. The ranking depicted above
is constantly evolving: health and educational orga-
nizations’ quota is decreasing from the period 2010-
2012 (values around 55%) to the 36.6% registered in
2017. The same relative reduction is found for public
administration, whose quota decreased steadily from
20% (in 2008) to today’s 6%. Conversely, the sec-
tors of finance, industrial production, information and
technology and standard commercial activities see for
the same period an increasing trend.
Figure 2: Median yearly number of compromised records -
2008/2017.
These figures alone, though, cannot provide a
meaningful picture of the exposure of activities to
cyber-attacks. For this reason we calculated the odds
of being target of a cyber attack by sector and year.
Odds ratios describe the relative risk of being attacked
in relations to the sector in which the firm operates.
1
1
Odds are computed by dividing the proportion of year-
by-sector firms attacked by the corresponding proportion of
Learning from Others’ Mistakes: An Analysis of Cyber-security Incidents
303

The situation is depicted in Table 4. Industry and
other commercial activities have a very low incidence
rate all throughout the period, probably given the
small relevance of personal data storage in their activ-
ity. Health and education firms show a very high but
declining trend in the odds of being attacked, passing
from a high value of 5.7 to 4.1. As predictable, finan-
cial services are a relatively common target for cyber-
attackers (odds ratios around 3/4 for all the period
considered), as well as information and technology,
whose odds of being attacked skyrocketed since 2013.
Table 3: Attack by year and sector. Percentages.
!"#$
%&'()*$+#,-
.$/'(0*+/&
%&1/$2#*+/
&-#&'-
*"03&/,/45
6+&#&0+#,-
)"$7+0")
8'(0#*+/&-
9-
:"#,*30#$"
;*3"$-
0/22"$0+#
,-#0*+7+*+")
<&'"1+&"'-
.$+7#*",5=
3",'
>(?,+0-
#'2+&+)*$#
*+/&
@/&=.$/1+*
<&A&/B&
C/*#,
DEEF
0.0 0.6 12.2 43.6 8.1 0.0 20.3 0.3 15.0 GEE
DEEH
0.0 1.8 9.5 50.9 4.7 0.0 19.6 0.0 13.5 GEE
DEGE
0.0 0.7 13.1 55.1 11.4 0.0 13.7 0.0 6.0 GEE
DEGG
0.0 0.8 7.1 56.9 11.1 0.0 11.7 0.4 12.1 GEE
DEGD
0.1 1.7 8.7 54.3 12.6 0.0 10.8 2.4 9.4 GEE
DEGI
0.1 6.1 12.2 48.2 10.9 0.0 11.1 0.5 11.1 GEE
DEGJ
0.0 4.5 11.1 53.3 10.9 2.5 11.7 0.2 5.7 GEE
DEGK
0.0 5.5 15.3 37.1 13.9 5.8 12.2 0.1 10.1 GEE
DEGL
1.8 9.1 13.4 40.0 15.6 4.3 9.5 1. 5 4.8 GEE
DEGM
3.8 7.6 15.1 36.6 16.1 10.7 5.7 1.7 2.8 GEE
C/*#, ENH KNK GDNM JKNG GINE INF GENF ENF MNJ GEE
Table 4: Relative risk for a firm of being attacked, by sector.
YEAR
Industrial/
production
Information/
and/technology
Financial/
services
Education/&/
Healthcare
Other/
commercial/
activities
2008 0.0 0.3 4.5 5.7 0.2
2009 0.0 0.9 3.4 6.2 0.1
2010 0.0 0.3 4.1 5.3 0.2
2011 0.0 0.2 2.3 5.9 0.2
2012 0.0 0.4 3.0 5.4 0.3
2013 0.0 2.3 3.5 5.0 0.2
2014 0.0 1.9 3.2 5.3 0.2
2015 0.0 2.4 4.6 4.4 0.3
2016 0.1 3.3 3.9 4.3 0.3
2017 0.2 2.7 4.1 4.1 0.3
Table 5 illustrates the attacks by type. The trends
depicted show the rapidly changing geography of the
way cyber-attacks are conducted: an increasing ma-
jority of attacks are conducted via hacking and mal-
ware, along with the diffusion of online tools to work
and store data. At the same time, all other attack
types are losing importance: stolen devices or media
pass from 48.9% in 2008 to a residual 1.5%; inside
active firms in USA. Values equal to 1 mean that exposure is
in line with the sector size; values greater than 1 mean over-
exposure; values comprised from 0 to 1 mean the contrary.
Table 5: Type of attack by year (percentage).
Year
Hacking+
or+
Malware
Inside+job
Stolen+
device+or+
media
Poor+
security
Unintend
ed+
disclosur
Other+/+
Unknown
Total
2008
16.1 8.6 48.9 0.0 22.5 3.9 100
2009
19.3 10.9 46.9 0.0 19.3 3.6 100
2010
14.9 13.1 52.4 0.0 13.9 5.6 100
2011
21.8 12.3 45.5 0.3 14.4 5.7 100
2012
30.1 10.8 38.5 0.0 15.3 5.3 100
2013
44.3 15.3 15.3 0.1 21.3 3.6 100
2014
41.1 11.2 6.7 0.1 17.2 23.8 100
2015
45.1 9.6 4.0 0.1 16.3 24.9 100
2016
50.0 5.1 2.9 0.0 13.7 28.2 100
2017
42.5 4.0 1.5 0.1 9.2 42.9 100
Total 39.9 9.2 13.8 0.1 15.4 21.6 100
jobs and unintended disclosure show a similar, even
though less spectacular, decrease, both falling under
10% during the last year. The “other /unknown” cat-
egory is currently the modal one and we conjecture
that this data has two different explanations: the first
refers to the ability of cyber attackers. The smoother
is the attack, the more difficult it is to identify, and
then report, its actual cause. The second one refers
to the quality of the data. A part of it may be in fact
attributable to sloppiness in reporting the attacks. We
have indirect evidence of it when cross-tabulating the
sector with the type of attack (Table 6): the rising cat-
egory “undefined privately held businesses” (perhaps
another example of sloppiness) is the one for which
most of the attacks are of unknown origin. As con-
cern the rest of the sectors, it is interesting to notice
how hacking and malware represents by far the main
problem in all the sectors except from health and
education, where unintended disclosure and stolen
devices are a big issue, and public administration,
which sees various sources of attacks.
Table 6: Type of attack by sector (percentage).
Sector/Type+of+attack
Hacking+or+
Malware
Inside+job
Stolen+
device+or+
media
Poor+
security
Unintende
d+
disclosure
Other+/+
Unknown
Total
Industrial+production
53.4 3.0 0.8 0.8 3.8 38.4 100
Information+and+Technology
65.5
2.7 0.5 0.3 10.3 20.8 100
Financial+services
41.8 10.1 7.7 0.0 14.4 26.1 100
Education+&+Healthcare
32.2 9.7 22.3 0.1 18.3 17.5 100
Other+commercial+activities
59.5
8.5 4.5 0.0 7.0 20.5 100
Undefined+privately-held+businesses
2.2
0.0 0.0 0.0 0.2 97.6 100
Public+administration
29.4 14.2 11.0 0.1 25.9 19.3 100
Non-profit
51.3 5.0 10.1 0.0 6.7 26.9 100
Unknown+
62.5 9.6 12.4 0.0 12.5 3.1 100
Total 39.9 9.2 13.8 0.1 15.4 21.6 100
IoTBDS 2019 - 4th International Conference on Internet of Things, Big Data and Security
304

4 DISCUSSION AND
CONCLUSION
The paper reports our initial efforts in building a large
dataset of cyber-security incidents by merging a col-
lection of four publicly available datasets of different
size and provenance, overcoming the lack of publicly
available datasets of substantial size observed in pre-
vious research (Romanosky, 2016).
By analysing the resulting dataset with standard
statistical techniques, our work confirms the gener-
ally observed rapidity with which the phenomenon
of cyber-attacks is evolving. While incidents caused
by malicious outsiders passed from 16% to 50% in
a time-span of just five years, other leading causes
of data breaches such as malicious insiders and un-
intended disclosures lost most of their importance in
the same period. There may be multiple causes un-
derlying this trend. On the one hand, the decreasing
relevance of unintended disclosures and malicious in-
siders may be the result of the adoption of better se-
curity procedures and awareness programs by compa-
nies and organisations. On the other hand, remote at-
tacks are more and more widespread because of the
explosion of personal and sensitive data available on-
line resulting from the digitalisation of many aspects
of our lives. These factors seem to confirm the idea
that organisations and companies should take a holis-
tic approach and tune their cyber-security postures ac-
cording to a variety of sources about threats and coun-
termeasures including cyber-intelligence information
about current threats provided by, e.g., national or
international Computer Emergency Response Teams
(CERTs). It is thus not surprising that the forecasts
about the size of 2015 and 2016 data breaches con-
tained in (Edwards et al., 2016) remain partly un-
achieved.
Concerning the limitations of our approach, two
issues must be considered. The first is related to the
coverage of data and is shared with previous work
(e.g., (Romanosky, 2016)). Since the four datasets
used to build ours are based on public notifications to
authorities, it is unclear whether the data are repre-
sentative of the overall phenomenon of cyber-attacks
or not. We draw this consideration from the compari-
son of two figures. In our dataset, the share of private
USA companies and organisations involved in secu-
rity breaches amounts to minuscule figures, namely
0.02% (or less) per year. An official report based on
a representative UK sample highlights that 67% of
medium-large firms have suffered from cyber-attacks
in 2016 (Klahr et al., 2017). The corresponding num-
ber for Italy in the same period, based on another na-
tional representative survey, is 43% (Biancotti, 2017).
We are currently gathering additional sources of in-
formation to understand to what extent our analyses
reflects actual trends operating in the overall popu-
lation of US firms and organization. The second is-
sue to be considered is the remarkable amount of ef-
fort required to make the merged dataset coherent and
uniform. The result is apparently worth the effort; a
database derived from publicly available information
that is comparable in size to that used in (Romanosky,
2016), which is privately owned and contains around
15,000 descriptions of data breaches. However, we
acknowledge that the relevance of the results depends
on the quality of the generated dataset, which in turn
depends on the quality of the method used to join
the source datasets: it must be able to eliminate re-
dundancies and consistently map the source categori-
sations into one which is general enough to accom-
modate those used in the initial datasets and—at the
same time—not too coarse to loose precision and sig-
nificance in the analysis phase. To tackle this issue,
our future efforts will be devoted to reach a high-level
of automation of the various steps of the methodol-
ogy by developing a toolkit for automatically collect-
ing, tidying, mapping, and merging datasets of cyber-
security incidents. The main benefit of developing
such a toolkit is flexibility along two dimensions.
First, it will be possible to experiment with different
taxonomies for the types of attacks and economic sec-
tors to better identify which option minimises the loss
of precision and coherence when merging different
datasets. Ultimately, this would reduce the level of ar-
bitrariness in the data manipulations besides those im-
posed by the publishers of the original datasets. The
second dimension is a tighter integration with the data
analysis phase: depending on the results of the latter,
we can decide to investigate some features of the com-
ponent datasets and use the results to fine-tune some
aspects of the collection, selection, mapping, and re-
dundancy elimination steps. The flexibility deriving
from a high-level degree of automation of the method-
ology will also simplify the inclusion of new datasets,
increase the size of the merged dataset, and possibly
make the application of a wider range of data analy-
sis techniques.
The present work has revealed some preliminary
results and interesting potentialities, but it has also
highlighted issues and limitations. This raises an im-
portant observation. As stated in Section 1, several
surveys and statistical reports are available online,
mostly from private companies. Since the issues we
reported depend only partially from our approach, it
should be argued that the reports available online suf-
fer the same limitations and issues. This calls for a
deeper scientific exploration of the available data, to
Learning from Others’ Mistakes: An Analysis of Cyber-security Incidents
305

better evaluate the quality of the dataset and make
transparent and questionable the results.
In short, our future work will focus to make
“learning from others’ mistakes” possible for a wide
range of professionals involved in managing cyber-
security (such as technologists, insurers, or policy
makers) by providing adequate tool support to the
methodology described in this work and perform
more extensive investigations about the datasets con-
sidered here and others that will be made avail-
able to us. As a firs concrete step to promote
the use of our datasets and methodology, we pro-
vide pointers to the on-line datasets and the merged
one, plus additional material, at the following ad-
dress: https://sites.google.com/fbk.eu/ fbk-cybersec-
flagship-project.
REFERENCES
Biancotti, C. (2017). The price of cyber (in) security: evi-
dence from the italian private sector. Occasional Pa-
pers (Questioni di economia e finanza), (407).
Edwards, B., Hofmeyr, S., and Forrest, S. (2016). Hype and
heavy tails: A closer look at data breaches. Journal of
Cybersecurity, 2(1):3–14.
Klahr, R., Shah, J., Sheriffs, P., Rossington, T., Pestell,
G., Button, M., and Wang, V. (2017). Cyber security
breaches survey 2017: main report.
Ponemon Institute (2017). 2017 cost of data breach study.
https://public.dhe.ibm.com/common/ssi/ecm/se/en/
sel03130wwen/security-ibm-security-services-se-
research-report-sel03130wwen-20180122.pdf.
Romanosky, S. (2016). Examining the costs and causes of
cyber incidents. Journal of Cybersecurity, 2(2):121–
135.
statista (2018). Annual number of data breaches and ex-
posed records in the united states from 2005 to 2018.
https://www.statista.com/statistics/273550/data-
breaches-recorded-in-the-united-states-by-number-
of-breaches-and-records-exposed/.
Wheatley, S., Maillart, T., and Sornette, D. (2016). The
extreme risk of personal data breaches and the erosion
of privacy. European Physical Journal B, 89:7.
Xu, M., Schweitzer, K. M., Bateman, R. M., and Xu,
S. (2018). Modeling and predicting cyber hacking
breaches. IEEE Transactions on Information Foren-
sics and Security, 13(11):2856–2871.
IoTBDS 2019 - 4th International Conference on Internet of Things, Big Data and Security
306
