
An Effective RF-based Intrusion Detection Algorithm with Feature
Reduction and Transformation
Jinxia Wei, Chun Long, Wei Wan, Yurou Zhang, Jing Zhao and Guanyao Du
Department of Security, Computer Network Information Center, Chinese Academy of Sciences, Beijing, China
Keywords: Intrusion Detection, Random Forest (RF), Correlation Analysis, Logarithm Marginal Density Ratio.
Abstract: Intrusion detection systems are essential in the field of network security. To improve the performance of
detection model, many machine learning algorithms have been applied to intrusion detection models. Higher-
quality data is critical to the accuracy of detection model and could greatly improve the performance. In this
paper, an effective random forest-based intrusion detection algorithm with feature reduction and
transformation is proposed. Specifically, we implement the correlation analysis and logarithm marginal
density ratio to reduce and strengthen the original features respectively, which can greatly improve accuracy
rate of classifier. The proposed classification system was deployed on NSL-KDD dataset. The experimental
results show that this paper achieves better results than other related methods in terms of false alarm rate,
accuracy, detection rate and running time.
1 INTRODUCTION
In current society, the information security becomes
more important in the field of network security.
Traditional security protection measures, such as
signature technology, access control and
authentication, may miss severe complex attacks
because the accidents cannot be accurately
discovered. Therefore, intrusion detection
technologies have received great attention (Luo,
2014) (Tjhai, 2010) (Kuang, 2014) (Lin, 2015).
The intrusion detection was first introduced in
1980. With the development of intrusion detection
technology, many machine learning algorithms have
been applied to intrusion detection models (Buczak,
2016) (Al-Jarrah, 2016) (Zheng, 2014), including
Artificial Neural Network (ANN) (Wang, 2010),
Decision Tree (DT) (Eesa, 2015) (Kim, 2014),
Support Vector Machine (SVM) (Bamakan, 2016)
(Feng, 2014) (Mohammed, 2012) (Horng, 2011),
Self-Organizing Map (SOM) (De La Hoz, 2014) (De
La Hoz, 2015), Naïve Bayes Network (Koc, 2012)
(Louvieris, 2013) (Mukherjee, 2012), K-nearest
neighbor (K-NN) (Liao, 2002) and so on.
Among them, the frame of support vector machine
(SVM) is becoming extremely popular and performs
better (Bamakan, 2016) (Li, 2012) than other
approaches. Fu et al. (Fu, 2012) presented a self-
evolving framework for anomaly detection. In this
paper, two class and one class SVM were combined
to build the intrusion detection models, which had
outstanding advantages for classifying imbalanced
datasets. To improve the performance of intrusion
detection systems, more studies have combined SVM
algorithm with other methods. In literature
(Bamakan, 2016), Bamakan et al. combined SVM
with the time-varying chaos particle swarm
optimization which was used to optimize the
parameters of SVM. Although the SVM was superior
to other intrusion detection in performance, the
training and testing time was long. Also, these
methods made use of all characteristics of the original
datasets to build intrusion detection model.
In fact, the dimensions of data characteristics may
affect the performance of intrusion detection model.
Large data may cause consumption of resources and
reduce the performance of intrusion detection
systems. Therefore, it is important to preprocess and
reduce feature dimensions. Akashdeep et al.
(Manzoor, 2017) proposed a feature reduced intrusion
detection system and proved that feature reduction
can not only acquire higher accuracy but also reduce
training time of model.
Considering the calculation time of the detection
model and data reduction, the random forest is a
reasonable choice (Farnaaz, 2016). In (Farnaaz,
2016), Farnaaz and Jabbar built a model for intrusion
detection model using random forest classifier.
Wei, J., Long, C., Wan, W., Zhang, Y., Zhao, J. and Du, G.
An Effective RF-based Intrusion Detection Algorithm with Feature Reduction and Transformation.
DOI: 10.5220/0007718602210228
In Proceedings of the 21st International Conference on Enterprise Information Systems (ICEIS 2019), pages 221-228
ISBN: 978-989-758-372-8
Copyright
c
2019 by SCITEPRESS – Science and Technology Publications, Lda. All rights reserved
221

Random forest (RF) was an ensemble classifier and
performed well compared to other traditional single
classifier for detecting attacks. The empirical results
illustrated that their method had high detection rate
and low false alarm. A real-time intrusion detection
model with feature reduction was presented by
Sangkatsance et al. (Sangkatsance, 2011), and
achieved detection rate of 98% in Probe and Dos
attack classes. In 2014, Liu et al. (Liu, 2014) used
clustered mutual information hybrid method to
achieve feature reduction and selection. To improve
the performance of Liu’s model, Al-Jarrah et al. (Al-
Jarrah, 2014) realized feature reduction by combining
random forest-backward elimination ranking and
random forest-forward selection ranking. Compared
with original feature sets, the reduced feature sets
resulted in false alarm rate to 0.01%.
Although these models have higher performance,
the quality of data are not considered. In fact, the
quality of the intrusion detection data is crucial for
performance of the intrusion detection models.
Based on the above analysis, our paper proposes
an effective RF-based intrusion detection algorithm
that solves the classification problem with feature
reduction and augmentation. In this approach, the
correlation analysis and logarithm marginal density
ratio (LMDR) are used to realize feature reduction
and transformation. Then, the new high-quality
training data can be obtained and applied to train the
SVM classifier. In addition to improving the
performance of classifier, this approach greatly
shortens the training time. First, after undergoing
feature reduction based on correlation analysis, the
dimensions of features are reduced. That is, the
training complexity is reduced. Second, the LMDR is
applied to transform the reduced feature to a new
feature with augmentation. The classifier is trained by
using this high-quality data improves the detection
performance and generalization capability.
2 PRELIMINARY
2.1 Feature Transformation by
Logarithm Marginal Density Ratios
(Wang, 2017)
The feature transformation by logarithm marginal
density ratios was presented in (Mohammed, 2012).
Suppose
( , )YX
is a set of random variables, where
p
RX
denotes the one sample with
p
-dimension
feature,
{0,1}Y
is the corresponding binary
response. Let
g
and
f
denotes the classification
conditional density of 0 and 1 respectively, that is
( 0)~=YgX
,
( 1)~=YfX
. The Bayes decision
rule holds that
( ( ) 1/ 2)Ir x
, where
( ) ( 1 ) ( )r P Y E Y= = = = =x X x X x
.
Let
( 1)PY
==
, we have
( ) ( ) ( ( ) (1 ) ( ))r f f g
= + −x x x x
(1)
Further, let
1/ 2
=
, the following equation can
be obtained
()
{ : =1} { :log ( ) log ( ) 0}
()
f
fg
g
= − =
x
x x x x
x
(2)
Let
11
( ), , ( )
pp
g x g x
and
11
( ), , ( )
pp
f x f x
are respectively the marginal density of
()g x
and
()f x
, where
1
= ( , , )
T
p
xxx
,
j
x
represents the
(1 )j j p
th original feature. According to the
independence assumption of Naïve Bayes, the
conditional distributions of feature that given class
labels are independent of each other, we have
1
()
log = log ( ) ( )
()
p
j j j j
j
f
f x g x
g
=
x
x
(3)
log ( ) ( )
j j j j
f x g x
in (3) is the marginal density
ratios of the
(1 )j j p
th feature.
2.2 Feature Sorting based on
Correlation Analysis
Correlation metrics are widely applied in machine
learning and statistical correlation analysis to
evaluate the correlation between features. The
selection of correlation metrics affects the efficiency
of feature selection greatly. The correlation degree
between two random variables is usually measured by
entropy and mutual information which are defined in
information theory.
Definition 1. For a discrete feature vector
12
{ , , , }
T
n
X x x x
, its probability distribution can
be expressed as
12
{ ( ), ( ), , ( )}
n
p x p x p x
, then
entropy of feature
X
is as follows:
2
1
( ) ( )log ( )
n
ii
i
H X p x p x
=
=−
(4)
If all the values of
X
are the same, then the
entropy of
X
is 0. Thus, the feature
X
is useless for
data classification.
ICEIS 2019 - 21st International Conference on Enterprise Information Systems
222

Definition 2. For two discrete features
12
{ , , , }
T
n
X x x x
and
12
{ , , , }
m
Y y y y
, their
joint probability density is
( , ),1 , 1p x y i n j m
ij
, and conditional
density is
()p x y
ij
, then entropy of
X
under the
condition
Y
can be expressed as
()
log
2
( , )
( ) ( , )
11
py
j
p x y
ij
nm
H X Y p x y
ij
ij
=
==
(5)
The mutual information is generated and derived
from entropy. For two features
X
and
Y
in one
dataset, the mutual information between them is as
follows:
2
11
( ; )
( ) ( )
( , )
( , )log
( ) ( )
nm
ij
ij
ij
ij
I X Y
H X H X Y
p x y
p x y
p x p y
==
=−
=
(6)
The mutual information has the following
characteristics:
Symmetry:
( ; ) ( ; )I X Y I Y X=
Monotonic: if
A B C
, then
( ; ) ( ; )I A C I B C=
The mutual information reflects the amount of
information shared between two random variables.
The greater value of the mutual information, the
greater correlation between the two variables. If the
mutual information between two variables is 0, the
two variables are completely uncorrelated and
statistically independent in probability.
3 PROPOSED SCHEME
In this section, the detailed procedures of proposed
methodology are illustrated. The correlation analysis
is used to feature selection or reduction, the logarithm
marginal density ratios is applied to transformation.
Then, the random forest is trained with newly
transformed data.
3.1 Feature Reduction
3.1.1 Correlation Calculation
The correlation between each feature and
classification label is calculated by correlation
analysis methods. Detailed steps are as follows:
▪ For a certain feature vector
{ , , , }
12
T
X x x x
n
and its corresponding
label
{0, 1}Y
,
n
is the number of samples,
their correlation metrics are generated by
equations (4)-(6). The correlation metrics can be
further standardized and expressed as
( ; )
( , )
( ) ( )
I X Y
SU X Y
H X H Y
=
+
(7)
Thus, the values of correlation metrics between
features and labels locate in
[0, 1]
. The value 1
indicates that the feature and label are
completely related, and 0 means that they are
independent of each other.
▪ After calculating the correlation, feature ranking
is performed. Higher the correlation, more
information content it has. It will determine
which features in given feature vectors are
useful for classification label. The features with
the greatest correlation are at the forefront, and
the features with the least correlation are at the
last. Thus, the greatest correlation or strongly
useful features have high ranking.
3.1.2 Feature Reduction
In this section, we use the random forests to reduce
the sorted features. The goal of feature reduction is to
choose as few as features and obtain higher intrusion
detection accuracy. Here, we regard the accuracy as a
feature fitness. The random forest algorithm is
abbreviated as RF. The detailed feature reduction
process are as follows. Suppose
p
is the dimension
of the sample.
▪ Step1. The training dataset are adjusted
according to the sorted feature
S
obtained in
section 3.1.1 to form a new training dataset
0S
.
Then calculate
ACC
of
0S
,
0S
ACC
.
▪ Step2. Feature Reduction
Remove the last one feature in
0S
, and form a
new dataset
1S
, use RF to compute
ACC
of
1S
,
1S
ACC
. If
10SS
ACC ACC
, then retain
1S
, otherwise retain
0S
and abort. Remove the last
one feature in
1S
, and form a new training
dataset
2S
, use RF to compute
ACC
of
2S
,
2S
ACC
. If
21SS
ACC ACC
, then retain
2S
,
otherwise retain
1S
and abort. Follow this
process until we find the feature sequence with
highest ACC. For feature sequence
()St
and a
new feature sequence
( 1)St+
with the last
feature removed, if
( 1) ( )S t S t
ACC ACC
+
, we
retain
()St
and abort.
▪ Step3. Output the training dataset
()St
and its
features with dimension
pt−
.
An Effective RF-based Intrusion Detection Algorithm with Feature Reduction and Transformation
223

3.2 Transformation with Logarithm
Marginal Density Ratios
Suppose the train dataset includes
n
samples,
denoted by
{( , ), 1,2, , }
ii
M Y i n==X
, where
pt
i
R
−
X
is a
pt−
-dimensional feature vector, and
{0,1}
i
Y
is the corresponding binary response. The
data transformation includes the following steps.
▪ Step1. Dataset selection
A subset
1
M
is randomly chosen from
M
. Let
(1) (1)
1
( , )MY= X
, and let be the number of
samples in
1
M
,
1
nn
.
▪ Step2. Category conditional density
Similar with the method in [32], the kernel
density estimation is applied to
1
M
to obtain the
classification conditional density
g
and
f
. For
each sample,
g
and
f
can be denoted b
12
ˆ ˆ ˆ ˆ
( , , , )
T
pt
g g g g
−
=
and
12
ˆ ˆ ˆ ˆ
( , , , )
T
pt
f f f f
−
=
respectively, where
pt−
represents dimensions of the feature
dimension after reduction. Let
1
M
+
be the
samples with category label 1, and
1
M
−
be the
samples with category label 0, that is
1 (1) (1)
1
{ 1, 1,2, , }
ii
M X Y i n
+
= = =
,
1 (1) (1)
1
{ 0, 1,2, , }
ii
M X Y i n
−
= = =
, which
satisfy
11
MM
+−
=
,
1 1 (1)
M M X
+−
=
.
The density estimation function
ˆ
()
j
f
is based
on samples
1
1 1 1
12
{ , , , }
n
M M M
+
+ + +
and
ˆ
()
j
g
is
based on samples
1
1 1 1
12
{ , , , }
n
M M M
−
− − −
, where
1
n
+
and
1
n
−
are the number of samples in
1
M
+
and
1
M
−
, and
1 1 1
n n n
+−
+=
. The density
estimation function can be expressed as:
1
1
1
1
1
ˆ
()
n
ij
j
i
Xx
gK
h
nh
−
−
−
=
−
=
(8)
+
1
1+
+
1
1
1
ˆ
()
n
ij
j
i
Xx
fK
h
nh
=
−
=
(9)
where
1,2, ,j p t=−
,
h
is the bandwidth
and
()K
is a kernel function.
▪ Step3. Data transformation
The density estimation function
ˆ
()
j
f
and
ˆ
()
j
g
are applied to the dataset
(1)
X
and
(2)
X
. Let
(1)
X
and
(2)
X
be the transformation of
(1)
X
and
(2)
X
, we have
(2) (2) (2)
ˆ
ˆ
log ( ) log ( )
i i i
X f X g X
=−
(10)
(1) (1) (1)
ˆ
ˆ
log ( ) log ( )
i i i
X f X g X
=−
(11)
where
( ) ( ) ( )
ˆ
ˆ
log ( ) log ( )
=−
v v v
ij j ij j ij
X f X g X
,
1, 2=v
and
(1) (2)
X X X
=
. Finally, the
transformed data can be written as
( , )M X Y
=
.
3.3 Intrusion Detection Model based on
Random Rorest
After transformation, the new transformed data
2
M
is used to train RF classifier to establish the intrusion
detection model. The framework of FR-FRA
intrusion detection system consists of three steps:
Data reduction and augmentation, building detection
model and test model.
▪ Step1: Data reduction and augmentation
The correlation analysis and logarithm marginal
density ratios are used to the original data to
generate the new and high-quality data.
▪ Step2: Detection model
Apply the new transformed data from step1 to
train RF classifier and obtain the intrusion
detection model.
▪ Step3: Test model
New testing samples are brought into the
intrusion detection model established in step 2 to
test the performance of the model.
4 EXPERIMENTS
4.1 Experimental Setup
The dataset used in the paper is based on the NSL-
KDD dataset, which is a modified version of the KDD
Cup 99 (Tavallaee, 2009) dataset.
The empirical experiments in our work were all
implemented on a computer with an Intel Core i7-
7700 CPU @ 3.60GHz with 16.0 GB RAM running
Windows 10. The feature reduction, transformation
and RF classifier test were run using Python.
The 10-fold cross validation method was applied
to train and test the proposed classifier. In this
method, the dataset is divided into 10 un-duplicated
ICEIS 2019 - 21st International Conference on Enterprise Information Systems
224

subsets, and any nine of ten are used for training and
the remaining one for testing. Thus, after running 10
times, each subset of the initial dataset has an equal
opportunity to be selected as a training or testing.
Thus, the RF classifier will be trained and tested 10
times. Finally, the performance of intrusion detection
is evaluated by the average of 10-fold cross
validation.
4.2 Experimental Results
In this work, we consider the rates of detection, false
alarms and accuracy and area under curve (AUC),
where the rates of detection, false alarms and
accuracy are widely applied in related work to
indicate the performance of intrusion detection
model. They can be calculated by:
TP
Detection Rate
TP FP
=
+
(12)
FP
False Alarm
FP TN
=
+
(13)
TP TN
Accuracy
TP TN FP FN
+
=
+++
(14)
In this paper, we use RF algorithm to perform
feature reduction and classification. In order to
illustrate the effectiveness of our method, we apply
RF and SVM to feature reduction and classification
respectively. That is, four situations are discussed in
this section: 1) Using RF to perform feature reduction
and classification; 2) Using SVM to perform feature
reduction and classification; 3) Using RF to perform
feature reduction and SVM to classification; 4) Using
SVM to perform feature reduction and RF to
classification. The experimental results are shown in
Table 1-4.
In Table 1, the RF is applied to perform feature
reduction and classification. The values of AUC,
ACC, DR and FAR under different feature conditions
are illustrated. 41 dimensions represent the initial 41-
dimensional features, 41 dimensions with
transformation means that the initial 41-dimensional
features are transformed according to the logarithm
marginal density ratios, 27 dimensions represent the
reduced original features, 27 dimensions with
transformation indicates that the initial 27-
dimensional features are transformed according to the
logarithm marginal density ratios. From the Table 1,
we can get a conclusion that when the feature is
reduced to 27 dimensions and the feature
transformation is performed, the values of AUC,
ACC, DR and FAR are optimal. Here the 27-
dimensional subset consists of feature as <4, 3, 6, 27,
35, 26, 23, 34, 33, 5, 38, 24, 39, 29, 36, 12, 37, 24, 32,
2, 40, 31, 41, 27, 28, 1, 10>.
In Table 2, the SVM is applied to perform feature
reduction and classification. 41 dimensions represent
the initial 41-dimensional features, 41 dimensions
with transformation means that the initial 41-
dimensional features are transformed according to the
logarithm marginal density ratios, 28 dimensions
represent the reduced original features, 28 dimensions
with transformation indicates that the initial 28-
dimensional features are transformed according to the
logarithm marginal density ratios. From the Table 2,
we can get a conclusion that using SVM algorithm to
reduce and transform feature are less effective. In
contrast, the values of AUC, ACC, DR and FAR are
optimal with initial 41-dimensional features.
In Table 3, the RF is applied to perform feature
reduction, and the SVM is used to classify. 41
dimensions represent the initial 41-dimensional
features, 41 dimensions with transformation means
that the initial 41-dimensional features are
transformed according to the logarithm marginal
density ratios, 27 dimensions represent the reduced
original features, 27 dimensions with transformation
Table 1: Performances of feature reduction and classification using RF.
Feature form
AUC(%)
Accuracy (%)
DR (%)
FAR (%)
27 dimensions
99.17
99.19
98.97
0.6
27 dimensions with transformation
99.51
99.52
99.41
0.37
41 dimensions
99.15
99.16
98.89
0.59
41 dimensions with transformation
99.48
98.48
99.32
0.37
Table 2: Performances of feature reduction and classification using SVM.
Feature form
AUC(%)
Accuracy
(%)
DR (%)
FAR (%)
28 dimensions
95.63
95.72
93.31
1.86
28 dimensions with transformation
95.21
95.26
93.85
3.44
41 dimensions
97.28
97.39
95.72
1.16
41 dimensions with transformation
95.28
95.33
94.11
3.55
An Effective RF-based Intrusion Detection Algorithm with Feature Reduction and Transformation
225
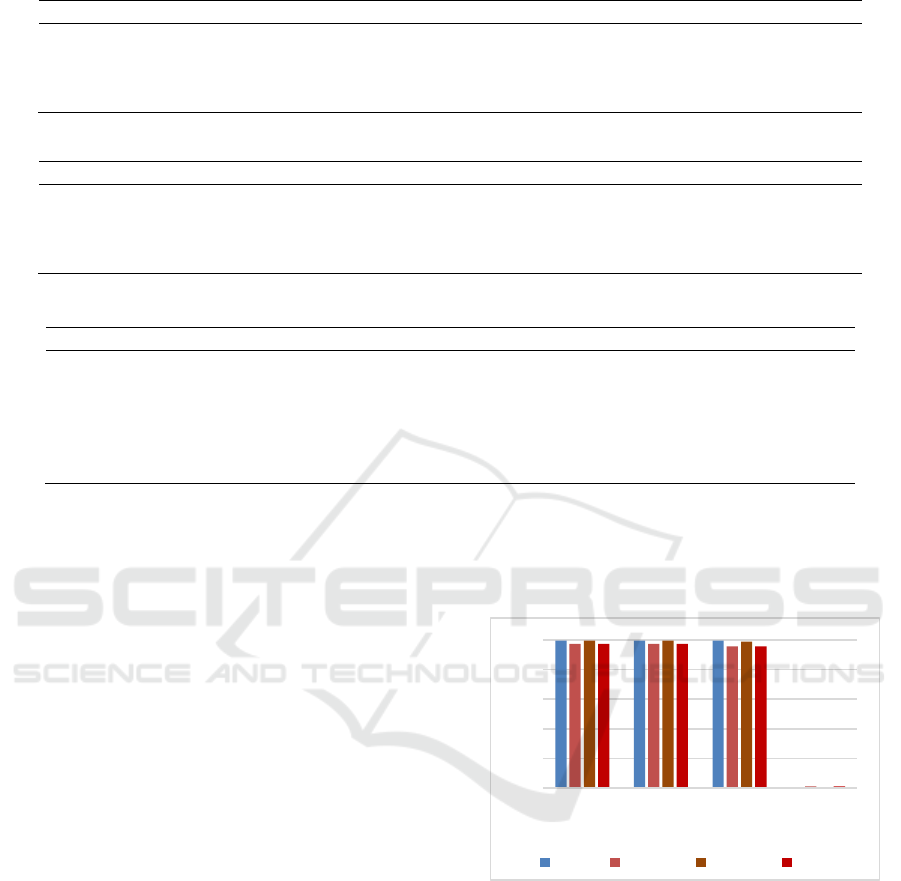
Table 3: Performances of feature reduction and classification using RF and SVM.
Feature form
AUC(%)
Accuracy (%)
DR (%)
FAR (%)
28 dimensions
95.64
95.71
93.62
2.33
28 dimensions with transformation
95.21
95.26
93.85
3.44
41 dimensions
97.28
97.39
95.72
1.16
41 dimensions with transformation
95.28
95.33
94.11
3.55
Table 4: Performances of feature reduction and classification using SVM and RF.
Feature form
AUC(%)
Accuracy (%)
DR (%)
FAR (%)
28 dimensions
98.98
98.99
98.68
0.72
28 dimensions with transformation
99.51
99.52
99.40
0.37
41 dimensions
99.15
99.16
98.89
0.59
41 dimensions with transformation
99.48
99.48
99.32
0.37
Table 5: Performance comparison of intrusion detection models with NSL-KDD dataset.
Literature
Method
Accuracy (%)
DR (%)
FAR (%)
Our method
FR-FRA
99.52
99.41
0.37
Wang et al. [32]
LMDRT-SVM
99.31
99.20
0.6
LMDRT-SVM2
99.28
99.16
0.61
Bamakan et al. [4]
TVCPSO-SVM
98.30
97.05
0.87
Singh et al. [40]
OS-ELM
98.66
98.26
0.99
Bamakan et al. [4]
TVCPSO-MCLP
97.44
97.26
2.42
indicates that the initial 27-dimensional features are
transformed according to the logarithm marginal
density ratios. The results in Table 3 show that using
RF to reduce feature and SVM to transform feature
are less effective. Consistent with the results in Table
2, the values of AUC, ACC, DR and FAR are optimal
with initial 41-dimensional features.
In Table 4, the SVM is applied to perform feature
reduction, and the RF is used to classify. 41
dimensions represent the initial 41-dimensional
features, 41 dimensions with transformation means
that the initial 41-dimensional features are
transformed according to the logarithm marginal
density ratios, 28 dimensions represent the reduced
original features, 28 dimensions with transformation
indicates that the initial 28-dimensional features are
transformed according to the logarithm marginal
density ratios. The results in Table 4 show that the
feature is reduced to 27 dimensions and the feature
transformation is performed, the values of AUC,
ACC, DR and FAR are optimal. However, the DR is
99.40% which is lower 0.01% than that in Table 1.
Figure 1 expresses the comparison of the best
performance in the four cases. Obviously, the values
of AUC, ACC, DR and FAR of the proposed method
(RF+RF) are optimal.
We illustrate advantages of our method compare
to other related schemes. Table 5 and Figure 2 show
the performance of different intrusion with NSL-
KDD dataset. The results illustrate that our method
provides the highest accuracy rate of 99.52%, the
highest detection rate of 99.41%, and the lowest false
alarm rate of 0.37%. The comparison results show
that the proposed FR-FRA is superior to other
intrusion detection scheme in detection performance.
Figure 1: The comparison of the best performance in the
four cases: RF+RF, RF+SVM, SVM+RF and SVM+SVM.
Table 6 shows the results obtained by comparing the
run time of four cases: 1) the RF is used to perform
classification and feature reduction; 2) the SVM is
used to perform classification and the RF is applied
to feature reduction; 3) the RF is used to perform
classification and the SVM is applied to feature
reduction with 28-dimensional feature; 4) the SVM is
applied to perform classification and feature
reduction with 28-dimensional feature. In this table,
the feature dimension by using RF reduction is 27
dimensions, the SVM reduction is 28 dimensions.
0
0,2
0,4
0,6
0,8
1
AUC ACC DR FAR
RF+RF RF+SVM SVM+RF SVM+SVM
ICEIS 2019 - 21st International Conference on Enterprise Information Systems
226
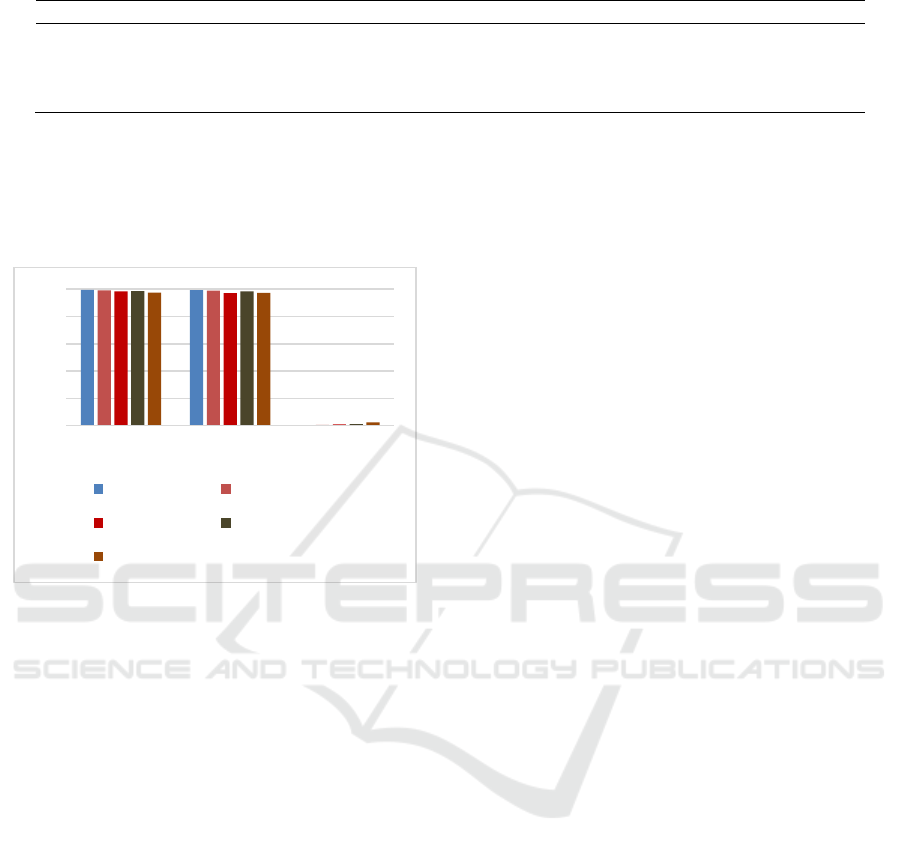
Table 6: Run time of four cases.
Feature form
Feature Reduction
Training and testing
Total
RF+RF
9min(0.15h)
14min(0.23h)
22min(0.37h)
RF+SVM
9min(0.15h)
1043min(17.4h)
1060min(17.6h)
SVM+RF
1560min(26h)
48min(0.80h)
1610min(26.8h)
SVM+SVM
1570min(26h)
1067min(17.8h)
2770min(46h)
From Table 6, we can see that using RF to perform
feature reduction and classification operations has an
absolute advantage in time.
Figure 2: Performance comparison of different intrusion
detection models with NSL-KDD dataset.
5 CONCLUSIONS
This paper proposes a feature reduction and
transformation scheme that combines RF algorithm
and logarithm marginal density ratios (LMDR) for
efficient intrusion detection, which reduces the
original 41-dimensional feature to a 28-dimensional
and then transforms the 28-dimensional feature.
These new transformed samples are used to train and
test the proposed RF classification model.
The experimental results illustrate that our
proposed detection method can obtain an outstanding
performance with a high DR, a high ACC, a low FAR,
a high AUC and a rapid reduction and training speed.
When compared with newly related works, the
proposed scheme presents strong advantages in above
aspects. However, we only considered the two-
classification problem. In fact, multi-classification
problems are also widely used in intrusion detection.
Therefore, we will consider applying the proposed
method to multi-classification problems.
ACKNOWLEDGEMENTS
The authors would like to thank the editorial board
and reviewers. This work was supported by the
Construction Project of Network Security System
(XXH13507); (XDC02000000).
REFERENCES
Luo B., Xia J., 2014. A novel intrusion detection system
based on feature generation with visualization strategy,
Expert Syst. Appl. 41 (9) 4139-4147.
Tjhai G. C., Furnell S. M., Papadaki M., Clarke N. L., 2010.
A preliminary two-stage alarm correlation and filtering
system using som neural network and k-means
algorithm, Comput. Security 29 (6) 712-723.
Buczak A. L., Guven E., 2016. A survey of data mining and
machine learning methods for cyber security intrusion
detection. IEEE Commun Surv Tut, 18 (2): 1153-1176.
Al-Jarrah O. Y., Alhussein O., Yoo P. D., Muhaidat S.,
Taha K., Kim K., 2016. Data randomization and
cluster-based partitioning for botnet intrusion detection.
IEEE Trans Cybern, 46 (8): 1796-1806.
Zheng W., Fu X., Ying Y., 2014. Spectroscopy-based food
classification with extreme learning machine.
Chemometr Intell Lab Syst, 139: 42-47.
Wang G., Hao J., Ma J., Huang L., 2010. A new approach
to intrusion detection using artificial neural networks
and fuzzy clustering, Expert Syst. Appl. 37 (9) 6225–
6232.
Eesa A. S., Orman Z., A. Brifcani M. A., 2015. A novel
feature-selection approach based on the cuttlefish
optimization algorithm for intrusion detection systems,
Expert Syst. Appl. 42 (5) 2670–2679.
Bamakan S. M. H., Wang H., Tian Y., Shi Y., 2016. An
effective intrusion detection framework based on
mclp/svm optimized by time-varying chaos particle
swarm optimization, Neurocomputing, 199, 90–102.
Feng W., Zhang Q., Hu G., Huang J.X., 2014. Mining
network data for intrusion detection through combining
svms with ant colony networks, Future Generation
Comput. Syst. 37 (7) 127–140.
Mohammed M. N., Sulaiman N., 2012. Intrusion detection
system based on svm for wlan, Procedia Technol. 1 (10)
313–317.
De La Hoz E., Ortiz A., Ortega J., Martnez-lvarez A., 2014.
Feature selection by multi-objective optimisation:
0
0,2
0,4
0,6
0,8
1
ACC DR FAR
Our method Wang et al.
Bamakan et al. Singh et al.
Bamakan et al.
An Effective RF-based Intrusion Detection Algorithm with Feature Reduction and Transformation
227

application to network anomaly detection by
hierarchical self-organising maps, Knowl. Based Syst.
71, 322–338.
Koc L., Mazzuchi T. A., Sarkani S., 2012. A network
intrusion detection system based on a hidden naive
bayes multiclass classifier, Expert Syst. Appl. 39 (18),
13492–13500.
Louvieris P., Clewley N., Liu X., 2013. Effects-based
feature identification for network intrusion detection,
Neurocomputing 121 (18), 265–273.
Mukherjee S., Sharma N., 2012. Intrusion detection using
naive bayes classifier with feature reduction, Procedia
Technol. 4 (11), 119–128.
Liao Y., Vemuri V.R., 2002. Use of k-nearest neighbor
classifier for intrusion detection, Comput. Security 21
(5), 439–448.
Li Y., Xia J., Zhang S., Yan J., Ai X., Dai K., 2012. An
efficient intrusion detection system based on support
vector machines and gradually feature removal method,
Expert Syst. Appl. 39 (1), 424–430.
Fu S., Liu J. G., and Pannu H., 2012. A Hybrid anomaly
detection framework in cloud computing using one-
class and two-class support vector machines, In 8 th
International Conference, Advanced Data Mining and
Applications, pp. 726-738.
Manzoor Akashdeep I. and Kumar N., 2017. A feature
reduced intrusion detection system using ANN
classifier, Expert Systems with Applications, 88, 249-
257.
Farnaaz N. and Jabbar M. A., 2016. Random Forest
Modeling for Network Intrusion Detection System,
Procedia Computer Science 89, 213-217.
Sangkatsanee P., Wattanapongsakorn N., and
Charnsripinyo C., 2011. Practical real time intrusion
detection using machine learning approach. Journal of
Computer Communication, 34, 2227–2235.
Liu Q., Sui S., and Xiao J., 2014. A mutual information
based hybrid feature selection method using feature
clustering. In IEEE 38th annual international
conference on computers, software and application, pp.
27–32.
Al-Jarrah O. Y., Siddiqui A., Elsalamouny M., Yoo P. D.,
Muhaidat S., and Kim K., 2014. Machine learning
based feature selection techniques for large scale
intrusion detection. In 2014 IEEE 34th International
Conference on Distributed Computing Systems
Workshops, pp. 177–181.
Kuang F., Xu W., Zhang S., 2014. A novel hybrid kpca and
svm with ga model for intrusion detection, Appl. Soft.
Comput. 18 (4), 178–184.
Lin W.-C., Ke S.-W., Tsai C.-F., 2015. Cann: an intrusion
detection system based on combining cluster centers
and nearest neighbors, Knowl. Based Syst. 78 (1), 13–
21.
Horng S. J., Su M. Y., Chen Y.H., Kao T. W., Chen R.J.,
Lai J. L., Perkasa C.D., 2011. A novel intrusion
detection system based on hierarchical clustering and
support vector machines, Expert Syst. Appl. 38 (1),
306–313.
Wang H. W., Gu J., and Wang S. S., 2017. An effective
intrusion detection framework based on SVM with
feature augmentation, Knowledge-Based System, 136,
130-139.
Zhou Z. H., 2016. Machine Learning, Tsinghua University
Press. China, 1
nd
edition.
Tavallaee M., Bagheri E., Lu W., Ghorbani A. A., 2009. A
detailed analysis of the kdd cup 99 data set, In
Proceedings of the Second IEEE Symposium on
Computational Intelligence for Security and Defense
Applications.
Bhattacharya S., Selvakumar S., 2015. LAWRA: a layered
wrapper feature selection approach for network attack
detection, Security Commun Netw 8 (18), 3459–3468.
De La Hoz E., De La Hoz E., Ortiz A., Ortega J., Prieto B.,
2015. PCA filtering and probabilistic som for network
intrusion detection, Neurocomputing 164, 71–81.
Kim G., Lee S., Kim S., 2014. A novel hybrid intrusion
detection method integrating anomaly detection with
misuse detection, Expert Syst. Appl. 41 (4), 1690–
1700.
ICEIS 2019 - 21st International Conference on Enterprise Information Systems
228
