
Automated Bicycle Counting System’s Prototype to Evaluate the
Necessity of New Bicycle Lanes in Jelgava City
Armands Kviesis, Aleksejs Zacepins, Vitalijs Komasilovs, Normunds Vetra and Nikolajs Bumanis
Department of Computer Systems, Faculty of Information Technologies,
Latvia University of Life Sciences and Technologies, Jelgava, Latvia
Keywords:
Automatic Bicycle Counting, Pressure Sensor, Pneumatic Tubes, Open Source Technologies.
Abstract:
Every year the number of vehicles on the road is increasing. But there are people that start to choose public
transport or greener transportation options like bicycles or electric cars over typical fuel cars. Regarding
bicycle usage, the problems that arise are related to insufficient bicycle lanes and determination of future
lane locations, so that the resources used for bicycle lane construction would be properly invested. To resolve
mentioned problems municipality first need to learn where the suitable bicycle lane location for cyclists should
be. Such a task can be done by applying a cyclist counting system. This paper describes a portable automatic
cyclist counting system’s prototype for bicycle lane location planning and also identifies the limitations for
such a system. Proposed prototype is based on rubber tubes and pressure sensors, Wi-Fi module and open
source electronic platform Arduino. This study is carried out within the ERANet-LAC project RETRACT
(Enabling resilient urban transportation systems in smart cities).
1 INTRODUCTION
Urban air pollution is one of the environmental risks
in modern cities (Elsom, 2014). There are several
factors affecting urban air, like population growth, in-
dustrial expansion, urbanisation and increase in motor
vehicle usage (Bickerstaff and Walker, 2001). Reduc-
tion of vehicle emissions is a major component of sus-
tainable transportation development (Kitthamkesorn
and Chen, 2017).
Many governments promote usage of green trans-
port, like bicycles for citizen daily transportation
(Goodwill, 2015; Kitthamkesorn and Chen, 2017).
Municipalities are investing funds (for instance Dan-
ish capital Copenhagen invested 150 million USD in
cycling infrastructure) to develop new separate bike
lanes or even bridges or trying to improve existing in-
frastructure and adapt it also for bicycle needs (Bao
et al., 2017). Bike along with walking is the greenest
mode of transportation (https://greenseat.nl/en/how-
to-travel-green/). Many municipalities are changing
their development strategies and define new mobility
principles in cities, where mobility priority focuses on
pedestrians, cyclists and public transport not on pri-
vate car drivers. Traditional ways of planning bike
lanes in a city rely mainly on empirical experience or
citizen surveys (Sustrans, 2014; Hyodo et al., 2000;
Rybarczyk and Wu, 2010). With the growth of smart-
phone and smart GPS applications, more data-driven
approaches on planning bike lanes emerged (Evans
et al., 2012; Evans et al., 2013; Jiang et al., 2016; Bao
et al., 2017).
New bike lane planning requires the municipality
to have some data about the number of bicycles on a
specific road/walkway. It is highly important to in-
vest in right directions, because building of 1 km bike
road costs approximately 145000 EUR, but each de-
veloped bike road increase the bikers count for 20%
and decrease car number for 10%, according to the
data by the Latvian Cycling Association (www.rdsd.
lv/uploads/media/551901879d5eb.ppt). As stated by
(Weigand et al., 2013) it is not trivial to precisely de-
termine the cost of integrating a bike lane into existing
infrastructure. This is also proved by several sources
as the costs are closely related to project design and
other specifics, for example, as it was estimated by
City of Portland, the cost for a bike lane per foot (ap-
prox. 0.30 m) is approximately 3 USD; the cost can
be in a range from 5000 USD to 535000 USD (with
average of 130000 USD) per mile (approx. 1.6 km)
for about 1.5 m wide bike lane (Bushell et al., 2013)
or even much higher, like the 12 USD million-a-mile
bike lanes (Alexander, 2018).
There are many methods and systems (piezoelec-
420
Kviesis, A., Zacepins, A., Komasilovs, V., Vetra, N. and Bumanis, N.
Automated Bicycle Counting System’s Prototype to Evaluate the Necessity of New Bicycle Lanes in Jelgava City.
DOI: 10.5220/0007714104200425
In Proceedings of the 5th International Conference on Vehicle Technology and Intelligent Transport Systems (VEHITS 2019), pages 420-425
ISBN: 978-989-758-374-2
Copyright
c
2019 by SCITEPRESS – Science and Technology Publications, Lda. All rights reserved
tric strips, radio beams, active infrared, pneumatic
tubes etc. (Ryus et al., 2014)) available for bike
counting. Over the last decade, there has been in-
creasing interest in counting bicycles and establishing
non-motorized counting programs (Nordback et al.,
2016). Three types of commercially available pneu-
matic tube counters (dual and single tube configu-
ration - bicycle-specific, classification and volume
counters) were studied by (Nordback et al., 2016),
where counting accuracy decreased with high traffic
volume and longer tubes. The undercounting problem
is also highlighted by (Ryus et al., 2014) where two
products were compared. Counting can be done man-
ually or in automated way. Automated counting make
it possible to collect data for long time period and to
monitor temporal data variety in volumes more effec-
tively than manual counts (Proulx et al., 2016). Auto-
mated counting can be done using different technolo-
gies, like infrared, radio beam, pneumatic tubes, in-
ductive loops and also image processing (Zangeneh-
pour et al., 2015; Komasilovs et al., 2018). As well
publicly showing the number of bikes going on the
specific roads or comparing speed of bike and car on
the specific part of the road can increase individual
motivation to use the bike next time.
By the data of Latvian Central Sta-
tistical Bureau, 17% of Latvian citizens
almost twice per week are using bikes
(https://www.csb.gov.lv/lv/statistika/statistikas-
temas/socialie-procesi/veseliba/meklet-tema/2141-
17-latvijas-iedzivotaju-vismaz-divreiz-nedela), in
capital Riga number of cyclist’s increases approx. by
10% each year. In Latvia bike counting is mainly
done manually by persons standing at the bike lanes
and counting the bicycles, but this approach has
many disadvantages (https://www.diena.lv/raksts/
latvija/zinas/ritenbrauceju-skaita-izmainas-fikse-ar-
masinredzi -un-maksligo-intelektu-14110736). It is
not possible to collect data on the long time period,
to compare data on different weather conditions and
day periods, as well it require more staff time per
hour of data collected. Therefore, local municipality
is searching for better ways on how to collect data
on the number of bikes using specific roads with
the purpose to build bike lanes on the most popular
roads/sidewalks.
Pneumatic or rubber tubes are commonly used for
gathering short-duration motor-vehicle number (http:
//www.windmill.co.uk/vehicle-sensing.html), but it is
possible to adapt this technology also for bicycle
counting. Equipment for this task consists of two
main elements: rubber tubes to place on the road sur-
face and a data recording and processing unit. As ob-
ject (vehicle or bicycle) pass over the tubes, pulses
of air travel through the tubes to the data recorder,
which detects them due to change in the pressure.
Authors of this research propose a prototype based
on a popular open-source electronic platform Arduino
(https://www.arduino.cc/) for bicycle counting. Main
advantage of such approach could be the price of the
whole system, which gives benefit for local munici-
pality.
2 MATERIALS AND METHODS
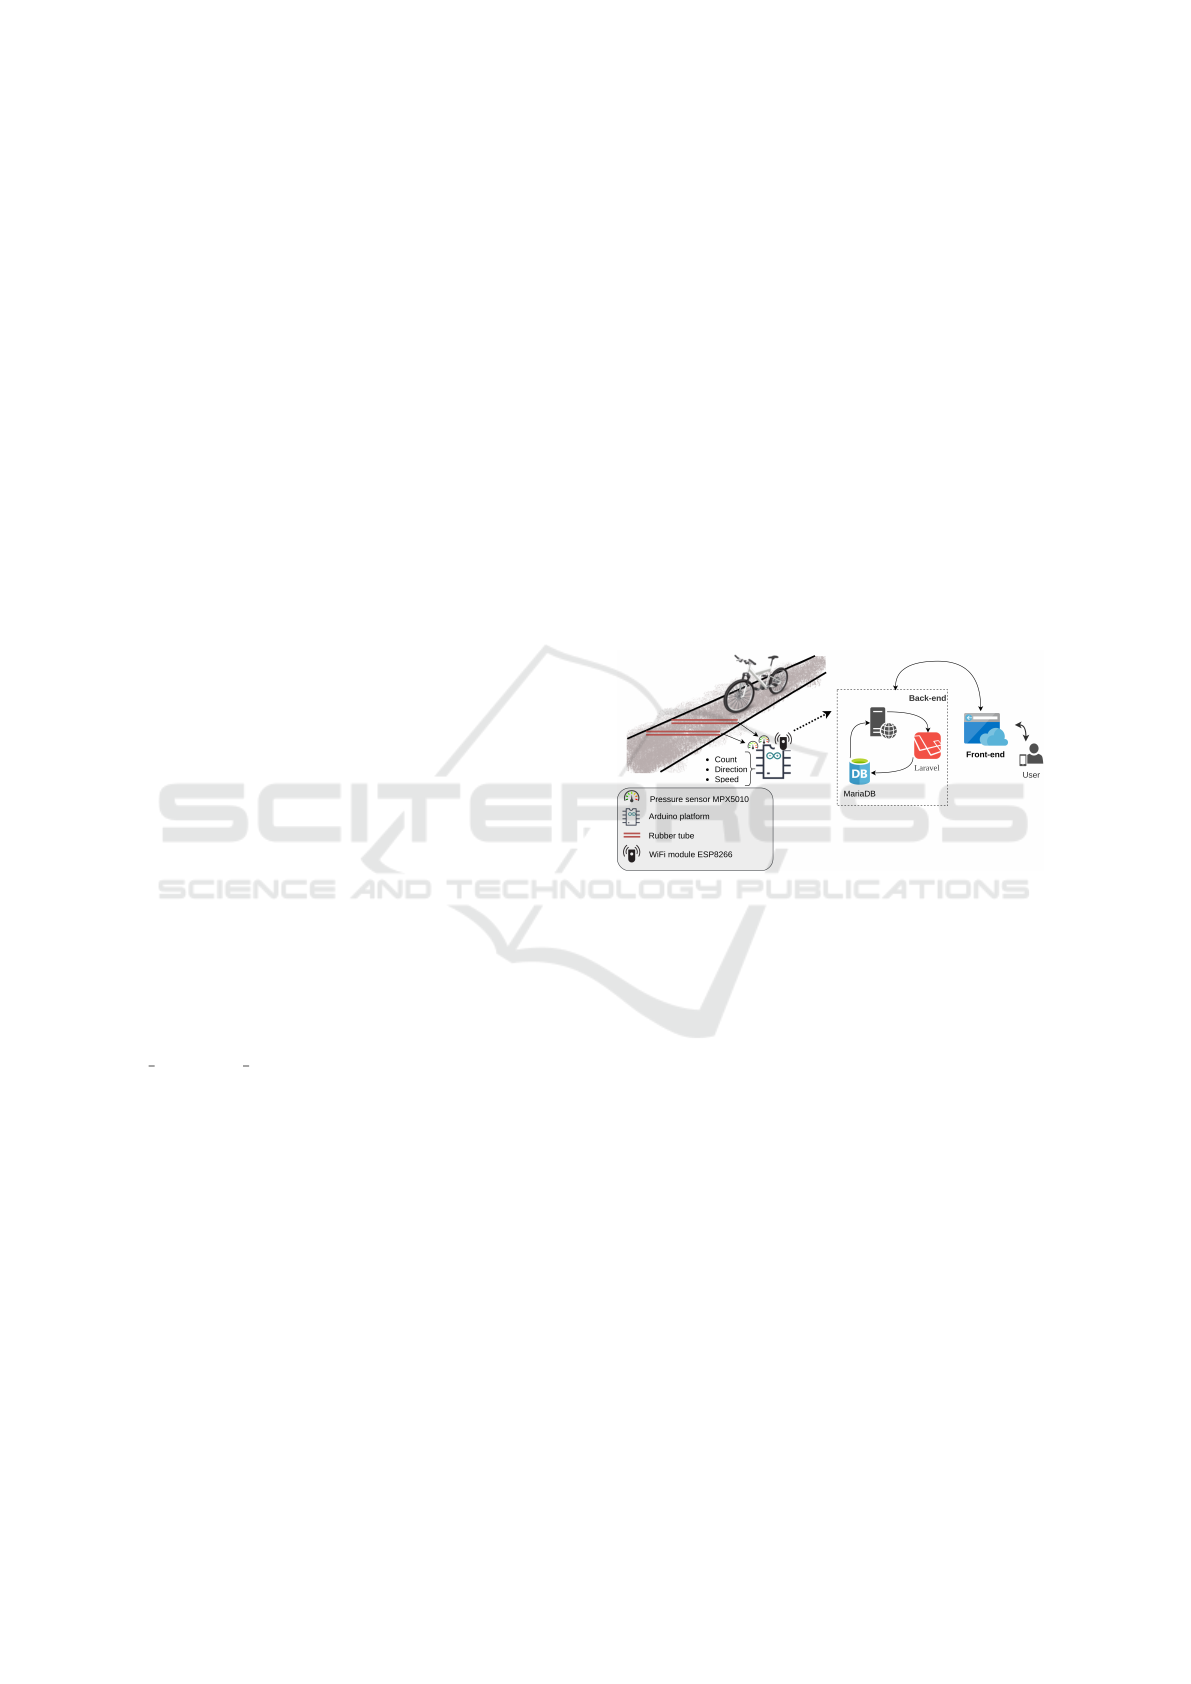
Proposed automatic bicycle counting system’s archi-
tecture (see Fig. 1) consists of two pressure sensors
MPX5010DP with rubber tubes, electronics develop-
ment platform Arduino Uno, ESP8266 Wi-Fi module,
remote server with Laravel Framework and MariaDB
in the back end, and HTML, CSS, Javascript, Boot-
strap forming the front end.
Figure 1: Architecture of bicycle counting system’s proto-
type.
Arduino platform acts as a data collector and
at the same time is capable of calculating bicycle
speed, direction and count at the given time. Men-
tioned pressure sensor is a piezo resistive trans-
ducer that outputs analogue signal proportional to
the pressure applied (https://www.nxp.com/docs/en/
data-sheet/MPX5010.pdf). The data collection part is
similar as posted in https://hackaday.io/project/4567-
traffic-counter-road-tube. For testing purposes, a Wi-
Fi technology for wireless data transfer was used. In
remote locations, the Wi-Fi can still be used, when,
for example, a mobile phone is turned into a portable
hotspot and sharing cellular data plan. Other solu-
tion would be to choose a GPRS module. Since
Arduino Uno board itself lacks Wi-Fi functionality,
data were transferred to the remote server by us-
ing a Wi-Fi module (in this case Adafruit HUZZAH
ESP8266), which is connected to the Arduino via Uni-
versal Asynchronous Receiver-Transmitter (UART).
After a certain period of time (defined in the soft-
ware), Arduino communicates with ESP8266 module
and sends the necessary data (direction, count, speed).
Automated Bicycle Counting System’s Prototype to Evaluate the Necessity of New Bicycle Lanes in Jelgava City
421
The Wi-Fi module then prepares HTTP message and
executes POST request to the remote server (example
is shown below).
POST /api/data HTTP/1.1
Host: example.host.com:port
Content-Type: application/json
{
"count":5,
"direction":1,
"speed":12
}
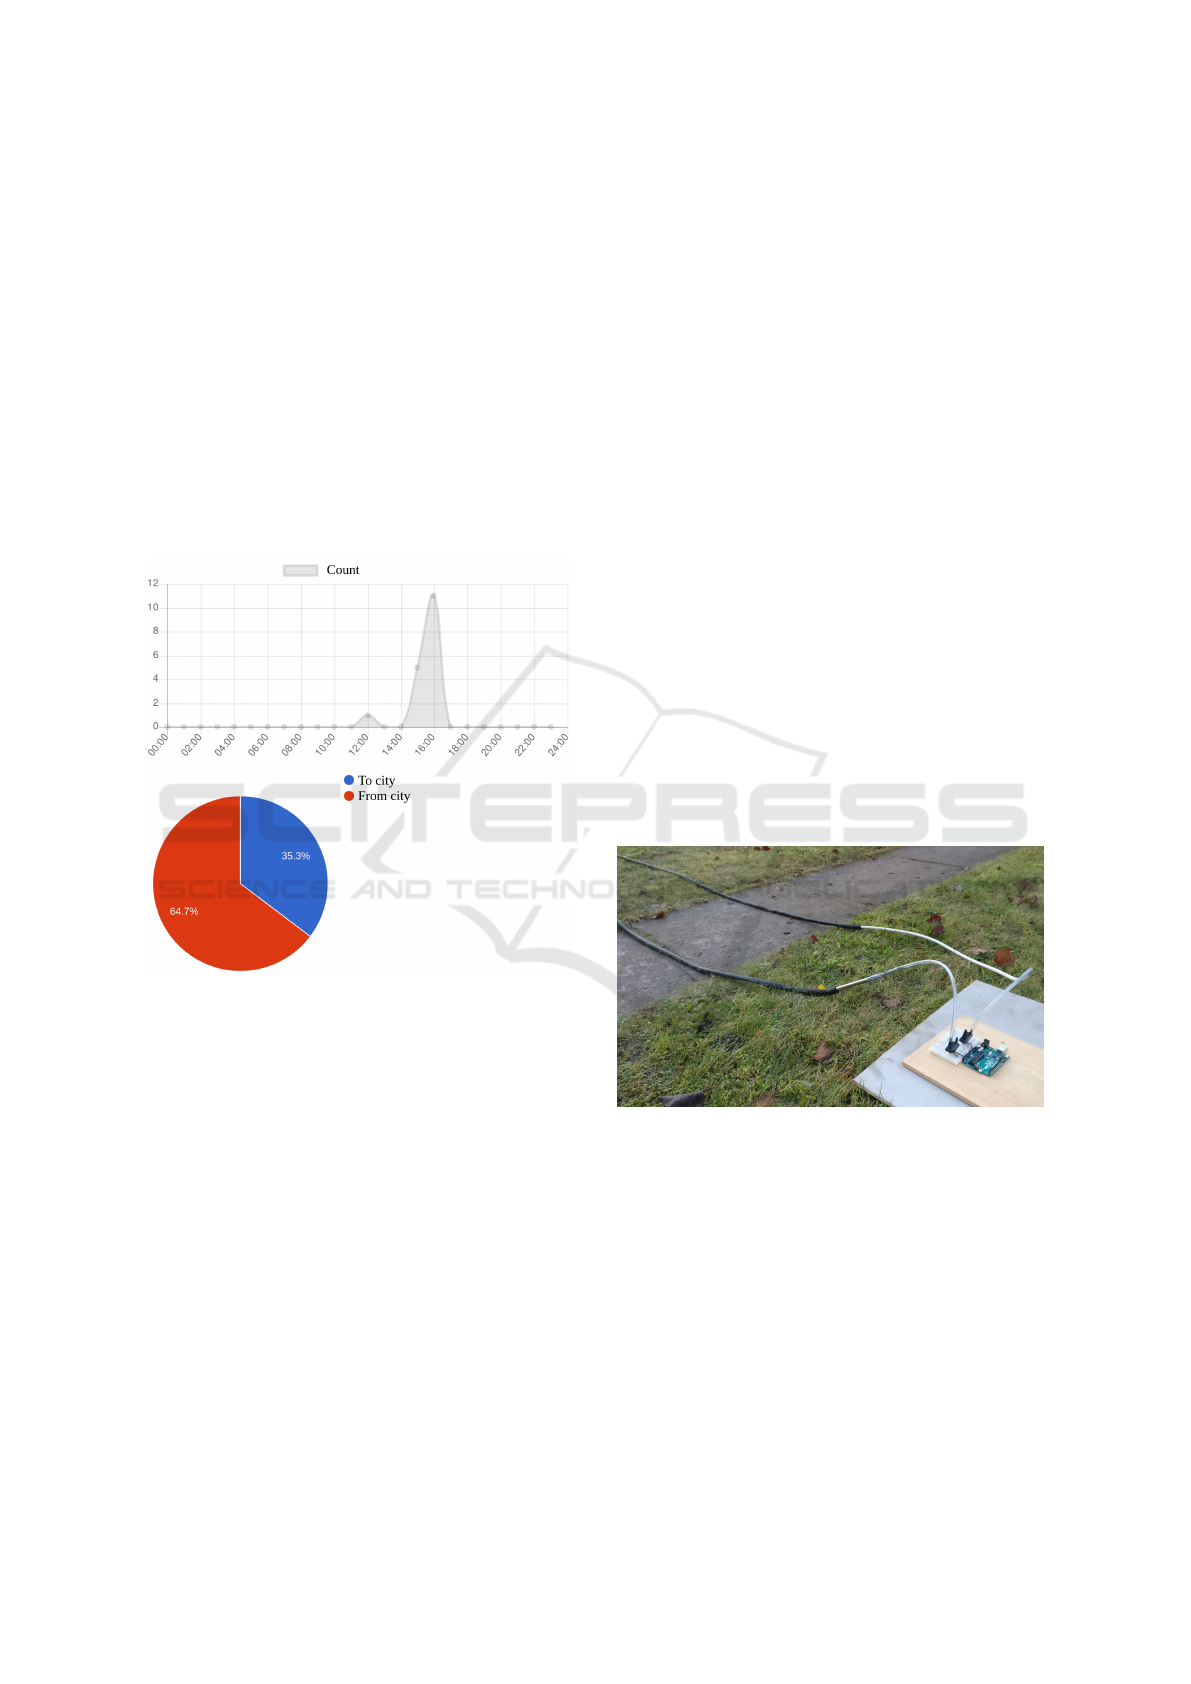
Remote server processes the incoming requests
and inserts data into the database. The front end can
provide user with information about cyclist directions
during selected day and cyclist count by hours as well
(see Fig. 2).
Figure 2: Bicycle count chart representation.
The MPX5010DP pressure sensor can measure up
to 10 kPa pressure with a response time of 1 ms and
in combination with rubber tubes is suitable for the
task. Tests were performed to determine the pres-
sure applied to the sensor tubes by bicycle. As it
was found, pressure did not exceed 2 kPa (as mea-
sured and calculated by Arduino using the given trans-
fer function (1) (https://www.nxp.com/docs/en/data-
sheet/MPX5010.pdf):
V
out
= V
s
∗(0.09P+0.04)±(P
error
∗T
f
∗0.09V
s
) (1)
where:
V
out
– output voltage from sensor, V;
V
s
– supply voltage (5.0 V ± 0.25 Vdc), V;
P – pressure, kPa;
P
error
– pressure error, kPa;
T
f
– temperature factor,
◦
C;
As it was concluded, such values fall within the
sensor minimum and maximum range and the pres-
sure applied by bicycle is enough to detect changes.
However, precise pressure values (in kPa) are not
very important, since this sensor application mostly
requires the detection of pressure being applied (in
other words: True or False). The analogue value of
the sensor is required in terms of calibration - it helps
to adjust the threshold when the tube is pressed.
Two sets of tubes (different material and diam-
eter) were used for testing, those were of material
polyurethane/rubber (further in text ”Tube 1”) and
rubber (”Tube 2”). The length of the tubes were 3
m (Tube 1) and 2 m (Tube 2); outer diameter 6 mm
(Tube 1) and 10 mm (Tube 2); thickness 1.2 mm
(Tube 1) and 2mm (Tube 2).
In order to set up the counting system for proper
operation, it was critical to place the tubes so that the
distance between them is constant. This distance is
hard-coded in the system for precise speed (if needed)
calculations. During testing, tubes were placed on a
concrete surface, since in Jelgava city we mostly have
walkways of such material. Setup of the system is
shown in Fig. 3. As it can be seen in the figure, the Ar-
duino is not in an enclosed box, since the testing phase
was aimed to test the working principle and identify
the limitations. The cost of the tested prototype was
approximately 100 EUR.
Figure 3: Counting system’s setup for testing.
3 RESULTS AND DISCUSSION
As mentioned previously, two different rubber tubes
were selected to attach to pressure sensors. Tube se-
lection is very important, since they are made of dif-
ferent materials. Material choice adds extra factors
that can have impact on system’s correct operation
and thus needs to be taken into account. Factors, such
as size and flexibility of the tubes, can be mentioned.
The smaller and harder are the tubes, the less pressure
can the bicycle tire apply to them. Another factor is
VEHITS 2019 - 5th International Conference on Vehicle Technology and Intelligent Transport Systems
422

temperature, that has impact on pressure, as this is de-
fined by Gay-Lussac’s law (Pressure Law). In colder
environment, pressure decreases (if the volume and
mass is constant). Results section is divided in two
subsections - tests with both material tubes.
3.1 Tests with Tube 1
At the beginning the system was tested by simply
rolling over a bicycle, to see how the air pressure
changes. In this field test with Tube 1 (made of
polyurethane) it was concluded that pressure values
changed minimally or not even at all. Tempera-
ture also affected the tubes – the material became
much harder and the pressure decreased. As this was
observed by bringing the tubes from warmer room
(23
◦
C) to the outside environment (5
◦
C). It was con-
cluded that in this test case bicycle tire did not have
any effect on the tube, thus no changes in sensor read-
ings were noticed. Therefore it was impossible to use
such tubes for reliable system operation.
3.2 Tests with Tube 2
Single Rubber Tube (bicycle count only)
If information about bicycle speed and direction is
not important, then a single sensor with one tube is
enough. During field tests all single bicycle riding
cases were counted correctly, but some specific situ-
ations, conditions where recognized, that causes in-
terruptions of the systems operation. Thus following
limitations were identified:
• only count can be determined. Single tube limits
the operation of the system regarding the details
that can be obtained from data. It is not possible
to detect direction the cyclist is driving from and
speed as well. Although it is possible to know the
time that takes both tires to cross the tube, it is
not enough to calculate the speed, as the distances
between tires vary almost with each bicycle;
• simultaneous crossing of multiple cyclists. Sys-
tem counts cyclists with error when several bicy-
cles are crossing the tube simultaneously. Sensor
reading in such situation will reach the threshold,
but in order to distinguish the difference between
one or two cyclists it would mean to hard-code
sensor values. And as tests showed, there are no
distinguishable differences when two cyclists are
crossing the tube simultaneously, because when
the tube is pressed by one cyclist, the other cy-
clists pressure does not show any impact on the
sensors value.
Two Rubber Tubes (direction, count, speed)
In order to detect also speed, two rubber tubes were
placed on a concrete surface with distance of 50 cm
between them. Since bicycles are in various lengths
(also the reason why speed can not be detected when
using only one sensor), such a distance should ensure,
that both tires are not on the sensor tubes simultane-
ously (in this scenario the system will fail to count
such case). Total of 50 bicycle riding tests were car-
ried out. Tests included driving with various speeds –
from 6 to 20 km/h. Speed was calculated within the
Arduino by formula (2):
v =
s
t
(2)
where:
v – speed, m/s;
s – distance between rubber tubes, m;
t – time it took for the first tire to cross both
tubes, s.
All 50 testing cases with single cyclist riding over
the tubes were successfully identified and counted.
During testing phase the following limitations were
identified:
• threshold adjustments. As it was observed, in
colder weather the pressure decreased after longer
periods of time. It was detected by the analogue
values received by the pressure sensors. This has
an impact on defined threshold – if the pressure
decreases dramatically the threshold could never
be reached, thus cyclists can not be detected;
• pedestrian factor. Since described system is in-
tended to be placed on pedestrian walkway that
also is used by cyclists, pedestrians can intervene
by stepping on tube(-s). There are possible solu-
tions to filter these cases out. If pedestrian only
steps on one tube leaving the other untouched, the
system should check time till the other tube is ac-
tivated. If the time exceeds some defined limit,
this case should be ignored;
• cyclist behavior. There may be cases when cy-
clists behave differently when they see tubes on
the road/walkway. They could try to avoid cross-
ing them or drive them over with one tire. But
these also could only be some rare, specific cases
(enthusiasts of ”extreme” bike riding).
The system was also tested when multiple cyclists en-
tered the scene. It was observed that system does not
operate reliably in such situations: only about 40% of
50 testing cases (riding from the same and opposite
direction) were correctly recognized as two cyclists.
Such poor performance was due to the fact, that ana-
log sensor is being used and detection is highly de-
pendent on a threshold. As a result, if the sensor’s
Automated Bicycle Counting System’s Prototype to Evaluate the Necessity of New Bicycle Lanes in Jelgava City
423
value is being read frequently, e. g., each 10 ms, then
one cyclist’s applied pressure that is greater than the
threshold, could be counted as multiple cyclists, be-
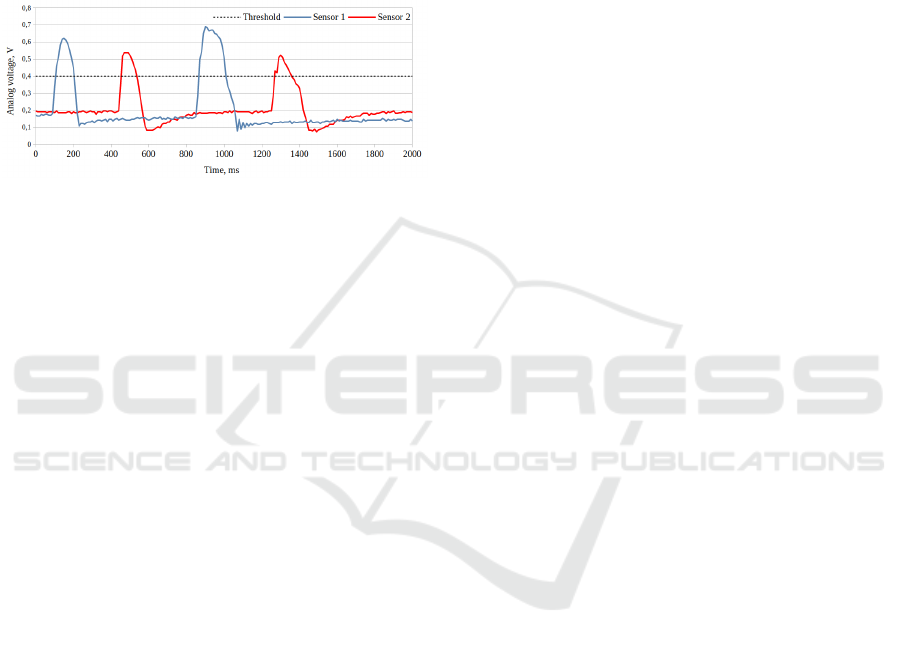
cause the value does not stabilize so fast. Sensor val-
ues, after a single bicycle has driven over the tubes,
is illustrated in Fig. 4. In a single cyclist case, this
can be resolved by ignoring the specific sensor values
after the threshold is reached, and continue to read
the sensor value after the second sensor threshold has
been reached.
Figure 4: Sensor responses after bicycle impact.
As the figure (Fig. 4) shows, the sensor is in active
state (threshold is reached) approximately 100 ms or
even more, meaning that to ensure correct systems op-
eration, next value should be read after 100 ms. But
this is not a reliable solution, as in some cases the
value is more than 100 ms above threshold. Also ad-
justing the threshold (increasing its value) is not the
best solution either, as each sensor registers different
values (see Fig. 4).
4 CONCLUSIONS
During this study a bicycle counting system’s proto-
type based on pressure sensors and rubber tubes was
developed and tested, showing promising results (all
bicycle riding cases were counted correctly in a sin-
gle cyclist’s case). Although there are several limita-
tions and cases that causes the system to work poorly.
More than one cyclist counting simultaneously could
be highlighted as the main limitation.
Using digital signal sensors (for example, piezo-
electric swithces) instead of analogue (pressure sen-
sor in our case) should perform better, as there are no
thresholds involved which needs to be adjusted.
Additional tests should be performed on different
type (structure, hardness) of walkway surfaces (for
example, gravel), because there is a possibility, that
on softer surfaces the rubber tubes could be pressed
inside the surface.
Described prototype during testing phase included
Wi-Fi module for data transmission, but usually the
walkways are not close to any internet access points.
Thus, the module can be replaced by a suitable
GPRS module to access mobile internet, for exam-
ple, SIM900. Other cases may include SD card mod-
ule and closed range data transfer technologies, to
store collected data locally. Also the use of an low-
power wide-area network (LPWAN) can be consid-
ered for data transfer, for example, implementation
of LoRaWAN. Although it could be somewhat com-
plex task if the LoRa network should be built from
scratch. Different scenario - if the city already has
a developed LoRaWAN network. Then it is possible
to collaborate with the according telecommunication
company. Jelgava city is one of the cities in Latvia
that has a LoRaWAN network (built by telecommu-
nication company Lattelecom Group) and a collabo-
ration with Lattelecom has already been successful as
described in (Zacepins et al., 2018).
In order to improve (resolve some of the limita-
tions) some additional sensors could be considered to
add to the system, for example, ultrasonic sensors in
order to distinguish patterns between pedestrians and
cyclists or to identify cyclist riding direction in a sin-
gle tube case.
ACKNOWLEDGEMENTS
Scientific research, publication, and presentation are
supported by the ERANet-LAC Project ”Enabling re-
silient urban transportation systems in smart cities”
(RETRACT, ELAC2015/T10-0761).
REFERENCES
Alexander, G. (2018). Are bike lanes worth the
cost? https://earth911.com/business-policy/are-bike-
lanes-worth-the-cost/. Accessed: 2018-11-01.
Bao, J., He, T., Ruan, S., Li, Y., and Zheng, Y. (2017). Plan-
ning bike lanes based on sharing-bikes’ trajectories. In
Proceedings of the 23rd ACM SIGKDD international
conference on knowledge discovery and data mining,
pages 1377–1386. ACM.
Bickerstaff, K. and Walker, G. (2001). Public understand-
ings of air pollution: the ‘localisation’of environmen-
tal risk. Global Environmental Change, 11(2):133–
145.
Bushell, M. A., Poole, B. W., Zegeer, C. V., and Rodriguez,
D. A. (2013). Costs for pedestrian and bicyclist infras-
tructure improvements. University of North Carolina
Highway Safety Research Center, University of North
Carolina, Chapel Hill, 45.
Elsom, D. (2014). Smog alert: managing urban air quality.
Routledge.
Evans, M. R., Oliver, D., Shekhar, S., and Harvey, F. (2012).
Summarizing trajectories into k-primary corridors: a
VEHITS 2019 - 5th International Conference on Vehicle Technology and Intelligent Transport Systems
424

summary of results. In Proceedings of the 20th Inter-
national Conference on Advances in Geographic In-
formation Systems, pages 454–457. ACM.
Evans, M. R., Oliver, D., Shekhar, S., and Harvey, F. (2013).
Fast and exact network trajectory similarity computa-
tion: a case-study on bicycle corridor planning. In
Proceedings of the 2nd ACM SIGKDD international
workshop on urban computing, page 9. ACM.
Goodwill, R. (2015). Transport minister encourages
people to get on their bike for cycle to work day.
https://www.gov.uk/government/news/transport-
minister-encourages-people-to-get-on-their-bike-for-
cycle-to-work-day. Accessed: 2018-11-01.
Hyodo, T., Suzuki, N., and Takahashi, K. (2000). Mod-
eling of bicycle route and destination choice behav-
ior for bicycle road network plan. Transportation
Research Record: Journal of the Transportation Re-
search Board, (1705):70–76.
Jiang, Z., Evans, M., Oliver, D., and Shekhar, S. (2016).
Identifying k primary corridors from urban bicycle
gps trajectories on a road network. Information Sys-
tems, 57:142–159.
Kitthamkesorn, S. and Chen, A. (2017). Alternate weibit-
based model for assessing green transport systems
with combined mode and route travel choices. Trans-
portation Research Part B: Methodological, 103:291–
310.
Komasilovs, V., Zacepins, A., Kviesis, A., Pe
˜
na, E., Tejada-
Estay, F., and Estevez, C. (2018). Traffic monitoring
system development in jelgava city, latvia. In VEHITS,
pages 659–665.
Nordback, K., Kothuri, S., Phillips, T., Gorecki, C., and
Figliozzi, M. (2016). Accuracy of bicycle count-
ing with pneumatic tubes in oregon. Transportation
Research Record: Journal of the Transportation Re-
search Board, (2593):8–17.
Proulx, F. R., Schneider, R. J., and Miranda-Moreno, L. F.
(2016). Performance evaluation and correction func-
tions for automated pedestrian and bicycle counting
technologies. Journal of transportation engineering,
142(3):04016002.
Rybarczyk, G. and Wu, C. (2010). Bicycle facility planning
using gis and multi-criteria decision analysis. Applied
Geography, 30(2):282–293.
Ryus, P., Ferguson, E., Laustsen, K. M., Prouix, F. R.,
Schneider, R. J., Hull, T., and Miranda-Moreno, L.
(2014). Methods and technologies for pedestrian and
bicycle volume data collection. Citeseer.
Sustrans (2014). Handbook for cycle-friendly design.
Weigand, L., McNeil, N., and Dill, J. (2013). Cost analysis
of bicycle facilities: Cases from cities in the portland,
or region.
Zacepins, A., Jelinskis, J., Kviesis, A., Dzenis, M., Ko-
masilovs, V., and Komasilova, O. (2018). Applica-
tion of lorawan technology in precision beekeeping.
In Agrosym 2018 Book of proceedings, pages 1759–
1765.
Zangenehpour, S., Romancyshyn, T., Miranda-Moreno,
L. F., and Saunier, N. (2015). Video-based automatic
counting for short-term bicycle data collection in a va-
riety of environments. Technical report.
Automated Bicycle Counting System’s Prototype to Evaluate the Necessity of New Bicycle Lanes in Jelgava City
425
