
The Importance of Considering Natural Isotopes in Improving Protein
Identification Accuracy
Sara El Jadid
1 a
, Raja Touahni
1
and Ahmed Moussa
2
1
Faculty of Science, Ibn Tofail University, Kenitra, Morocco
2
National School of Applied Science, Abdelmalek Essadi University, Tangier, Morocco
Keywords:
Proteomics, Mass Spectrometry, Peptide Identification, Quantitation, Accuracy, Natural Isotopes.
Abstract:
Many tools in proteomics are based on accurate identification of peptide contained in a sample. In fact, the
issue of identification is the foundation of the entire proteomics workflow, where all subsequent steps depend
on the quality of data generated at the beginning. The accuracy of data generated allow, not only to have good
results, but also to ensure consistency at the end of the analysis. There is a consensus about the factors that
affect this accuracy. It is popularly assumed that exploiting physics and chemistry of peptides deduced from
sequences can improve the identification accuracy. In fact, considering natural isotopes when quantifying
peptides will considerably improve results. This paper presents findings that defend such a view. We explored
the mass difference between the nominal mass (which considers the most abundant isotope of each element)
and the mean mass (which considers the abundance of each element). We noticed that within a biomolecule,
the larger the number of elements, the less this difference is negligible. In accordance with that, peptide
misidentification is due to the previously explained variance. These findings reveal that including natural
isotopes during quantification will play a key role in improving identification accuracy. This study could lead
us to design alternative identification tools combining better sensitivity and specificity.
1 INTRODUCTION
Proteins perform a large number of functions within
the organisms, including catalyzing metabolic reac-
tions,structural organization, DNA replication, trans-
porting molecules from one location to another and
integration of internal and external signals (Pratt et al.,
2002). Proteins are the primary mediators and the ex-
ecutive core of the cellular phenotype (Schmidt et al.,
2014; Aebersold and Mann, 2003). A protein con-
sists of at least one long chain of amino acid residues
(Figure 1).
Figure 1: Production of dipeptide from two amino acids. A
peptide bond was marked by a big circle.
An amino acid is made up of an amine group, a car-
boxyl group and a side chain (R group) specific to
each of 20 amino acids (Koehler et al., 2011) (Table
1).
a
https://orcid.org/0000-0001-9793-5061
The study of the whole protein set cell is known as
proteomics. This downstream ”omics” of science is
associated with different technologies which allow
the separation of proteins (Hunt et al., 1986; List-
garten and Emili, 2005). Over recent years mass spec-
trometry (MS) made tremendous progress and be-
came the most comprehensive and versatile tool for
studying proteins on a large-scale (Mann and Kelle-
her, 2008; Yates et al., 2009). Mass spectrometry al-
lows to determine with accuracy and sensitivity the
mass of molecules (e.g. biomolecules: peptides, pro-
teins, oligonucleotides, sugars, lipids, metabolites)
(Deutsch et al., 2010; Gerber et al., 2003). It is a
method for measuring the mass-to-charge ratios (m/z:
where m is the mass of compound and z its charge)
and individualizing molecules ionized by the loss or
gain of electric charges. Each atom has one or more
isotopes of different masses by definition (Chahrour
et al., 2015). Thus, the proportion of each isotope
observed on a mass spectrum, that is to say the iso-
topic mass, is characteristic of the presence of certain
atoms and their number in the measured ion (Brun
et al., 2007). The molecular weight m corresponds to
the elemental composition (chemical formula) of the
318
El Jadid, S., Touahni, R. and Moussa, A.
The Importance of Considering Natural Isotopes in Improving Protein Identification Accuracy.
DOI: 10.5220/0007691103180321
In Proceedings of the 12th International Joint Conference on Biomedical Engineering Systems and Technologies (BIOSTEC 2019), pages 318-321
ISBN: 978-989-758-353-7
Copyright
c
2019 by SCITEPRESS – Science and Technology Publications, Lda. All rights reserved

Table 1: Tables of amino acid.
Symbol Formula Monoisotopic Average
Ala A Alanine C
3
H
5
NO 71.03711 71.0788
Arg R Arginine C
6
H
12
N
4
O 156.10111 156.1876
Asn N Asparagine C
4
H
6
N
2
O
2
114.04293 114.1039
Asp D Aspartic Acid C
4
H
5
N O
3
115.02694 115.0886
Cys C Cystine C
3
H
5
N O
5
103.00919 103.1448
Gln Q Glutamine C
5
H
8
N
2
O
2
128.05858 123.1308
Glu E Glutamic Acid C
5
H
7
N O
3
129.04259 129.1155
Gly G Glycine C
2
H
3
NO 57.02146 57.0520
His H Histidine C
6
H
7
N
3
O 137.05891 137.1412
Ile I Isoleucine C
6
H
13
NO
2
113.08406 113.1595
Leu L Leucine C
6
H
13
NO
2
113.08406 113.1595
Lys K Lysine C
6
H
12
N
2
O 128.09496 128.1742
Met M Methionine C
5
H
9
NOS 131.04049 131.1986
Phe F Phenylalamine C
9
H
9
NO 147.06841 147.1766
Pro P Proline C
5
H
7
NO 97.05276 97.1167
Ser S Serine C
3
H
5
N O
2
87.03203 87.0782
Thr T Threonine C
4
H
7
N O
2
101.04768 101.1051
TrpW Tryptophan C
11
H
10
N
2
O 186.07931 186.2133
Tyr Y Tyrosine C
9
H
9
N O
2
163.06333 163.1760
Val V Valine C
5
H
9
NO 99.06841 99.1326
molecular ion (Kumar Trivedi, 2016). This ion com-
posed of atomic elements is represented by a more
or less broad distribution of different isotopes (Brun
et al., 2009). Natural isotopes provide an engaging
alternative to the accuracy of identification methods
(Daron et al., 2016). They have almost the same prop-
erties as their parental element, they only differ in the
number of neutrons, which explains the difference in
mass (Kristjansdottir et al., 2012). Regardless of the
similarity in the chemical properties, the presence of
the natural isotope promotes independent assessment
of molecules because of the mass difference. Here
we focused on how considering natural isotopes can
offer a highly precise quantification to avoid peptide
misidentification.
2 METHODS
Carbon, hydrogen, oxygen, nitrogen and sulfur are
the common atoms in amino acids (Gray et al., 1970).
They have more than one isotope in nature with dif-
ferent abundance (Table 2).
Carbon and nitrogen are the abundant atoms in
peptides with
13
C and
15
N as the predominant iso-
topes, followed by sulfur and oxygen isotopes which
are present to a lesser extent (Perras et al., 2016). Tak-
ing advantage of the isotopic information can provide
an absolute quantitation leading to an accurate pep-
tide identification and validation (Hanke et al., 2008;
Table 2: List of most used isotope.
Element Symbol Exact mass Abundance
Hydrogen
1
H 1.00783 99.99
2
H 2.01410 0.01
Carbon
12
C 12.0000 98.91
13
C 13.0034 1.09
Oxygen
16
O 15.9949 99.76
17
O 16.9991 0.04
18
O 17.9992 0.20
Nitrogen
14
N 14.0031 99.6
15
N 15.0001 0.4
Sulphur
32
S 31.9721 95.02
33
S 32.9715 0.76
34
S 33.9679 4.22
36
S 35.9670 0.02
Costas-Rodrguez et al., 2016). The idea is, instead
of representing a peptide by a single mass, peptides
need to be represented as a group of different masses
balanced to the natural abundance of the natural iso-
topes.
For an atom, carbon for example, it will be
represented by the average mass and not the exact
mass. The exact mass of a carbon atom is 12 u,
while the average mass is calculated as following:
12*0.9891+13*0.0109 = 12.0109 u. The mass dif-
ference for an atom is small, but within a biomolecule
(amino acids or peptide), more the number of atoms
is large, less this difference is insignificant.
The Importance of Considering Natural Isotopes in Improving Protein Identification Accuracy
319
For molecular ions, the situation is more complex
since it will take into account the mixed isotopes of
each element. The superscript at the upper left is used
to indicate the mass number and the subscript at the
lower right indicates the atomic number.
For the amino acid phenylalanine C
9
H
12
N0
2
:
• The lightest mass corresponds to that of the
principal most abundant isotope of each ele-
ment (monoisotopic mass) (
12
C,
1
H,
14
N,
16
O):
M
mono
= 9*12 + 12*1.007825032 + 1*14.003074
+ 2*15.9949146 = 166.0868 u
• For ions of higher mass, we can distinguish those
whose weight comes right after the first isotope:
12
C
8
13
C
1
1
H
12
14
N
16
O
2
,
12
C
9
1
H
11
2
H
1
14
N
16
O
2
,
12
C
9
1
H
12
15
N
16
O
2
,
12
C
9
1
H
12
14
N
16
O
1
17
O
1
;
• For the third isotope:
12
C
7
13
C
2
1
H
12
14
N
16
O
2
,
12
C
9
1
H
10
2
H
2
14
N
16
O
2
, ,without forgetting the
cross products:
12
C
8
13
C
2
1
H
11
2
H
1
14
N
16
O
2
The number of combinations to assemble the isotopes
of the same element must be taken into account to go
up to the total abundance. For the second isotope:
there are nine ways to assemble eight atoms of
12
C
with one atom of
13
C, twelve so as to assemble eleven
atoms of
1
H and one atom of
2
H .... Thus, we can
reconstruct step by step all the isotopes of an ion and
construct our collection of different masses for each
peptide.
3 RESULTS AND DISCUSSION
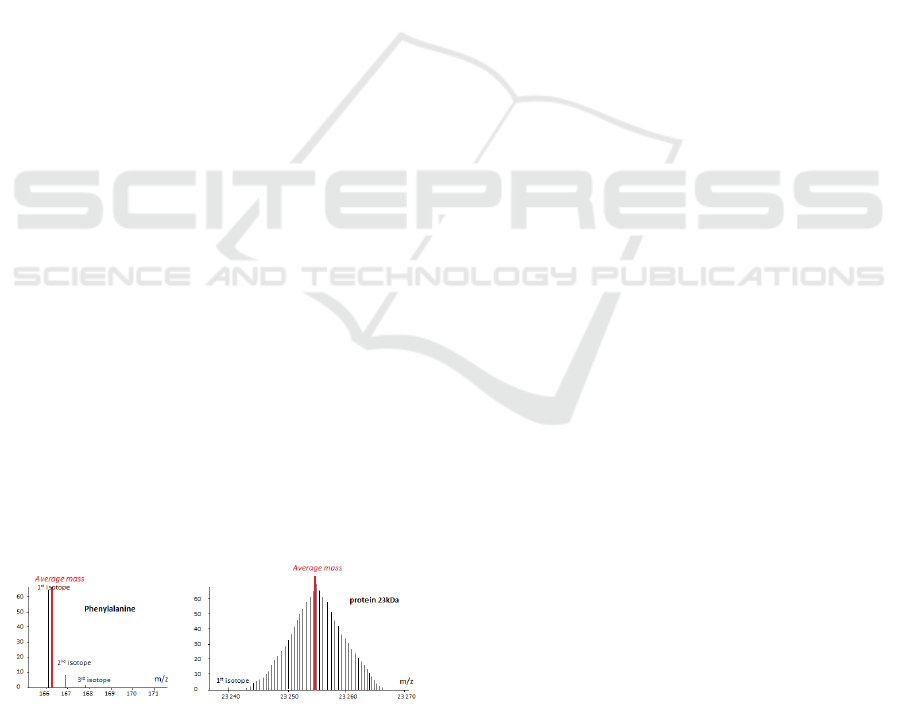
The comparison between the average mass and the
mass of the first isotope showed a low difference in
the case of small molecules, Phenylalanine for exam-
ple, but this difference increases as the number of el-
ements in the molecules increase.
For a protein molecule, with a mass 23253 u, the
gap reaches 14 u (Figure 2).
Figure 2: Variance between average mass and monoisotopic
mass for an amino acid and a protein.
The first peak of the isotopic profile, often the most
abundant for low masses, is the monoisotopic mass
that takes into account just the masses of the most sta-
ble isotopes (
12
C,
1
H,
16
O,
32
S,
14
N).
The other peaks all contain at least one heavy iso-
tope of element. In this case of peptide,
13
C which
is widely represented in biomolecules (of the order
of 1 per cent) is mainly responsible for the distribu-
tion (range 1 dalton between peaks). It will be ob-
served for the first isotope, a peptide having only
12
C;
for the second isotope, the same peptide with
13
C,
the third with two isotope
13
C... The average mass
of a biomolecules takes into account the presence of
light isotopes and heavy ones. It corresponds theo-
retically to the sum of the average weights of each of
the elements. The average mass is also the centroid
of the masses of the peaks forming the isotopic pro-
file. This mass variance creates bias in results, owing
to: misidentification; quantification of an unidentified
peptide instead of the expected one; limits the num-
ber of quantified peptides; inconsistency between the
calculated ratio and the ratio of the peptides composi-
tion.
Accurate identification requires consideration of
natural isotopes present in peptides. Using the whole
isotopic information while calculating the peptide ra-
tio is more precise than using only the monoisotopic
peak (Li et al., 2003). The isotopic collection should
be computed for each given peptide sequence.
4 CONCLUSION
MS has considerably evolved with the advent of tan-
dem mass spectrometers that allow acquisition of
huge quantities of spectra. Thereby, development
of meticulous methods for identification and valida-
tion of sequence matches will empower this technol-
ogy. Natural isotopes have turned into an adaptable
tool for mass spectrometry studies. This paper has
described the properties of natural isotopes and fo-
cused on their consideration during peptide quantifi-
cation. To achieve an optimal absolute quantitation,
each peptide to be measured requires an isotopic col-
lection, making it a laborious approach for large pro-
teomic studies. Tools providing exact matches of se-
quences exist, but we still stand in need for methods
providing valid matches for spectra with poor quality.
Strong and precise approaches to evaluate the quality
of spectra are crucial in order to decrease false posi-
tive rates and increase accuracy. Most existing tools
are accurate in the case of peptide following a normal
fragmentation, but fail for abnormal peptide. Frag-
mentation is highly dependent on physics and chem-
istry of amino acids and peptide sequences. Natural
isotopes exploitation is also valuable for peptide iden-
BIOINFORMATICS 2019 - 10th International Conference on Bioinformatics Models, Methods and Algorithms
320

tification and validation by facilitating the identifica-
tion of peptide containing mutations, posttranslational
modifications and/or abnormal fragmentation. Our
study showed that calculating peptides masses using
the whole isotopic collection is more precise than us-
ing only the monoisotopic masses. Hereby, consider-
ing natural isotope would appear to satisfy the criteria
for an optimal quantitative mass spectrometry strat-
egy leading to an accurate peptide/protein identifica-
tion.
REFERENCES
Aebersold, R. and Mann, M. (2003). Mass spectrometry-
based proteomics. Nature, 422(6928):198–207.
Brun, V., Dupuis, A., Adrait, A., Marcellin, M., Thomas,
D., Court, M., Vandenesch, F., and Garin, J. (2007).
Isotope-labeled Protein Standards: Toward Absolute
Quantitative Proteomics. Molecular & Cellular Pro-
teomics, 6(12):2139–2149.
Brun, V., Masselon, C., Garin, J., and Dupuis, A. (2009).
Isotope dilution strategies for absolute quantitative
proteomics. Journal of Proteomics, 72(5):740–749.
Chahrour, O., Cobice, D., and Malone, J. (2015). Stable
isotope labelling methods in mass spectrometry-based
quantitative proteomics. Journal of Pharmaceutical
and Biomedical Analysis, 113:2–20.
Costas-Rodrguez, M., Delanghe, J., and Vanhaecke, F.
(2016). High-precision isotopic analysis of essential
mineral elements in biomedicine: natural isotope ra-
tio variations as potential diagnostic and/or prognos-
tic markers. TrAC Trends in Analytical Chemistry,
76:182–193.
Daron, M., Blamart, D., Peral, M., and Affek, H. (2016).
Absolute isotopic abundance ratios and the accuracy
of 47 measurements. Chemical Geology, 442:83–96.
Deutsch, E. W., Mendoza, L., Shteynberg, D., Farrah, T.,
Lam, H., Tasman, N., Sun, Z., Nilsson, E., Pratt,
B., Prazen, B., Eng, J. K., Martin, D. B., Nesvizh-
skii, A. I., and Aebersold, R. (2010). A guided
tour of the Trans-Proteomic Pipeline. PROTEOMICS,
10(6):1150–1159.
Gerber, S. A., Rush, J., Stemman, O., Kirschner, M. W.,
and Gygi, S. P. (2003). Absolute quantification of
proteins and phosphoproteins from cell lysates by tan-
dem MS. Proceedings of the National Academy of
Sciences, 100(12):6940–6945.
Gray, W. R., Wojcik, L. H., and Futrell, J. H. (1970). Appli-
cation of mass spectrometry to protein chemistry. II.
Chemical ionization studies on acetylated permethy-
lated peptides. Biochemical and Biophysical Research
Communications, 41(5):1111–1119.
Hanke, S., Besir, H., Oesterhelt, D., and Mann, M. (2008).
Absolute SILAC for Accurate Quantitation of Proteins
in Complex Mixtures Down to the Attomole Level.
Journal of Proteome Research, 7(3):1118–1130.
Hunt, D. F., Yates, J. R., Shabanowitz, J., Winston, S.,
and Hauer, C. R. (1986). Protein sequencing by tan-
dem mass spectrometry. Proceedings of the National
Academy of Sciences of the United States of America,
83(17):6233–6237.
Koehler, C. J., Arntzen, M. ., Strozynski, M., Treumann,
A., and Thiede, B. (2011). Isobaric Peptide Termini
Labeling Utilizing Site-Specific N-Terminal Succiny-
lation. Analytical Chemistry, 83(12):4775–4781.
Kristjansdottir, K., Takahashi, S., L., S., and J., S. (2012).
Strategies and Challenges in Measuring Protein Abun-
dance Using Stable Isotope Labeling and Tandem
Mass Spectrometry. In Prasain, J., editor, Tandem
Mass Spectrometry - Applications and Principles. In-
Tech.
Kumar Trivedi, M. (2016). Gas Chromatography-
Mass Spectrometric Analysis of Isotopic
Abundance of <sup>13</sup>C,
<sup>2</sup>H, and
<sup>18</sup>O in Biofield Energy
Treated p-tertiary Butylphenol (PTBP). American
Journal of Chemical Engineering, 4(4):78.
Li, X.-j., Zhang, H., Ranish, J. A., and Aebersold, R.
(2003). Automated Statistical Analysis of Protein
Abundance Ratios from Data Generated by Stable-
Isotope Dilution and Tandem Mass Spectrometry. An-
alytical Chemistry, 75(23):6648–6657.
Listgarten, J. and Emili, A. (2005). Statistical and Com-
putational Methods for Comparative Proteomic Pro-
filing Using Liquid Chromatography-Tandem Mass
Spectrometry. Molecular & Cellular Proteomics,
4(4):419–434.
Mann, M. and Kelleher, N. L. (2008). Precision proteomics:
The case for high resolution and high mass accuracy.
Proceedings of the National Academy of Sciences,
105(47):18132–18138.
Perras, F. A., Chaudhary, U., Slowing, I. I., and Pruski, M.
(2016). Probing Surface Hydrogen Bonding and Dy-
namics by Natural Abundance, Multidimensional,
17
O DNP-NMR Spectroscopy. The Journal of Physical
Chemistry C, 120(21):11535–11544.
Pratt, J. M., Petty, J., Riba-Garcia, I., Robertson, D. H. L.,
Gaskell, S. J., Oliver, S. G., and Beynon, R. J. (2002).
Dynamics of protein turnover, a missing dimension in
proteomics. Molecular & cellular proteomics: MCP,
1(8):579–591.
Schmidt, A., Forne, I., and Imhof, A. (2014). Bioinformatic
analysis of proteomics data. BMC Systems Biology,
8(Suppl 2):S3.
Yates, J. R., Ruse, C. I., and Nakorchevsky, A. (2009).
Proteomics by Mass Spectrometry: Approaches, Ad-
vances, and Applications. Annual Review of Biomedi-
cal Engineering, 11(1):49–79.
The Importance of Considering Natural Isotopes in Improving Protein Identification Accuracy
321
