
A Data Traffic Reduction Approach Towards Centralized Mining in the
IoT Context
Ricardo Brand
˜
ao, Ronaldo Goldschmidt and Ricardo Choren
Instituto Militar de Engenharia, Prac¸a Gal Tib
´
urcio 80, Rio de Janeiro, Brazil
Keywords:
Data Traffic Reduction, Data Summarization, Internet of Things, Distributed Data Mining.
Abstract:
The use of Internet of Things (IoT) technology is growing each day. Its capacity to gather information about
the behaviors of things, humans, and process is grabbing researchers’ attention to the opportunity to use data
mining technologies to automatically detect these behaviors. Traditionally, data mining technologies were
designed to perform on single and centralized environments requiring a data transfer from IoT devices, which
increases data traffic. This problem becomes even more critical in an IoT context, in which the sensors or
devices generate a huge amount of data and, at the same time, have processing and storage limitations. To
deal with this problem, some researchers emphasize the IoT data mining must be distributed. Nevertheless,
this approach seems inappropriate once IoT devices have limited capacity in terms of processing and storage.
In this paper, we aim to tackle the data traffic load problem by summarization. We propose a novel approach
based on a grid-based data summarization that runs in the devices and sends the summarized data to a central
node. The proposed solution was experimented using a real dataset and obtained an expressive reduction in
the order of 99% without compromising the original dataset distribution’s shape.
1 INTRODUCTION
In 2008, there already was the idea that the connected
objects or devices could be active participants in the
business processes since they would play a fundamen-
tal role in the interaction with consumers of services
provided through the Internet (Haller et al., 2009).
The term Internet of Things (IoT) refers to a set of
technologies for accessing the data collected by vari-
ous devices through wireless and wired Internet net-
works (Gubbi et al., 2013), and it expands the scope
of the Internet, previously limited to computers (Mio-
randi et al., 2012). Currently, Iot is no longer a future
strategic initiative for many organizations: it is a real-
ity for many of them. 56% of organizations seeing it
as strategic (IDC, 2016).
The evolution of the devices, becoming smaller,
more precise and more integrated to the processes in
which they participate, has made possible each day
appear new applications for the IoT’s devices. Thus
these devices generate big data having useful, valu-
able and highly accurate data. However, it is difficult
to extract the required information or data from the
set of big data discovered by any device. Data man-
agement and analytics are critical to IoT-enabled solu-
tions: for this purpose, data mining is used (Chovatiya
et al., 2018).
Data mining techniques have traditionally been
designed and developed to run in a centralized en-
vironment. For IoT use this means that it would be
necessary to transfer huge amounts of data to a cen-
tral system. Thus there would be an ever increasing
data traffic on the network since 50 billion devices
are forecasted to be connected to the internet. Data
producers (devices) generate raw data and transfer it
to the network to be mined in the central node. How-
ever, this structure is not sufficient for IoT (Shi et al.,
2016). Data quantity at the edge is too large, which
will lead to huge unnecessary bandwidth and com-
puting resource usage. Also, most of the end nodes
in IoT are energy constrained things, and the wireless
communication module is usually very energy hun-
gry, so offloading some computing tasks to the edge
could be more energy efficient.
Given this problem, the present paper aims to pro-
pose an approach that reduces the traffic of data gen-
erated by IoT devices in order to enable the central-
ized mining of such data without compromising the
shape of dataset’s distribution. The idea is to use the
concept of edge computing. Edge computing refers to
the enabling technologies allowing computation to be
performed at the edge of the network, putting some
Brandão, R., Goldschmidt, R. and Choren, R.
A Data Traffic Reduction Approach Towards Centralized Mining in the IoT Context.
DOI: 10.5220/0007674505630570
In Proceedings of the 21st International Conference on Enterprise Information Systems (ICEIS 2019), pages 563-570
ISBN: 978-989-758-372-8
Copyright
c
2019 by SCITEPRESS – Science and Technology Publications, Lda. All rights reserved
563

of the computing at the proximity of data sources (de-
vices) (Shi et al., 2016). Since data transfer is en-
ergy hungry and data mining is heavy on processing
(burdening the device), the solution relies on consol-
idating the data before it is transmitted. The solution
divides the space in a grid so each cell of the grid is
represented by the number of points contained therein
and by its center of mass (Brandao and Goldschmidt,
2017). Each of the devices sends the representations
of cells to a central node which, in his turn, consol-
idates all the information, allowing a summary rep-
resentation of the complete dataset, since the grid’s
configuration is common to all nodes in the network.
The proposed approach was analyzed in a real
smart city scenario. Indeed, IoT has become one of
the most important types of infrastructure in smart
cities since utilizing IoT technologies in a smart city
can bring about a sustainable and pleasant living envi-
ronment for its citizens (Park et al., 2018). However,
a city populated by 1 million people will produce 180
PB data per day by 2019, contributed by public safety,
health, utility, and transports, etc (Cisco, 2014). In
the study scenario, data from 75,934 trips of 6 taxis
were collected. The results show that it was possible
to achieve a reduction in data traffic of around 99%
without changing the overall format of the distribu-
tion in the complete and centralized dataset.
This work is organized in five more sections. Sec-
tion 2 presets the basic concepts necessary to under-
stand the proposed approach. Section 3 introduces the
proposed approach to address the reduction of data
traffic, as well as the structure of the prototype used
for the execution of the experiments, whose results
are presented and evaluated in section 4. Section 5
presents some works that deal with similar problems.
Finally, Section 6 presents the conclusions and pro-
posals for future work.
2 BACKGROUND
2.1 Big Data and Data Mining
The value of data is bound to the ability to extract
knowledge from them. In this context, KDD (Knowl-
edge Discovering in Databases) appears bringing
techniques designed to address this problem. (Gold-
schmidt et al., 2015). With the ubiquitous integration
of IoT devices with processes and people, associated
with the Big Data tsunami, the KDD techniques have
emerged as an important tool to discover and analysis
of the behavior of processes and people monitored by
these devices (Chen et al., 2015).
The KDD process involves the following steps:
problem definition, which defines the data set to be
analyzed, the application domain specialist and the
application objectives; data pre-processing, which in-
cludes the functions of gathering, organization and
data processing; data mining, the main stage of the
KDD process, which the search for useful knowledge
occurs; and post-processing, which covers the treat-
ment of knowledge obtained in Data Mining, aiming
to facilitate interpretation and evaluation by the spe-
cialist.
2.2 Mining of Distributed Data
In the IoT scenario, where data is distributed, there
were two main approaches to use data mining: cen-
tralized and distributed as showed in the Figure 1.
(a) Centralized Mining (b) Distributed Mining
Figure 1: Data Mining.
In the centralized approach, each device gathers
the raw data in a single environment, submit to the
mining process generating a representative model of
the mined data, as seen in Figure 1a. The main advan-
tage of this approach is the use of mature data mining
technologies that could deal with all data in the same
location.
Distributed Mining is often used in situations
where it is not convenient to move data across the net-
work, like weakly coupled systems, systems with se-
curity and privacy issues (Goldschmidt et al., 2015).
Each device gathers the data, runs the mining algo-
rithms and generate individual models, sending them
to the central node that processes the received mod-
els integrating then and generates a global model
(Januzaj et al., 2004).
There is an important trade-off regarding mining
the data generated by the IoT: either the centralized
mining approach is chosen, which uses traditional and
more mature techniques, but faces the challenge of
increasing data traffic; or distributed mining that, de-
spite the possibility of reducing traffic, is hampered
by the limited resources of the devices, whether com-
putational or storage, to perform mining operations.
A solution to be proposed to deal with this trade-
off is the use of the centralized approach, running data
reduction on the devices before sending to the central-
ized module. Vertical reduction techniques either re-
ICEIS 2019 - 21st International Conference on Enterprise Information Systems
564
quire the active participation of the specialist or high
computational power (Goldschmidt et al., 2015). The
horizontal reduction techniques, besides have a lower
computational cost, preserve the data schemas. In the
context of IoT, which the devices have a low power of
processing and storage, the horizontal reduction tech-
niques rise as the most adequate.
3 PROPOSAL
With IoT, there would be a huge number of data gen-
erators in the network, but most of the devices would
only periodically report sensed data to the network.
Based on this observation, we understand that data
could be preprocessed at the device level. Processed
data will be sent to the network for future mining tasks
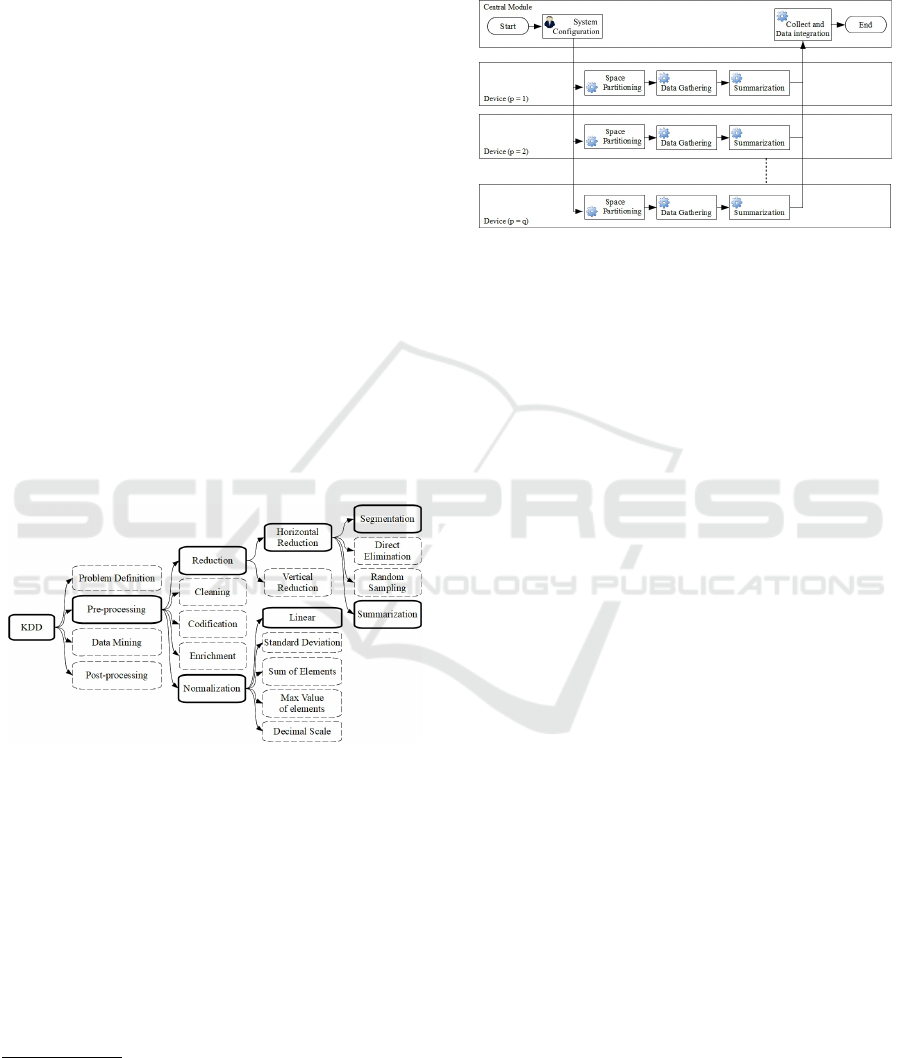
execution. Thus, in the general structure of a KDD
process depicted in Figure 2 with techniques used in
the proposed approach are highlighted by solid lines.
The solution acts at the pre-processing stage using
summarization to reduce the amount of data and seg-
mentation grouping sets of data that belongs to the
same context. Normalization will be used to avoid
comparing numbers with a wide variety of ranges.
Figure 2: KDD Process.
The approach proposed in this paper presupposes
the existence of q devices connected to a central node
and running the same application. Where all the de-
vices have a dataset with the same schema
1
.
This approach has a multi-step process illustrated
in Figure 3. Some of the processes occur in the cen-
tral module and others in the devices. Additionally,
the following observable variables represent the data
gathered by each of the devices, where:
• V = {v
1
,v
2
,...,v
n
} is the complete dataset.
1
The schema or structure of a dataset corresponds to the
ordered set of attributes that the dataset contains. In the pro-
posed approach, there is the assumption that this structure
is common to the datasets of all devices in the IoT network.
• d is an n-dimensional vector which the variable v
i
represents each dimension.
• p = 1,...,q are the devices used to gather data.
Figure 3: Complete Process.
The proposed process further considers that there
is a domain specialist and/or a data analyst responsi-
ble for define segmentation rules and settings (Gold-
schmidt et al., 2015). The approach works as follows:
in each device, the segmentation rules are applied and
then summarize the data partitioning the space in a
grid of cells, where each cell becomes represented by
the number of points contained therein and by its cen-
ter of mass (Brandao and Goldschmidt, 2017). In the
sequence, the devices sent to the central node only the
summarized information of cells with the number of
points. Because the grid configuration is common to
all nodes in the network, it is possible to summarize
the complete dataset in the central node.
The following sections describe in detail the steps
in this approach.
3.1 System Configuration
Not all variables will be used in the mining process, in
addition, segments can be created in order to separate
gathered data according to business rules defined by
the specialist. This procedure aims to group variables
and segments that are part of the same context. Thus,
in this step, the first task is to define V
M
and V
S
, sets
of variables to be used in mining and segmentation
respectively, where:
V
M
= {v
m
1
,v
m
2
,...,v
m
z
} | V
M
6= ∅,V
M
( V
V
S
= {v
s
1
,v
s
2
,...,v
s
w
} | V
S
6= ∅,V
S
( V
V
M
∩V
S
= ∅
Next, r segments are defined by the specialist,
where each segment x is formed by a description and
a filter as specified below:
x.description = Text to describe content of segment x.
x. f ilter = formula of predicates defined on V
S
that defines the segment x dataset.
A Data Traffic Reduction Approach Towards Centralized Mining in the IoT Context
565
Variables that will be mined can be expressed in a
variety of units, ranges or scales. to avoid comparing
numbers with a wide variety of ranges, they can be
adjusted through normalization. Thus, for each vari-
able of V
M
the specialist must choose the maximum
and minimum values to be used in the normalization
process. The recommendation is that the values be
chosen in such a way that the normalized values are
in the range 0 < α
i
< 1. However, this is not a restric-
tion to the proposed model.
3.2 Space Partitioning
Is the first step performed on each device. It creates a
grid with ε
z
cells with edge size = 1/ε, where ε is a
value defined by the specialist that divides each of the
z dimensions into intervals of equal value.
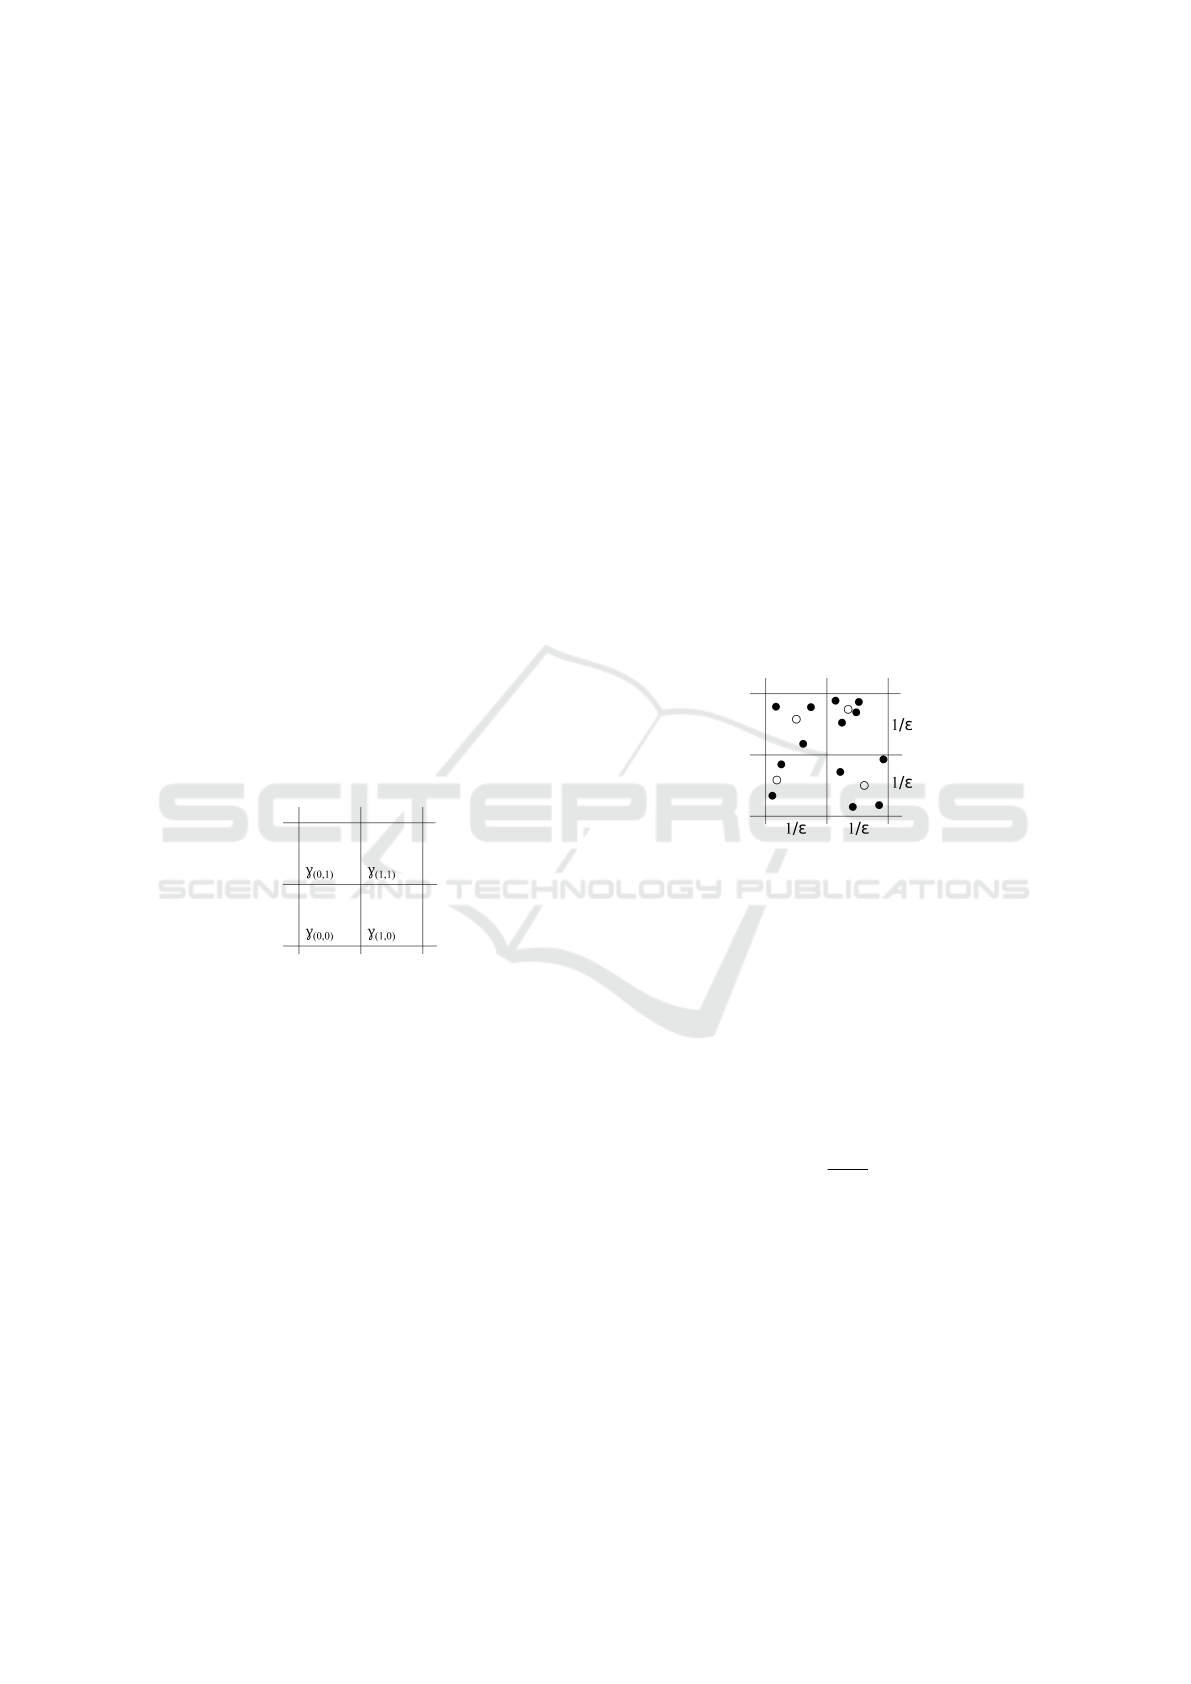
Each cell γ in the grid is referenced in hyperspace
by a z-dimensional coordinate system, as represented
below.
γ(ω
1
,ω
2
,...,ω
z
) where ω
j
∈ Z
ω
i
are indexes that refer to cells. The Figure 4 illus-
trates an example with four cells in a bi-dimensional
system.
Figure 4: Cells representation in a bi-dimensional system.
The main goals of partitioning space into a grid
of cells is to facilitate the identification of the posi-
tion of a point within the space and reduce the number
of comparisons of distance between points. This can
have advantages in future mining processes, because
it reduces its computational cost.
3.3 Data Gathering
If D is the dataset gathered by device p, for each
segment x the corresponding filter is applied in or-
der to select the records of D that represent the seg-
ment. On the result of the selection is applied the pro-
jection of the variables belonging to V
M
, generating,
thus, several tuples, each one represented by a vector
d
j
(a
1
,a
2
,...,a
z
).
Depending on the characteristics of the dataset,
the specialist can determine the need to perform a pre-
processing, such as coding tasks, data cleaning, etc.
The preprocessor routine generates new tuples, each
one represented by the vector d j(a
0
1
,a
0
2
,...,a
0
z
), which
in turn are submitted to the linear normalization that
finally generates the segment instances D(p,r) =
{δ
1
,δ
2
,...,δ
m
}, where each δ
j
(α
1
,α
2
,...,α
z
) repre-
sents a normalized vector d j(a
0
1
,a
0
2,...,a
0
z
).
3.4 Summarization
This step is where the data volume reduction occurs.
All points contained in a cell will be reduced to a sin-
gle point located in the midpoint, or center of mass.
Each vector δ is contained in a γ cell. Thus,
each cell γ will be represented by the number of z-
dimensional vectors contained therein and a vector µ
that corresponds to the center of mass of those vec-
tors. An example with four two-dimensional cells is
illustrated in Figure 5 which the filled dots represent
the data and the empty points the centers of mass of
the respective cells.
Figure 5: Grid with four cells. Filled dots are data, empty
dots are the center of mass.
The equation 1 determines the coordinates of a
cell γ which a vector δ must belong to.
ω
i
= int(α
i
× ε)where1 6 i 6 z (1)
The center of mass µ(ρ
1
,ρ
2
,...,ρ
z
) is calcu-
lated according the equation 2, where δ
i
are the z-
dimensional vectors belonging to γ and t the number
of vectors of γ.
µ =
t
∑
i=1
δ
i
t
(2)
Thus, each cell γ(ω
1
,ω
2
,...,ω
z
) is represented in
a summarized way by the structure:
γ.t = number of vectors belonging to the cellγ.
γ.µ = z-dimensional vector corresponding to the
center of mass of γ.
The algorithm 1 executes the steps 3.3 and 3.4, run
in the devices and has as input D
p
, the dataset read in
device p, the parameters for normalization and seg-
mentation, and ε. As output the set H(p, r) composed
ICEIS 2019 - 21st International Conference on Enterprise Information Systems
566

of cells γ belonging to segment x. For each record of
D
p
the algorithm checks which segment it belongs to.
If a pre-processing step has been defined, it must be
performed by the function preProcessing where the
vector d is the input and the vector d
0
output. The
vector δ, is the vector d
0
normalized. The function
calcCell identifies the coordinates of the cell to which
vector δ belongs. The last step of the algorithm is
to include the vector in the cell through the function
γ
(p,x)
.insertVector that increments the number of vec-
tors in the variable γ
(p,x)
.t and calculates the new cen-
ter of mass in the variable γ
(p,x)
.µ.
Algorithm 1: Summarization.
Input : D
p
- Collected data from p;
Normalization parameters;
ε
Output: {H
(p,x)
| p is device and x is segment}
H
(p,x)
←
/
0;
foreach element of D
p
do
x ← Segment to which the element belongs;
d ← Projection of the variables belonging to V
C
;
d
0
← preProcessing(d);
δ ←
normalization(d
0
,normalization parameters);
γ
(p,x)
= calcCell(δ);
if γ
(p,x)
/∈ H
(p,x)
then
insert γ
(p,x)
in H
(p,x)
;
end
γ
(p,x)
.insertVector(δ);
end
The complexity of the algorithm is O(n) since it
traverses the entire database without nested loops. It
should be noted, however, that if the summarization
routine can be inserted in the primary data gather-
ing process, the complexity of the algorithm becomes
O(1).
3.5 Collect and Data Integration
In this step there is a superposition of the grids of all
the devices. For each cell the new center of mass and
the number of points will be calculated.
The central module receives from each device p,
the set H
(p,x)
, and create the set H
C
x
which is com-
posed of cells γ
C
x
.
As all grids have the same configuration, a cell γ
C
x
in the central node and a cell γ
(p,x)
in the device, that
belongs on the same segment x will have the same
coordinates. Then, when the central node receives the
representation of γ
(p,x)
, γ
C
x
is updated according the
equations 3 e 4.
γ
C
x
.µ =
(γ
C
x
.µ × γ
C
x
.t) + (γ
(p,x)
.µ × γ
(p,x)
.t)
γ
C
x
.t + γ
(p,x)
.t
(3)
γ
C
x
.t = γ
C
x
.t + γ
(d,x)
.t (4)
Where γ
C
x
.µ is the center of the mass of cell γ
C
x
and γ
C
x
.t is the number of points of cell γ
C
x
4 EXPERIMENT
The experiment used a dataset with information gath-
ered from taxis of Chicago, available on Google Big
Query
2
. To facilitate the analysis and visualization,
only two attributes were used to plot the result graph-
ically. The attributes chosen were: trip duration in
seconds and distance in miles.
In a metropolis like Chicago, weekend traffic is
expected to be more fluid than on working days. Thus,
two segments were created, one with data gathered on
weekdays and the other with data from weekends.
So, in the configuration step were defined the fol-
lowing parameters:
V
S
= {weekday}.
V
M
= {Duration, Distance}
ε = 50
And segments x
0
e x
1
:
x
0
.description = weekend trips
x
0
. f ilter = weekday = Saturday or Sunday
x
1
.description = working day trips
x
1
. f ilter = weekday between Monday
and Friday
Six cabs where selected randomly. Each one has
one device to gather data. The data characteristics are
described in the Table 1.
Table 1: Sample Characteristics of dataset.
Car ID Number of records Size in Bytes
455b6b 14.209 978.090
4c8b67 11.246 764.151
5f1b23 13.688 940.907
7c51c6 10.006 690.567
b50eb9 14.097 971.251
d1b852 12.688 874.718
TOTAL 75.934 5.219.684
In the Figure 6, the original points are plotted
gathered from all devices. In the proposed approach,
only the cells containing points, with the information
2
https://goo.gl/uPtj3y
A Data Traffic Reduction Approach Towards Centralized Mining in the IoT Context
567
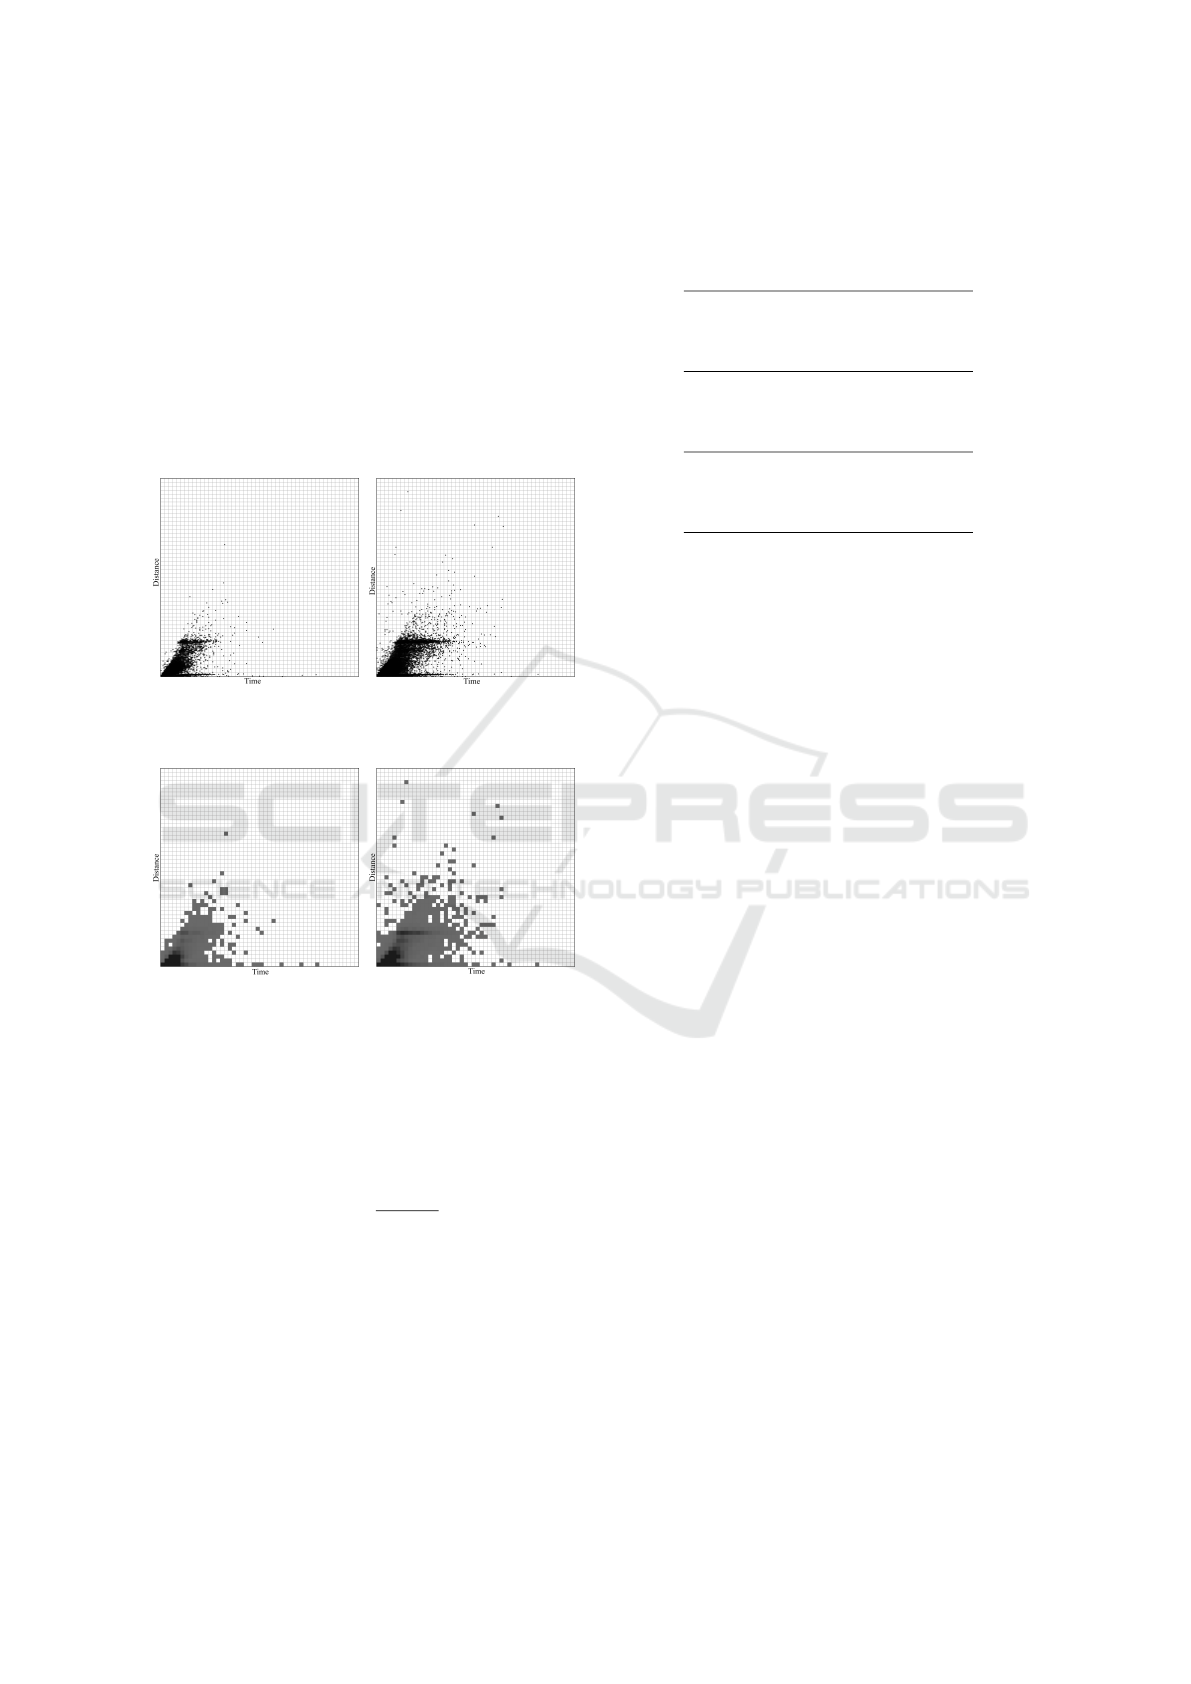
of the center of mass and the number of points, are
sent to the central node. The Figure 7 represents the
cells resulting from the process, which the cell shade
represents the number of points: the darker, more
points the cell has.
From the figures, it is possible to observe that,
in the weekends, the trips have duration time shorter
than the working days. The use of segmentation al-
lowed the separation of different contexts for the same
application, allowing a better analysis of the data gen-
erated.
(a) Weekends (b) Working Days
Figure 6: Chicago Taxis Dataset - Raw Data.
(a) Weekends (b) Working Days
Figure 7: Chicago Taxis - Summarized Data.
To evaluate the reduction rate on the data traffic
(reducRatio) the volume of summarized data were
compared with raw data, according the equation 5.
Where s
rawData
is the size of raw data and s
sumData
is the size of summarized data.
reducRatio = 1 −
s
sumData
s
rawData
× 100 (5)
To run the experiment, the raw data of each taxi
was stored separately. The algorithm 1 was executed
in each dataset and sent to another place that simu-
lates the central node. To get the final result, a pro-
gram gather all results provided by each device and
integrated using equations 3 and 4.
The results are described in the Table 2. The “Raw
Data” line indicates the total volume generated by the
devices and the “Cell” line, the volume after running
the algorithm 1. In this experiment, the algorithm runs
twice, once for each segment.
Table 2: Data Reduction - Results.
Segment: Weekend
Raw Data 1.376.312 bytes
Cells 15.623 bytes
Reduction Ratio 98,86%
Segment: Working days
Raw Data 3.843.894 bytes
Cells 29.526 bytes
Reduction Ratio 99,23%
All Data
Raw Data 5.219.684 bytes
Cells 45.149 bytes
Reduction Ratio 99,14%
The results obtained with the proposed approach
led to a significant reduction of 99.14% of the data
traffic that would be necessary if the data were all cen-
tralized. It is important to note that the reduction was
obtained by preserving the shape of data distribution
as can be seen by comparing the Figures 6 and 7.
5 RELATED WORKS
The work presented by Cantoni et al. (Cantoni et al.,
2006) present the trade-off between the need to treat
the data against the technical limitations of the sen-
sors, especially with regard to energy consumption.
Some solutions of distributed database and storage
and data summarization are proposed as a strategy to
reduce the size of transmitted data. They also make
clear the important difference between decentralized
and distributed algorithms. While in the decentralized
algorithms each node is connected to all other nodes
of the network, making the algorithm have a complex-
ity O(n
2
), in the distributed algorithms the number of
connections is equal to the number of nodes, so the
complexity of the algorithm will be O(n) or at most
O(n.log(n)).
In another approach, with the objective of dealing
with the large volume of data generated by the IoT
devices, the work presented by Bin et al. (Bin et al.,
2010) proposes four different models of data mining
for the IoT: (i) multi-layer model, (ii) distributed data
mining, (iii) data mining using grid computation, and
(iv) an integration perspective of multi technologies.
The GDCluster algorithm (Mashayekhi et al.,
2015) addresses the data traffic problem by cluster-
ing the data on each node and the propagation of its
results through randomly chosen neighbor nodes, in a
process called gossiping. Each node processes the in-
ternal data with the results received from their neigh-
ICEIS 2019 - 21st International Conference on Enterprise Information Systems
568

bors.
In another work (Bendechache and Kechadi,
2015), the authors also use clustering in order to re-
duce data traffic. The authors propose the D
2
CA, an
algorithm that uses clustering in a distributed way,
maximizing parallelism and minimizing communica-
tion. In the proposed approach the distributed nodes
execute clustering routines and create a representative
model of their clusters based on their contours.
The distributed data clustering is also used as
the basis of the work (Bendechache and Kechadi,
2015), where the authors propose the generation of
local models and the integration of them into a global
model in the central node. As a main difference,
in this work the distributed nodes receive the global
model, so that all network components have their data
in a global context.
Using summarization as a technique for reduc-
ing data traffic, the paper (Brandao and Goldschmidt,
2017) adopts a centralized mining approach. It intro-
duces the concept of space partitioning, creating cells
or hypercubes with constant size edges. The summa-
rization model also takes into account the processing
and storage limitation of the devices.
The Table 3 displays a summary of related works,
indicating whether is applied to the IoT context, cen-
tralized or distributed mining, and the approach used
to reduce data traffic. Regarding the reduction of data
traffic, the analyzed works use one of the following
approaches: integration, approach where the process
generates individual models that are sent to the central
node where they are integrated; Clustering, which in
this context indicates that mining is performed on the
distributed modules and the result of the clustering is
represented by a local model sent to the central mod-
ule; and summarization which the data are reduced
and represented in a concise manner.
Table 3: Related Works Summary.
Paper
IoT Ap-
plication
Mining
Approach
Data
Traffic
Reduction
(Cantoni et al., 2006) Yes Distributed Integration
(Bin et al., 2010) Yes Distributed n/a
∗
(Mashayekhi et al., 2015) No Distributed Clustering
(Bendechache and Kechadi, 2015) No Distributed Clustering
(Januzaj et al., 2004) No Distributed Clustering
(Brandao and Goldschmidt, 2017) Yes Centralized Summarization
This paper Yes Centralized Summarization
∗
n/a - not applicable
It is possible to observe that several papers raise
the problem of the massive generation of data by IoT
devices and its impacts on the communication sys-
tems as one of the big challenges. In their propos-
als, they present as distributed mining solutions, in
order to only send to the central node the data already
treated and in many cases summarized through repre-
sentation by local models.
In general, the approaches presented do not con-
sider the fact that the poor processing and storage ca-
pacity of IoT devices can be a deterrent to the use of
distributed clustering techniques, since the creation of
local models requires resources that in not always vi-
able in the heterogeneous devices. These works also
disregard the fact that in most of their applications the
devices have as main task the interaction with external
environment. Transferring the responsibility of data
mining to these devices may be impractical because
it can not be interrupted the main tasks while the data
mining process occupies computational resources.
6 CONCLUSION AND FUTURE
WORKS
This article presented a proposal to reduce data traffic
in the context of IoT, without burdening the process-
ing of the devices. The proposed solution is based on
partitioning the space into a grid of cells with a sum-
marized representation of the points contained in each
cell.
An experiment was performed using data gener-
ated by sensors installed in taxis that store travel in-
formation. The results obtained in the experiment
showed a significant reduction of 99.14% considering
the two segments used: weekend trips and working
day trips. This is due to the repetitive behavior of the
analyzed event, causing a single cell to have a large
number of points, thus increasing the rate of reduc-
tion.
Analyzing the results it is also possible to verify
that there is no significant loss in the dataset’s shape
when comparing with the original data (Figure 6), in-
dicating that it is possible to rebuild the dataset on
the central node, reducing data traffic without loss of
meaning for future analysis. It’s possible compare the
proposed process as a reduction of image resolution,
however, for each pixel of the new image, there is ex-
tra information: the number of original points and the
center of mass.
So, it possible to observe that the use of the pro-
posed approach reached its objective, obtaining an ex-
pressive reduction value in the data traffic with a pro-
cess with complexity O(n), that does not burden the
processing of the devices.
Possibilities for future work include: research-
ing data mining techniques in the central node, com-
pare results obtained by data mining through the ap-
proach proposed in this article with traditional tech-
niques, developing of behavior detection techniques
from the data received in the central node, and devel-
oping models to detect noises and outliers.
A Data Traffic Reduction Approach Towards Centralized Mining in the IoT Context
569

REFERENCES
Bendechache, M. and Kechadi, M. T. (2015). Distributed
clustering algorithm for spatial data mining. In Spa-
tial Data Mining and Geographical Knowledge Ser-
vices (ICSDM), 2015 2nd IEEE International Confer-
ence on, pages 60–65, Fuzhou, China. IEEE.
Bin, S., Yuan, L., and Xiaoyi, W. (2010). Research on data
mining models for the internet of things. In 2010 In-
ternational Conference on Image Analysis and Signal
Processing, pages 127–132, Zhejiang, China. IEEE.
Brandao, R. d. A. and Goldschmidt, R. R. (2017). Dis-
tributed data clustering in the context of the internet
of things: A data traffic reduction approach. In Pro-
ceedings of the 23rd Brazillian Symposium on Multi-
media and the Web, WebMedia ’17, pages 313–316,
New York, NY, USA. ACM.
Cantoni, V., Lombardi, L., and Lombardi, P. (2006). Chal-
lenges for data mining in distributed sensor networks.
In 18th International Conference on Pattern Recog-
nition (ICPR’06), volume 1, pages 1000–1007, Hong
Kong, China. IEEE.
Chen, F., Deng, P., Wan, J., Zhang, D., Vasilakos, A. V.,
and Rong, X. (2015). Data mining for the inter-
net of things: Literature review and challenges. In-
ternational Journal of Distributed Sensor Networks,
11(8):431047.
Chovatiya, F., Prajapati, P., Vasa, J., and Patel, J. (2018). A
research direction on data mining with iot. In Satapa-
thy, S. C. and Joshi, A., editors, Information and Com-
munication Technology for Intelligent Systems (ICTIS
2017) - Volume 1, pages 183–190, Cham. Springer In-
ternational Publishing.
Cisco (2014). Cisco global cloud index: Forecast and
methodology, 2014 – 2019.
Goldschmidt, R., Bezerra, E., and Passos, E. (2015). Data
Mining: Conceitos, t
´
ecnicas, algoritmos, orientac¸
˜
oes
e aplicac¸
˜
oes. Elsevier Brazil, Rio de Janeiro, Brazil.
Gubbi, J., Buyya, R., Marusic, S., and Palaniswami, M.
(2013). Internet of things (iot): A vision, architec-
tural elements, and future directions. Future Genera-
tion Computer Systems, 29(7):1645 – 1660. Including
Special sections: Cyber-enabled Distributed Comput-
ing for Ubiquitous Cloud and Network Services and
Cloud Computing and Scientific Applications — Big
Data, Scalable Analytics, and Beyond.
Haller, S., Karnouskos, S., and Schroth, C. (2009). The in-
ternet of things in an enterprise context. In Domingue,
J., Fensel, D., and Traverso, P., editors, Future In-
ternet – FIS 2008, pages 14–28, Berlin, Heidelberg.
Springer Berlin Heidelberg.
IDC (2016). 2016 global iot decision maker survey.
Januzaj, E., Kriegel, H.-P., and Pfeifle, M. (2004). DBDC:
Density Based Distributed Clustering, pages 88–105.
Springer Berlin Heidelberg, Berlin, Heidelberg.
Mashayekhi, H., Habibi, J., Khalafbeigi, T., Voulgaris, S.,
and van Steen, M. (2015). Gdcluster: A general de-
centralized clustering algorithm. IEEE Transactions
on Knowledge and Data Engineering, 27(7):1892–
1905.
Miorandi, D., Sicari, S., Pellegrini, F. D., and Chlamtac, I.
(2012). Internet of things: Vision, applications and
research challenges. Ad Hoc Networks, 10(7):1497 –
1516.
Park, E., del Pobil, A. P., and Kwon, S. J. (2018). The role
of internet of things (iot) in smart cities: Technology
roadmap-oriented approaches. Sustainability, 10(5).
Shi, W., Cao, J., Zhang, Q., Li, Y., and Xu, L. (2016). Edge
computing: Vision and challenges. IEEE Internet of
Things Journal, 3(5):637–646.
ICEIS 2019 - 21st International Conference on Enterprise Information Systems
570
