
Unifying Data and Replica Placement for Data-intensive Services in
Geographically Distributed Clouds
Ankita Atrey
1
, Gregory Van Seghbroeck
1
, Higinio Mora
2
, Filip De Turck
1
and Bruno Volckaert
1
1
IDLAB-imec, Technologie Park, Ghent University, Ghent, Belgium
2
University of Alicante, Alicante, Spain
Keywords:
Data Placement, Replica Placement, Geographically Distributed Clouds, Location-Based Services, Online
Social Networks, Scalability, Overlapping Clustering.
Abstract:
The increased reliance of data management applications on cloud computing technologies has rendered re-
search in identifying solutions to the data placement problem to be of paramount importance. The objective
of the classical data placement problem is to optimally partition, while also allowing for replication, the set of
data-items into distributed data centers to minimize the overall network communication cost. Despite signifi-
cant advancement in data placement research, replica placement has seldom been studied in unison with data
placement. More specifically, most of the existing solutions employ a two-phase approach: 1) data placement,
followed by 2) replication. Replication should however be seen as an integral part of data placement, and
should be studied as a joint optimization problem with the latter. In this paper, we propose a unified paradigm
of data placement, called CPR, which c
ombines data placement and replication of data-intensive services into
geographically distributed clouds as a joint optimization problem. Underneath CPR, lies an overlapping cor-
relation clustering algorithm capable of assigning a data-item to multiple data centers, thereby enabling us to
jointly solve data placement and replication. Experiments on a real-world trace-based online social network
dataset show that CPR is effective and scalable. Empirically, it is ≈ 35% better in efficacy on the evaluated
metrics, while being up to 8 times faster in execution time when compared to state-of-the-art techniques.
1 MOTIVATION
With the emergence of Cloud computing, Big Data,
and Internet of Things (IoT), the rate at which data
is being generated is increasing exponentially (ins,
2017; gro, 2018). Although advancements in modern
hardware, cloud computing, and big data technolo-
gies have enabled development of multiple distributed
systems (such as Hadoop (White, 2012) and Apache
Spark (Zaharia et al., 2016)) that have significantly
enriched the field of scalable data management, ef-
fective strategies for data partitioning and placement
remain cardinal to the performance of such systems.
Consistent with the requirement of data-intensive ser-
vices to access multiple datasets within each trans-
action (Golab et al., 2014; Yu and Pan, 2015; Zhao
et al., 2016a; Zhao et al., 2016b; Shabeera et al.,
2017), specialized solutions for data placement have
recently been proposed based on hypergraph parti-
tioning (Yu and Pan, 2017) and spectral clustering on
hypergraphs (Atrey et al., 2018). This is because for
data-intensive services, traditional solutions (as em-
ployed by Hadoop or Spark) based on uniform par-
titioning of data-items using hashing may result in a
huge volume of data migrations (Golab et al., 2014;
Atrey et al., 2018), thereby leading to network con-
gestion and eventually reduced system throughput.
Online social networks (OSNs) are one of the
most prevalent instances of data-intensive services
in the real-world (Yu and Pan, 2017). Consider a
location-based OSN service as presented in Fig. 1. A
sample social network is represented using a graph
where each vertex corresponds to a user and undi-
rected edges between two vertices represent friend-
ship. In this network, users {v
3
,v
5
,v
6
,v
7
} are friends
of the user v
4
. Similarly {v
2
,v
3
} are friends of v
1
.
The list of all the friends of every user is also por-
trayed in a table in Fig. 1. There exists a notion of
a data-item corresponding to each user of the social
network, which represents the most recent snapshot
(e.g. profile picture, videos, textual posts etc.) of
her profile. As shown in Fig. 1, the data-item cor-
responding to the user v
1
is denoted as d(v
1
), that
of user v
2
is denoted as d(v
2
) and so on. Addition-
Atrey, A., Van Seghbroeck, G., Mora, H., De Turck, F. and Volckaert, B.
Unifying Data and Replica Placement for Data-intensive Services in Geographically Distributed Clouds.
DOI: 10.5220/0007613400250036
In Proceedings of the 9th International Conference on Cloud Computing and Services Science (CLOSER 2019), pages 25-36
ISBN: 978-989-758-365-0
Copyright
c
2019 by SCITEPRESS – Science and Technology Publications, Lda. All rights reserved
25

V
2
V
3
V
6
V
7
V
5
V
4
User
List
of Friends
V
1
V
2
, V
3
V
2
V
1
, V
3
V
3
V
1
, V
2
, V
4
V
4
V
3
, V
5
, V
6
, V
7
V
5
V
4
, V
6
, V
7
V
6
V
4
, V
5
, V
7
V
7
V
4
, V
5
, V
6
Virginia
Tokyo
Frankfurt
Sydney
𝑑(𝑣
$
)
𝑑(𝑣
&
)
…
d(V
1
)
d(V
2
)
d(V
5
)
d(V
7
)
d(V
6
)
d(V
3
)
Virginia
Tokyo
Frankfurt
Sydney
d(V
4
)
(1) Data
Placement
d(V
1
)
d(V
2
)
d(V
5
)
d(V
7
)
d(V
6
)
d(V
3
)
Virginia
Tokyo
Frankfurt
Sydney
d(V
4
)
d(V
1
)
(1 + 2) CPR
(2) Replication
d(V
4
)
d(V
2
)
d(V
7
)
d(V
3
)
d(V
6
)
d(V
5
)
V
1
Set of data-items
Figure 1: Location Based OSN Service: The standard data placement process (in green): where the data-items are first placed
in data centers (black dots) and then replicated (red dots); and the proposed CPR paradigm (in magenta): where both data
placement and replication is performed in a single step.
ally, each user can register a check-in, which is as-
signed to a data center nearest (in geographical dis-
tance) to her check-in location. Each user check-in
requires retrieval of data from her friends, constituting
a data request pattern triggered by this check-in. For
example, while registering a check-in in Virginia the
user v
7
may want to tag/mention some of her friends.
This would require the data-items corresponding to
her friends {v
4
,v
5
,v
6
} to be available at the Virginia
data center, thereby triggering a data request for trans-
ferring data-items {d(v
4
),d(v
6
),d(v
7
)} to Virginia.
Motivated by the use-case discussed above, the
problem of combined data placement and replication
(CPR) for data-intensive services in data centers that
are distributed geographically across the world is the
topic of research tackled in this paper.
A careful analysis of the objectives of the general-
ized data placement problem (Golab et al., 2014) indi-
cates that both data and replica placement are tightly
coupled, and should be considered as part of a single
optimization problem. In fact, data placement without
replication is a specialized instance of the generic data
placement problem. Additionally, support for repli-
cation is important to ensure fault tolerance. Thus,
replica placement or replication is an integral part of
the data placement problem. Having said that, despite
continued and rigorous advancement of the state-of-
the-art in the field of data placement (Golab et al.,
2014; Yu and Pan, 2017; Atrey et al., 2018), to the
best of our knowledge and as detailed in Sec. 2, none
of the existing techniques are capable of jointly per-
forming data and replica placement. More specifi-
cally, most of the techniques in the literature employ
an ad hoc two-phase approach – data placement fol-
lowed by replication (Fig. 1) – each independently
catering to a sub-part of the overall optimization ob-
jective, which results in solutions of inferior quality.
To bridge this gap, a unified paradigm of com-
bining data and replica placement, CPR, for data-
intensive services in geo-distributed clouds is pro-
posed in this paper. We propose an overlapping corre-
lation clustering algorithm to solve the joint optimiza-
tion problem of data and replica placement. Specifi-
cally, overlapping clustering enables a data-item to be
assigned to multiple data centers, thereby facilitating
both data placement and replication in a single step.
Key contributions of this work are as follows:
• We study a novel variant of the data placement
problem, CPR, for data-intensive services in geo-
distributed data centers, which aims at unifying
data and replica placement as a joint optimization
problem (Sec. 3).
• We propose a novel algorithm using overlapping
correlation clustering on hypergraphs, which can
assign the same data-item to different data centers
(Sec. 4). This facilitates jointly solving the data
placement and replication problem, as opposed to
the existing two-phase approach employed by the
state-of-the-art. The proposed algorithm solves a
multi-objective optimization, where among others,
it facilitates optimization of latency, storage cost,
inter data center traffic, and data center span.
• Through extensive experiments on a real-world
trace-based social network dataset (Sec. 5), we
show that the proposed overlapping clustering al-
gorithm is scalable and effective.
CLOSER 2019 - 9th International Conference on Cloud Computing and Services Science
26

2 RELATED WORK
The data placement problem, being a fundamental
question in computer science, has witnessed a huge
amount of research over the years, with techniques
being developed for different execution environments
such as: grid (Kosar and Livny, 2004; Kosar and
Livny, 2005; Ding and Lu, 2009), distributed (Cher-
venak et al., 2007; Golab et al., 2014), and cloud
computing (Yu et al., 2012; Guo and Wang, 2013; Li
et al., 2017; Ferdaus et al., 2017) environments. From
the perspective of the type of workloads, traditionally
the focus was on scientific workflows (Yuan et al.,
2010; Liu and Datta, 2011; Ebrahimi et al., 2015) and
relational workloads such as database joins (Golab
et al., 2014), however, of late the focus is moving to-
wards workloads arising from niche applications such
as OSN services (Jiao et al., 2014; Han et al., 2017)
and data intensive services in geo-distributed clouds
(Agarwal et al., 2010; Yu and Pan, 2015; Yu and
Pan, 2016; Zhang et al., 2016; Yu and Pan, 2017).
Since the focus of this paper is on combining data
placement and replication for data-intensive services
in geo-distributed data centers, we present a review of
existing research that overlap with our work.
Any successful solution to the data placement
problem in geo-distributed data centers should pro-
vide two capabilities, namely – capturing and improv-
ing (1) data-item – data-item associations (i.e., the
number of times two data-items were requested to-
gether); and (2) data-item – data center associations
(i.e., the number of times a data-item was requested
at a given data center). On the one hand, a frequent
pattern mining based technique proposed by (Nish-
tala et al., 2013), and a hierarchical clustering algo-
rithm on correlations between data-items proposed
by (Zhao et al., 2016b; Zhao et al., 2016a), facil-
itate management of data-item – data-item associa-
tions. On the other hand, methods proposed by (Agar-
wal et al., 2010; Huguenin et al., 2012; Rochman
et al., 2013; Zhang et al., 2016) facilitate capturing
of data-item – data center associations. Specifically,
(Agarwal et al., 2010) proposed a system Volley that
analyzes logs of data center requests to perform au-
tomatic data placement in geographically distributed
data centers. (Rochman et al., 2013) design robust
data placement algorithms to ensure that a large frac-
tion of region specific requests is served at a lower
cost, while managing the highly dynamic nature of
user requests. (Zhang et al., 2016) propose an inte-
ger programming based algorithm for minimizing the
data communication cost while honoring the data cen-
ter storage capacities. However, these methods do not
possess both the aforementioned capabilities.
Of late, literature has seen an increased use of
hypergraph-based techniques for data placement in
geo-distributed clouds, which also constitute the cur-
rent state-of-the-art. Yu et al. (Yu and Pan, 2015;
Yu and Pan, 2017) propose data placement strategies
using hypergraph modeling and publicly available
partitioning heuristics (Catalyurek, 2011) for data-
intensive services. While hypergraph-based modeling
facilitates capturing of both data-item – data-item and
data-item – data center associations, the hypergraph
partitioning heuristics available in (Catalyurek, 2011)
facilitate these techniques to scale to large datasets.
Recently, Atrey et al. (Atrey et al., 2018) presented
a spectral clustering algorithm that employed the use
of low-rank approximations of the hypergraph lapla-
cian to obtain superior efficiency and scalability while
retaining the same efficacy as portrayed by (Yu and
Pan, 2017). Hypergraph based partitioning solutions
(Catalyurek et al., 2007) have also been used in grid
and distributed computing environments.
There also exists research pertaining to other
aspects of geo-distributed data placement, such as
placement in multi-clouds and the design of special-
ized replication strategies. The technique proposed
by (Jiao et al., 2014) facilitates data placement in a
multi-cloud environment and solves a multi-objective
optimization to minimize the carbon footprint and in-
ter cloud traffic. (Han et al., 2017) introduce an al-
gorithm to perform data migration decisions for OSN
services in a multicloud environment, which is capa-
ble of adapting to the changing data traffic. Location-
aware replication strategies
1
capable of optimizing on
metrics such as location of geo-distributed data cen-
ters, and inter data center communication costs were
proposed by (Shankaranarayanan et al., 2014). How-
ever, none of these techniques capture both data-item
– data-item and data-item – data center associations.
Thus, we choose the techniques presented by (Yu and
Pan, 2017) and (Atrey et al., 2018) as the representa-
tive state-of-the-art methods for comparison.
Having said that, to the best of our knowledge,
none of the existing state-of-the-art methods de-
scribed above are capable of unifying data and replica
placement as a joint optimization problem. Specifi-
cally, as discussed in Sec. 1 the techniques existing
in the literature employ a two-phase approach, where
replication is performed as an independent step af-
ter obtaining the data-item assignments from a data
placement algorithm. This ad hoc two-phase ap-
proach has several disadvantages such as sub-optimal
replica placement quality, and decreased efficiency
owing to solving two independent optimization prob-
1
The reader is referred to (Grace and Manimegalai,
2014) for a survey of replica placement algorithms.
Unifying Data and Replica Placement for Data-intensive Services in Geographically Distributed Clouds
27

lems instead of one. To this end, the research pre-
sented in this paper proposes a unified data place-
ment paradigm – CPR, capable of jointly perform-
ing data and replica placement of data-intensive ser-
vices into geographically distributed clouds, through
a novel approach of data partitioning using overlap-
ping correlation clustering on Hypergraphs. More
fundamentally, overlapping clustering allows a data-
item to be assigned to multiple data centers (clusters)
at the same time, thereby facilitating both data and
replica placement in a single step. In other words,
the proposed overlapping clustering based algorithm
provides a unified solution to the combined data and
replica placement problem for data-intensive services.
3 PROBLEM STATEMENT
Given a set of data-items, data centers, data request
patterns, and the replication factor, the objective of
the combined (or generalized) data and replica place-
ment problem (CPR) is to intelligently place the data-
items, allowing for replication wherever applicable,
across data centers so as to minimize the overall com-
munication cost resulting from migration/replication
2
of data-items corresponding to different data requests.
Note that analogous to most of the techniques in
data placement literature (Golab et al., 2014; Ferdaus
et al., 2017; Zhao et al., 2016b; Yu and Pan, 2017;
Atrey et al., 2018), we consider the system work-
load represented by data request patterns to be static.
Thus, the proposed algorithm is offline, and has to be
re-executed from scratch to accommodate changes in
the system workload. Designing algorithms that can
accommodate changes in the workload in an online
manner would constitute as future work.
Next, we introduce some basic concepts of data
placement in the context of OSN services, followed
by a formal description of the CPR problem for data-
intensive services in geo-distributed data centers.
A location based online social network (Fig. 1)
possesses two aspects: (1) a social network connect-
ing users with their friends, and (2) a capability for
the users to register check-ins at potentially different
locations across the globe.
Definition 1 (Social Network. (G(V,E))). A social
network with n individuals and m social ties can be
denoted as a graph G(V,E), where V is the set of
2
Migration or replication of data-items may involve ad-
ditional overheads such as data-item retrieval delays, packet
loss etc. For the sake of brevity, the focus of this paper is
on minimizing the communication cost alone, however, the
proposed data-placement algorithm is generic, and not re-
stricted in its scope based on this assumption.
nodes representing the users of the social network,
|V |= n, and E is the set of edges (representing friend
relationships) between any two nodes, E ⊆ V × V ,
|E|= m.
In the context of data placement, a data-item is an
atomic unit of data storage and transfer. Thus, for the
OSN use-case:
Definition 2 (Data-items (D).). A data-item is de-
fined as the most recent snapshot of a user’s profile
(e.g. profile picture, posts, comments etc.). The set
D contains n data-items corresponding to each user
v ∈ V of the social network, where the data-item for a
user v is denoted as d(v).
Moving ahead, a check-in depicts a social net-
work user visiting any location in the world. Each
user check-in is composed of two parts: (1) a location
where the check-in was recorded, and (2) a data re-
quest pattern triggered by the check-in. As discussed
in Sec. 1, the location of a user check-in is decided
as the location of a data center closest (in distance) to
the actual physical location of the user check-in.
Definition 3 (Data-centers (L).). A data center con-
stitutes a set of resources to store the data-items and
perform different computational tasks on the stored
data-items. Each data center is hosted at a location
L
j
∈ L, where |L|= l denotes the set of data center
locations.
Further, the data request corresponding to a user
check-in requires retrieval of the data-items of her
friends (Sec. 1). Usually for large scale systems such
as OSNs, the data-items (profiles of OSN users) are
distributed across data centers and might require mi-
gration/replication from one data center to another.
The data-items that are potential candidates for mi-
grations constitute a data request, which is formally
defined as follows.
Definition 4 (Data-request Patterns (R ).). A data re-
quest pattern R(v) ∈ R corresponding to a check-in
by a user v at the data center location L
j
is com-
prised of the set of data-items corresponding to all
the friends of v. Mathematically, R(v) = {d(u) | u ∈
Adj(v)}. Further, R(v) denotes the set of data-items
that are required to be collocated in the same data
center L
j
, and those that are not stored in L
j
are com-
municated (either migrated or replicated) from the
data centers in which they are stored to L
j
. The set
of data request patterns denoted as R represents the
system workload.
As an example, the data request pattern for a
check-in by the user v
1
(Fig. 1) is denoted as R(v
1
) =
{d(v
2
),d(v
3
)}. Given this information, a check-in is
formally defined as follows:
CLOSER 2019 - 9th International Conference on Cloud Computing and Services Science
28

Definition 5 (Check-ins. (C )). A check-in is a tuple
∀k
1≤k≤ρ
, C
k
= (R(v),L
j
) ∈ C consisting of a data re-
quest pattern R(v) ∈ R triggered by v and a location
L
j
∈ L of a data center capable of serving user re-
quests. The set C contains ρ user check-ins.
In other words, the check-in C
k
by a user v at a
location L
j
signifies a request for the data-items con-
tained in R(v) triggered from the data center located at
L
j
. For example, if the user v
3
in Fig. 1 was the first
to register a check-in among all other users, which
was recorded at the L
4
=Tokyo data center, then C
1
=
(R(v
3
),L
4
), where R(v
3
) = {d(v
1
),d(v
2
),d(v
4
)}.
Note that a user can register multiple check-ins
at the same location, and to better capture data-
item – data-item and data-item – data center associ-
ations, each individual check-in is treated as differ-
ent from the other. For example, if two data-items
d(v
2
) and d(v
3
) are requested together seven times
they would possess a stronger data-item – data-item
association than data-items d(v
1
) and d(v
2
) that co-
exist in data request patterns just twice. Similarly, if
a user v
5
visited Sydney five times the data-items in
R(v
5
) would possess a stronger data-item – data cen-
ter association with Sydney when compared to that
of any other data center which was visited less often.
To capture this, for each check-in by the user v
5
at
L
3
=Sydney there would be 5 different check-ins de-
noted as C
k
,...,C
k+5
, each composed of the data re-
quest pattern R(v
5
) and the location L
3
. Moreover,
this also substantiates the reason behind not indexing
each user check-in uniquely using data request pat-
terns R and locations L
j
.
Having defined the basic concepts and their nota-
tions, we formally define the CPR problem as:
Problem. Given a set of n data-items D correspond-
ing to the set of social network users V , ρ user check-
ins C
k
= (R(v),L
j
) ∈ C | v ∈ V, L
j
∈ L representing
the system workload, each comprising a data request
pattern R(v) being originated from a data center lo-
cated at L
j
, a set of l data centers with locations in
L, with the per unit cost of outgoing traffic from each
data center Γ(L
j
) | L
j
∈ L, the per unit storage cost
of each data center S(L
j
) | L
j
∈ L, the inter data
center latency (directed) for each pair of data cen-
ters κ(L
j
,L
j
0
) | L
j
,L
j
0
∈ L, the average number of
data centers spanned by the data-items correspond-
ing to each request pattern R(v) being N (R(v)), and
the replication factor r, perform combined data and
replica placement to minimize the optimization objec-
tive O, which is defined as the weighted average
3
of
Γ(·),κ(·,·),S(·), and N (·).
3
The weights determine the relative importance of these
metrics towards the overall optimization objective, and
would be discussed in Sec. 4.1.
4 OVERLAPPING CLUSTERING
ON HYPERGRAPHS
Given the set of data-items D and the set of user
check-ins C representing the system workload, the
first step is to construct a hypergraph. This results
in a higher-order representation of the interaction be-
tween the data-items and the data centers in the form
of the hypergraph incidence matrix Π, and the hy-
peredge weight matrix W
Π
representing the relative
importance of the constructed hyperedges. The next
step is to partition the set of data-items D into l data
centers such that each data-item d(v) ∈ D is assigned
to r < l (allowing for replication) data centers, which
is achieved using the proposed overlapping clustering
algorithm. An overview of the proposed technique is
presented in Fig. 2.
4.1 Hypergraph Construction
Literature on data placement of data intensive services
(Yu and Pan, 2017; Atrey et al., 2018) has provided
sufficient evidence in support of hypergraphs as the
most suitable choice for modeling the interactions be-
tween both data-items – data-items and data-items –
data centers. Hyperedges allow to model relation-
ships between several vertices as opposed to just a
pair of vertices in traditional graphs. Being a more so-
phisticated construct a hypergraph H(V
H
,E
H
) serves
as a generalization over a graph G(V,E). With this
capability to capture multi-way relationships, hyper-
graphs provide a powerful representation to model
data-item – data-item and data-item – data center as-
sociations.
The system workload represented using user
check-ins gives rise to two types of hyperedges E
H
:
(1) hyperedges corresponding to data request patterns
R that connect all the data-items (data-item – data-
item association) in a data request triggered from a
user check-in; and (2) hyperedges R
L
that connect the
data-items requested in a check-in with the data center
location (data-item – data center association) where
the check-in was registered. Thus, the set of vertices
V
H
in the constructed hypergraph consist of the set of
data-items D and data center locations L, totaling to
|V
H
|= n
0
= n + l vertices, and |E
H
|= m
0
= r + nl hy-
peredges. Eq. 1 formally defines these two sets.
V
H
= D ∪ L
E
H
= R ∪ R
L
(1)
Given that there are two different types of hyper-
edges, there are two types of weights corresponding
to either type, with each focused towards optimizing
Unifying Data and Replica Placement for Data-intensive Services in Geographically Distributed Clouds
29

Construct
Hypergraph
Hypergraph
Incidence
Matrix (𝚷)
Overlapping
Correlation
Clustering
CPR
Output
Set of User
Check-ins (𝒞)
Input
Workload
Virginia
Frankfurt
User Relationships
(OSN)
Calculate
Hyperedge
Weights
Hyperedge
Weight
Matrix (𝐖
𝚷
)
Set of Data-
items (𝒟)
Figure 2: Overview of the proposed overlapping correlation clustering technique for combined data and replica placement.
a different aspect of the problem. More specifically,
the weight W
R
corresponds to the data request pattern
hyperedges, and its aim is to facilitate minimization of
N (R
i
): the average number of data centers accessed
by a data request pattern R
i
, which is achieved by en-
forcing the data-items that are requested together to
be placed together. On the other hand, the weights
(W
κ
R
L
,W
S
R
L
,W
Γ
R
L
) correspond to the data-item – data
center hyperedges, and their aim is to minimize inter
data center latency κ(L
j
,L
j
0
), storage cost S(L
j
), and
cost of outgoing traffic Γ(L
j
) respectively, by giving
higher priority to placing data-items at data center lo-
cations from where they have been requested more
frequently. The resultant hyperedge weight matrix
is then constructed as the weighted sum of the four
weights discussed above, which is mathematically de-
fined as:
W
Π
= W · (W
R
,W
κ
R
L
,W
S
R
L
,W
Γ
R
L
). (2)
where, W
Π
is a diagonal matrix of size m
0
× m
0
, and
W is the weight vector for deciding the priorities of
the previously discussed hyperedge weighting strate-
gies
4
.
The hypergraph H(V
H
,E
H
) is represented using a
n
0
× m
0
dimensional hypergraph incidence matrix Π,
which possesses m
0
hyperedges, and each hyperedge
is a n
0
-dimensional binary column vector. It is for-
mally defined as:
∀he
i
∈ E
H
,he
T
i
= [he
1,i
,he
2,i
,...,he
n
0
,i
].
Π = [he
1
,he
2
,...,he
m
0
]. (3)
An entry he
j,i
= 1 indicates that the j
th
vertex in the
hypergraph vertex set is participating in the i
th
hyper-
edge, while he
j,i
= 0 indicates otherwise.
Overlapping correlation clustering requires a sim-
ilarity matrix denoting similarities between each ver-
tex pair in the (hyper)graph as input. To this end,
we construct the normalized hypergraph matrix N
H
,
which requires two additional operations on the hy-
pergraph incidence matrix Π. We compute two diag-
onal matrices – the vertex degree matrix (D
vΠ
) and
4
For additional details about the hypergraph construc-
tion and the hyperedge weight calculation steps the reader
is referred to (Yu and Pan, 2017; Atrey et al., 2018).
the hyperedge degree matrix (D
heΠ
) of dimensional-
ity n
0
× n
0
and m
0
× m
0
respectively. The vertex de-
gree matrix captures the number of hyperedges each
vertex of the hypergraph is a part of, while the hyper-
edge degree matrix measures the number of vertices
contained in each hyperedge. Mathematically,
D
vΠ
= diag(
∑
Π). (4)
D
heΠ
= diag(
∑
Π
T
). (5)
where,
∑
X represents the row-wise sum of the input
matrix X and X
T
represents the transpose of the ma-
trix X.
With this, the normalized hypergraph matrix N
H
is mathematically defined as:
N
H
=
D
−1/2
vΠ
· Π · W
Π
· D
−1
heΠ
· Π
T
· D
−1/2
vΠ
(6)
where, D
vΠ
is a n
0
× n
0
diagonal vertex degree matrix,
D
heΠ
is a m
0
× m
0
diagonal hyperedge degree matrix,
and W
Π
is a m
0
× m
0
diagonal hyperedge weight ma-
trix. Thus, N
H
becomes a n
0
× n
0
matrix.
4.2 Overlapping Correlation Clustering
We begin with a description of correlation clustering:
where given a complete graph with edges labeled as
positive or negative, the objective is to identify a par-
titioning of the graph such that it minimizes the sum
of the number of positively labeled edges cut and the
number of negatively labeled edges not cut by the
partition. In the current scenario, the input is a nor-
malized hypergraph similarity matrix N
H
represent-
ing the pair-wise similarity between data-items, and
a set L of l labels representing the data center loca-
tions. The task of correlation clustering is to find a
mapping F : V
H
→ L for partitioning the set of data-
items into l data centers, that minimizes the following
loss function:
L
Correlate
(V
H
,F ) =
∑
(u,v)∈V
H
×V
H
F (u)=F (v)
(1 − N
H
(u,v))
+
∑
(u,v)∈V
H
×V
H
F (u)6=F (v)
N
H
(u,v). (7)
CLOSER 2019 - 9th International Conference on Cloud Computing and Services Science
30

Algorithm 1: Overlapping Clustering Algorithm.
Input: Π, W
Π
, l, r, Φ
Output: Partitioning of the hypergraph vertex set P (V
H
)
into l clusters allowing r replicas
1: D
v
(Π) ← diag(
∑
Π); D
he
(Π) ← diag(
∑
Π
T
)
2: Compute normalized hypergraph N
H
as described in
Eq. 6
3: Randomly initialize the label sets of size r for each
data-item u ∈ V
H
4: while L
Overlap
(V
H
,F ) decreases do
5: for each u ∈ V
H
do
6: find the label set F that minimizes
L
u
Overlap
(F|F )
7: Update F (u) ← F
8: end for
9: end while
10: return P (V
H
) defined by F
As discussed in Sec. 1, the goal of overlapping
clustering is to partition the set of data-items D into
l data centers, with each data-item being assigned to
more than one data center to appropriately allow for
replication. To achieve this, instead of mapping each
data-item to a single label (corresponding to a data
center), it is mapped to a set of labels thereby al-
lowing each data-item to be associated with multiple
data centers. Given the label set definition as the set
of all subsets of data center locations L except the
empty set: L
+
= 2
L
\ {
/
0}, and a similarity function
over the data-item label sets S(·), the underlying op-
timization objective reduces to identifying a mapping
F : V
H
→ L
+
under which the similarity between any
pair of data-items ∀u,v ∈ V
H
, N
H
(u,v) agrees as much
as possible with the similarity between their corre-
sponding label sets S(F (u),F (v)).
Similar to the loss function for correlation cluster-
ing L
Correlate
, the loss function for overlapping corre-
lation clustering is defined as:
L
Overlap
(V
H
,F )
=
∑
(u,v)∈V
H
×V
H
|S(F (u),F (v)) − N
H
(u,v)|.
=
∑
u∈V
H
∑
v∈V
H
\{u}
|S(F (u),F (v)) − N
H
(u,v)|. (8)
where S(·) is defined as the set-intersection indicator
function:
S(X,Y ) =
(
1, if X ∩Y 6=
/
0.
0, otherwise.
(9)
Formally, the goal of overlapping clustering
is to find a mapping F
∗
in order to minimize
L
Overlap
(V
H
,F ), which is mathematically denoted as:
F
∗
= argmin
F
L
Overlap
(V
H
,F ). (10)
Overlapping correlation clustering was shown to
be NP-Hard in (Bonchi et al., 2013), thus, there does
not exist any polynomial time algorithm capable of
solving it. To this end, we propose a greedy algo-
rithm that iteratively refines the quality of the label
sets of one vertex (data-item) in the hypergraph at
a time. More specifically, given the label sets of all
the other vertices in the hypergraph, the greedy algo-
rithm applies a local optimization (on one vertex) to
improve the cost of the overall solution until conver-
gence. Algorithm 1 presents the pseudo-code of the
proposed overlapping clustering algorithm.
We begin by computing the normalized hyper-
graph matrix N
H
as described in Eq. 6 (lines 1–2).
Next, each vertex u ∈ V
H
is initialized with a random
label set of size r (equal to the replication factor),
thereby facilitating each data-item to be assigned to
r data centers (line 3). Post the initialization, we ap-
ply the greedy local optimization approach described
above (lines 4–9). More specifically, the label set of
each node u ∈ V
H
is iteratively improved, keeping the
label sets of all the other nodes fixed, till the over-
all loss L
Overlap
(V
H
,F ) converges. To understand the
loss with respect to each node u, we rewrite Eq. 8 as:
L(V
H
,F ) =
∑
u∈V
H
L
u
Overlap
(F (v) | F ). (11)
where
L
u
Overlap
(F (v) | F )
=
∑
v∈V
H
\{u}
|S(F (u),F (v)) − N
H
(u,v)| (12)
5 EXPERIMENTS
In this section, the proposed CPR paradigm and over-
lapping clustering algorithm is evaluated through ex-
periments on a large scale location-based OSN.
5.1 Dataset
Following the literature on data placement in geo-
distributed cloud services (Yu and Pan, 2017; Atrey
et al., 2018), we extract a trace from the Gowalla
5
social network dataset, available publicly from the
SNAP (sna, 2017) repository. The social network
consists of 196591 vertices corresponding to the users
of the social network, and 950327 edges, each repre-
senting friend relationship between two users. Addi-
tionally, the dataset contains 6442890 user check-ins
registered from February 2009 to October 2010, trig-
gering a total of 102314 data request patterns.
5
http://snap.stanford.edu/data/loc-gowalla.html
Unifying Data and Replica Placement for Data-intensive Services in Geographically Distributed Clouds
31

Table 1: (a) Traffic and Storage costs, and (b) Inter data center latency based on Geo-distributed Amazon Clouds.
(a) Costs (in $)
Region
Storage Outgoing
($/GB-month) Traffic ($/GB)
Virginia 0.023 0.02
California 0.026 0.02
Oregon 0.023 0.02
Ireland 0.023 0.02
Frankfurt 0.025 0.02
Singapore 0.025 0.02
Tokyo 0.025 0.09
Sydney 0.025 0.14
Sao Paulo 0.041 0.16
(b) Latency (in ms)
Region Virginia California Oregon Ireland Frankfurt Singapore Tokyo Sydney Sao Paulo
Virginia 3.523 72.738 86.981 80.546 88.657 216.719 145.255 229.972 119.531
California 71.632 5.842 19.464 153.202 166.609 174.010 102.504 157.463 192.670
Oregon 88.683 19.204 5.551 136.979 159.523 161.367 89.095 162.175 182.716
Ireland 80.524 153.220 136.976 5.005 19.560 239.023 212.388 309.562 191.292
Frankfurt 88.624 166.590 159.542 19.533 4.425 325.934 236.537 323.483 194.905
Singapore 216.680 173.946 161.423 238.130 325.918 5.870 73.807 175.328 328.080
Tokyo 145.261 102.523 89.157 212.388 236.558 73.785 6.846 103.907 256.763
Sydney 229.748 157.843 161.932 309.562 323.152 175.355 103.900 4.889 322.494
Sao Paulo 119.542 192.700 181.665 191.559 194.900 327.924 256.665 322.523 6.076
5.2 Experimental Setup
All experiments are performed using code written in
C++ on an Intel(R) Xeon(R) E5-2698 28-core ma-
chine with 2.3 GHz CPU and 256 GB RAM run-
ning Linux Ubuntu 16.04. Owing to their non-
deterministic nature, results corresponding to the ran-
dom, hypergraph partitioning, and spectral clustering
methods are averaged over 10 runs.
We simulate a real-world geo-distributed cloud
environment based on the AWS global infrastruc-
ture(aws, 2017a). To ensure consistency with previ-
ous research (Yu and Pan, 2015; Atrey et al., 2018),
we use the l = 9 oldest and prominent AWS data cen-
ter regions, namely: Virginia, California, Oregon, Ire-
land, Frankfurt, Singapore, Tokyo, Sydney, and Sao
Paulo. To closely mirror the actual AWS setup, the
costs involved for storage and outgoing traffic are as
advertised by Amazon. Moreover, the inter data cen-
ter latencies between the chosen regions are measured
by the packet transfer latency using the Linux ping
command(aws, 2017b). These data center character-
istics are presented in Table 1.
An analysis of user check-ins revealed the exis-
tence of disparity in their check-in behavior. Some
data centers (ex: Virginia and Frankfurt) register a
very high number of check-ins, while others (ex:
SaoPaulo and Sydney) receive very few. This effects
the amount of storage required at each data center,
which is dependent upon both the number of check-
ins registered in a region and the size of data request
pattern triggered by each check-in. Based on this, the
storage size for each data center region ∀L
j
∈ L is
calculated as S
j
=
∑
|R(v)|| ∃C
k
= (R(v),L
j
),L
j
∈ L.
Let S =
∑
l
j=1
S
j
be the total storage size, then the
data center storage size follows a multinomial distri-
bution and is calculated as: Φ ∼ [
S
1
S
,
S
2
S
,...,
S
l
S
]. The
expected storage size at each data center calculated
using Φ serves as the load-balancing factor, and is in-
put to the data placement algorithm to facilitate load-
balancing among the 9 data center regions.
To summarize, for the Gowalla dataset the data
placement task reduces to partitioning 196591 data-
items corresponding to the social network users into
9 data centers based on the 102314 data request pat-
terns triggered from user check-ins.
Baselines: We compare the proposed data place-
ment algorithm for effectiveness, efficiency, and scal-
ability with four baselines.
• Random: partitions the set of data-items D ran-
domly into |L| data centers.
• Nearest: assigns each data-item to the data cen-
ter from where it has been requested the highest
number of times.
• Hypergraph Partitioning (Hyper): is the data
placement algorithm proposed by (Yu and Pan,
2015; Yu and Pan, 2017), which uses the hyper-
graph partitioning algorithms available in the Pa-
ToH toolkit (Catalyurek, 2011).
• Spectral Clustering (Spectral): is the data place-
ment algorithm proposed by (Atrey et al., 2018),
which uses fast approximate eigen decomposition
methods for efficiently performing spectral clus-
tering on hypergraphs.
As discussed in Sec. 2, Hyper (Yu and Pan, 2017)
and Spectral (Atrey et al., 2018) serve as the repre-
sentative state-of-the-art methods for data placement
of data-intensive services in geo-distributed data cen-
ters. To ensure load balancing, all the techniques par-
tition the data-items according to the data center stor-
age size distribution Φ. Thus, the results for the bal-
ance evaluation metric are close to 1 for all the tech-
niques considered in this study.
Parameters. The weight vector W (Eq. 2 facili-
tates optimization of different objectives by priori-
tizing different hyperedge weights (Sec. 4.1) which
represent different preferences or importance towards
the considered evaluation metrics. To this end,
we experiment with varying settings for W: W
1
:
{100,1,1,1} to minimize the data center span N (·);
W
2
: {1,100,1,1} for minimizing the inter data cen-
ter traffic Γ(·); W
3
: {1,1, 100, 1} to minimize the in-
ter data center latency κ(·); and W
4
: {1,1,1,100} for
minimizing the storage cost S(·). Note that in all the
weight-vector settings, the value 100 is just used to in-
CLOSER 2019 - 9th International Conference on Cloud Computing and Services Science
32

dicate higher relative importance of the corresponding
metric. The portrayed results are not dependent on the
specific value of 100, and can be reproduced with any
value as long as it is >> 1. Further, Spectral uses 100
smallest eigen-vectors of the hypergraph laplacian for
spectral clustering. Following best practices in data
storage management (rep, 2018), the replication fac-
tor r was set to 3.
Evaluation Metrics. We consider two categories of
evaluation metrics. The first type is concerned with
the efficiency of the studied algorithms, while the
other is concerned with their efficacy.
• Efficiency: We evaluate the efficiency of the
methods using their execution time, i.e., the time
required to produce the data placement output.
• Efficacy: of the studied methods is measured
across the following metrics.
– Span (N (·)): of a data request pattern R(v) is
defined as the average number of data centers
required to be accessed to fetch the data-items
requested in R(v). The span for the entire work-
load is calculated as the average of the data cen-
ter spans of each request pattern R(v) ∈ R .
– Traffic (Γ(·)): The total traffic cost of a data re-
quest pattern R(v) is defined as the sum of out-
going traffic prices of the data centers involved
in outgoing requests for the data-items in R(v).
The traffic cost of the entire workload is calcu-
lated as the sum of traffic costs of each request
pattern R(v) ∈ R .
– Latency (κ(·)): The inter data center latency of
a data request pattern R(v) is calculated as the
sum of access latencies required to fetch all the
data-items requested in R(v) from the data cen-
ter where they are placed to the data center from
where the request was triggered. The latency of
the entire workload is calculated as the sum of
the latencies of each request pattern R(v) ∈ R .
– Storage (S(·)): The sum of the total cost on
storing all of the data-items corresponding to
every data request pattern R(v) ∈ R in data cen-
ters L prescribed by the data placement algo-
rithm.
– Balance: is calculated as the pearson’s cor-
relation coefficient between the expected stor-
age size distribution Φ, and the actual storage
size distribution obtained after performing data
placement. If the value is close to 1, it means
that the two distributions are highly similar,
while they are dissimilar if the value is close
to −1.
– Objective. (Obj.): is defined as the weighted
sum of the considered performance metrics,
where the weights are described using the
weight vector W.
Note that the results portrayed corresponding to
each evaluation metric (barring Balance) have been
normalized in the scale of [0,1] by dividing each value
by the highest observed value in that particular met-
ric. For example, let nmax = max
∀R(v)∈R
(N (R(v)))
be the highest observed span value, then the span
for each data request pattern R(v) is normalized as:
N (R(v))/nmax | ∃R(v) ∈ R . A similar operation is
performed for other evaluation metrics as well. Nor-
malization ensures that all the values lie in a common
range, thereby ensuring equal and fair contribution
of each evaluation metric towards Obj. Additionally,
note that the optimization problem underneath CPR
is concerned with the minimization of the evaluation
metrics (barring Balance), hence, the smaller the por-
trayed values the better the performance is.
5.3 Evaluation Results: Quality Metrics
Figs. 3– 6 present the results on the considered eval-
uation metrics corresponding to different weight vec-
tor settings: W
1
–W
4
. It is evident that the proposed
overlapping clustering algorithm (Overlap) performs
the best (achieving the least value) on the overall op-
timization objective (Obj) across all the weight vector
settings, while being significantly better than the ran-
dom and nearest methods. Additionally, Overlap also
outperforms Hyper and Spectral by being up to 30–
40% and 20–30% better respectively.
Redirecting our focus to other evaluation metrics,
it can be noticed that Nearest outperforms Hyper,
Spectral, and Overlap in some cases, however, the
latter are still significantly better than the Random
method. For instance consider Fig. 3, it can be ob-
served that Nearest is better on the inter data center
traffic and latency metrics. This is because accord-
ing to the weight vector setting W
1
, minimizing the
data center span holds the highest priority while traf-
fic and latency metrics have lower weights in the op-
timization objective. A similar behavior is observed
for the other three weight vector settings: W
2
, W
3
,
and W
4
as well (Figs. 4– 6). To understand this ob-
served behavior better, let us analyze the results pre-
sented in Fig. 6. It is not hard to infer that storage cost
might be inversely related to other parameters such as
inter data center latency and traffic. Therefore, pref-
erentially optimizing to achieve lower storage costs
(W
4
) thereby also obtaining better performance on
Obj, might lead a technique to suffer on other met-
rics, i.e., a lower storage cost might lead to higher
latencies or traffic cost. Despite this behavior, most
importantly Overlap significantly outperforms all the
Unifying Data and Replica Placement for Data-intensive Services in Geographically Distributed Clouds
33
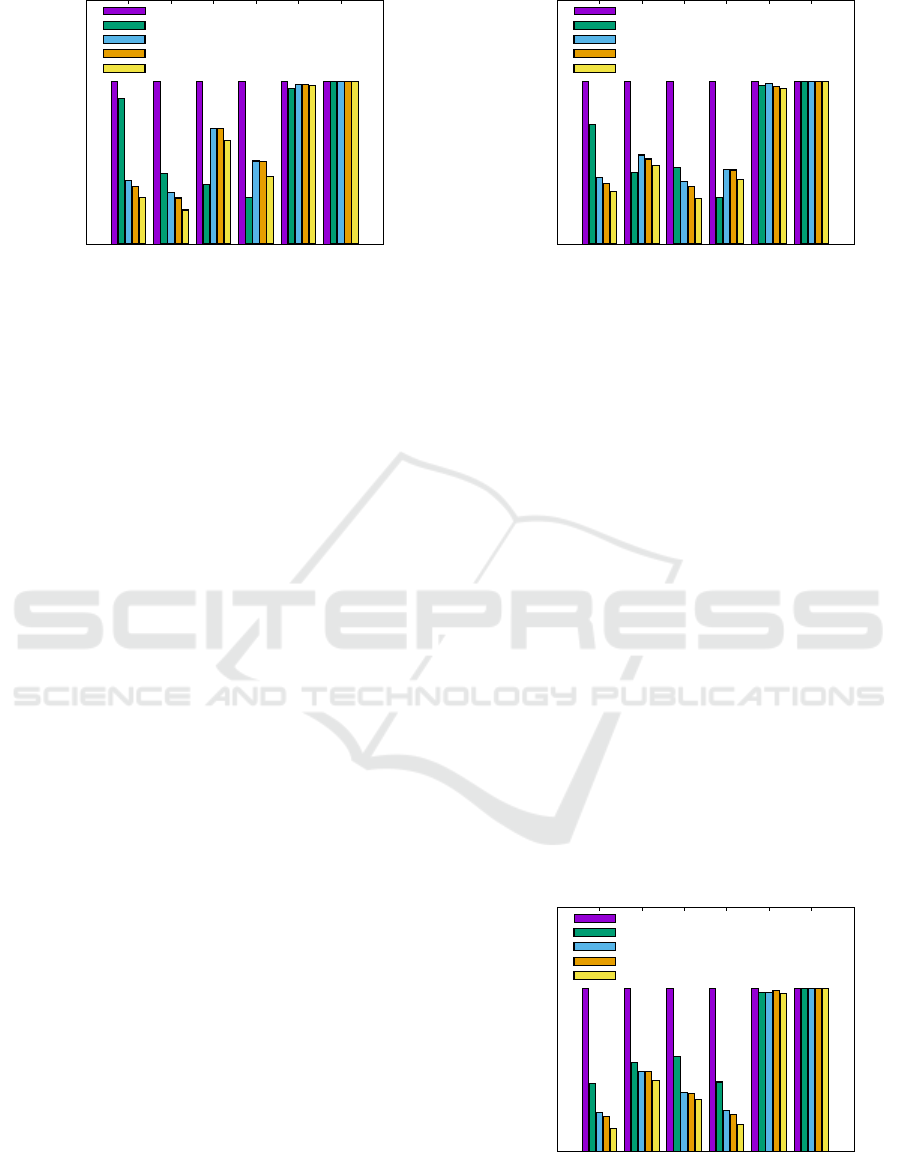
0
0.2
0.4
0.6
0.8
1
Obj
Span
Traffic
Latency
Storage
Balance
Normalized Evaluation Metrics
Random
Nearest
Hyper
Spectral
Overlap
Figure 3: Overlap results in reducing the data center span
N (·) by ≈ 35% when compared to Spectral with W
1
=
{100,1,1, 1}.
considered baselines on the corresponding evaluation
metric that the weight-vector setting is tuned to opti-
mize. More fundamentally, in addition to being better
on Obj., Overlap outperforms the other methods in
minimizing the data center span N (·), inter data cen-
ter traffic cost Γ(·), inter data center latency κ(·), and
storage cost S (·), when a higher preference is given
to these metrics under the weight-vector settings W
1
,
W
2
, W
3
, and W
4
respectively.
Moving ahead, we analyze the reason behind the
sub-optimal performance of the Nearest method. The
main limitation is that Nearest is inclined to assign
each data-item to a data center that receives the high-
est number of access requests for that data-item,
which consequently results in minimizing (on an av-
erage) the geographical distance between the data-
item and the source location of the data request. Note
that this optimization strategy is oblivious to the fact
that the storage or traffic costs might not be corre-
lated with the distance, thereby leading to sub-optimal
performance in real-world settings that require multi-
objective optimization. We also refer the reader to
Table 2, which presents a quantitative summary of the
performance of all the considered baselines indicating
how worse each baseline is relative to Overlap.
Based on the above analysis, it is clear that Hy-
per, Spectral, and Overlap possess the capability to
adapt the optimization based on the input weight vec-
tor setting. This is because of their higher-order mod-
eling capabilities courtesy hypergraphs, which ren-
ders them better suited for performing multi-objective
optimizations. Further, since Overlap models data
placement and replication as a joint optimization
problem (CPR), it achieves better performance on the
evaluation metrics when compared to both Hyper and
Spectral that solve each problem independently.
0
0.2
0.4
0.6
0.8
1
Obj
Span
Traffic
Latency
Storage
Balance
Normalized Evaluation Metrics
Random
Nearest
Hyper
Spectral
Overlap
Figure 4: Overlap results in reducing the inter data cen-
ter traffic Γ(·) by ≈ 26% when compared to Spectral with
W
2
= {1,100,1, 1}.
5.4 Evaluation Results: Efficiency and
Scalability
As analyzed in Sec. 5.3, Hyper, Spectral, and Overlap
stand out as techniques possessing good quality on the
evaluation metrics, with Overlap being the technique
possessing the best quality (≈ 30–40% better) among
them. In this section, we study their execution time
performance on the Gowalla dataset. Fig. 7 clearly
portrays the superior efficiency of Overlap when com-
pared to Hyper and Spectral, where on average it is ≈
4–5 faster when compared to Hyper, and ≈ 2–3 faster
when compared to Spectral across different weight
vector settings. Given that the scale of real-world so-
cial networks of today is humongous, the ability to
scale to large datasets is a paramount property for any
data placement algorithm. Thus, this capability to ef-
ficiently and gracefully scale to large datasets serves
as one of the major advantages of Overlap over Hyper
and Spectral.
In summary, through extensive experiments we
verify that the proposed overlapping clustering algo-
0
0.2
0.4
0.6
0.8
1
Obj
Span
Traffic
Latency
Storage
Balance
Normalized Evaluation Metrics
Random
Nearest
Hyper
Spectral
Overlap
Figure 5: Overlap results in reducing the inter data cen-
ter latency κ(·) by ≈ 38% when compared to Spectral with
W
3
= {1,1,100, 1}.
CLOSER 2019 - 9th International Conference on Cloud Computing and Services Science
34

0
0.2
0.4
0.6
0.8
1
Obj
Span
Traffic
Latency
Storage
Balance
Normalized Evaluation Metrics
Random
Nearest
Hyper
Spectral
Overlap
Figure 6: Overlap results in reducing the storage cost
S(·) by ≈ 24% when compared to Spectral with W
4
=
{1,1,1, 100}.
rithm is efficient, scalable, and effective. Addition-
ally, since there is just one algorithm (unlike previ-
ous works) that can jointly solve the data and replica
placement problem, it offers a better and unified sys-
tem design. Further, the capability to adapt to the
change in weight vector settings W facilitates han-
dling of a variety of real-world scenarios as described
by different weight vectors.
6 CONCLUSIONS
In this paper, we addressed the problem of com-
bined data and replica placement of data-intensive
services into geo-distributed clouds. Although repli-
cation is an integral part of data placement, we iden-
tified that instead of posing it as a joint optimization
problem, most of the techniques in the literature have
treated them as independent problems, and have em-
ployed a two-phase approach: performing data place-
ment followed by replication. Consequently, a unified
paradigm, CPR, capable of combining data place-
ment and replication was devised, thereby enabling
the two problems to be studied in unison. Specifi-
cally, the proposed overlapping correlation clustering
algorithm on hypergraphs with its ability to partition
the set of data-items by assigning a data-item to mul-
tiple data centers facilitated this joint optimization.
Experiments on a real-world trace-based social net-
Table 2: Quantifying the performance of the considered
baselines relative to the proposed overlapping correlation
clustering algorithm on the evaluation metrics.
Algorithm
Degradation in performance of Baselines relative to Overlap
Span Traffic Latency Storage Obj
Random 377.78% 255.24% 510.87% 100.87% 274.68%
Nearest 106.29% 67.70% 160.50% 163.64% 139.69%
Hyper 50.91% 35.78% 51.85% 31.67% 37.98%
Spectral 35.26% 25.65% 37.69% 23.28% 24.66%
0
500
1000
1500
2000
2500
3000
3500
W
1
W
2
W
3
W
4
Running Time (in secs.)
Hyper
Spectral
Overlap
Figure 7: Comparing the execution times of the pro-
posed overlapping clustering algorithm with spectral clus-
tering(Atrey et al., 2018) and hypergraph partitioning algo-
rithm(Yu and Pan, 2017).
work dataset portrayed the effectiveness, efficiency,
and scalability of the proposed algorithm.
Currently, the proposed algorithm learns a data
and replica placement strategy from a historical snap-
shot of the social network trace. In the future, the fo-
cus would be to make CPR adaptive for managing up-
dates in the data (including changes to the data request
patterns) in an online manner, and dynamically updat-
ing the placement output. Additionally, the aim is to
generalize the notion of CPR to broader and generic
classes of the data placement problem.
ACKNOWLEDGMENTS
This research is partly funded by VLAIO, under grant
number 140055 (SBO Decomads).
REFERENCES
(2017a). AWS Global Infrastructure. https://aws.amazon.
com/about-aws/global-infrastructure/.
(2017b). Latency Between AWS Global Re-
gions. http://zhiguang.me/2016/05/10/
latency-between-aws-global-regions/.
(2017). SNAP Datasets. https://snap.stanford.edu/data/.
(2017). The Exponential Growth of Data.
https://insidebigdata.com/2017/02/16/
the-exponential-growth-of-data/.
(2018). Cisco Visual Networking Index: Fore-
cast and Trends (2017–2022). https:
//www.cisco.com/c/en/us/solutions/collateral/
service-provider/visual-networking-index-vni/
white-paper-c11-741490.html.
(2018). HDFS Architecture Guide. https://hadoop.apache.
org/docs/r1.2.1/hdfs design.html#References.
Unifying Data and Replica Placement for Data-intensive Services in Geographically Distributed Clouds
35

Agarwal, S., Dunagan, J., Jain, N., Saroiu, S., Wolman,
A., and Bhogan, H. (2010). Volley: Automated Data
Placement for Geo-distributed Cloud Services. In
NSDI.
Atrey, A., van Seghbroeck, G., Volckaert, B., and Turck,
F. D. (2018). Scalable data placement of data-
intensive services in geo-distributed clouds. In
CLOSER, pages 497–508.
Bonchi, F., Gionis, A., and Ukkonen, A. (2013). Overlap-
ping correlation clustering. Knowl. Inf. Syst., 35(1):1–
32.
Catalyurek, U. V. (2011). PaToH (Par-
titioning Tool for Hypergraphs).
http://bmi.osu.edu/umit/PaToH/manual.pdf.
Catalyurek, U. V., Boman, E. G., Devine, K. D.,
Bozdag, D., Heaphy, R., and Riesen, L. A. (2007).
Hypergraph-based Dynamic Load Balancing for
Adaptive Scientific Computations. In IPDPS, pages
1–11.
Chervenak, A., Deelman, E., Livny, M., Su, M., Schuler,
R., Bharathi, S., Mehta, G., and Vahi, K. (2007). Data
Placement for Scientific Applications in Distributed
Environments. In GRID.
Ding, Y. and Lu, Y. (2009). Automatic data placement and
replication in grids. In HiPC, pages 30–39.
Ebrahimi, M., Mohan, A., Kashlev, A., and Lu, S. (2015).
BDAP: A Big Data Placement Strategy for Cloud-
Based Scientific Workflows. In BigDataService,
pages 105–114.
Ferdaus, M. H., Murshed, M., Calheiros, R. N., and Buyya,
R. (2017). An algorithm for network and data-aware
placement of multi-tier applications in cloud data cen-
ters. JNCA, 98:65 – 83.
Golab, L., Hadjieleftheriou, M., Karloff, H., and Saha,
B. (2014). Distributed Data Placement to Minimize
Communication Costs via Graph Partitioning. In SS-
DBM, pages 1–12.
Grace, R. K. and Manimegalai, R. (2014). Dynamic replica
placement and selection strategies in data grids— A
comprehensive survey. JPDC, 74(2):2099 – 2108.
Guo, W. and Wang, X. (2013). A data placement strategy
based on genetic algorithm in cloud computing plat-
form. In WISA, pages 369–372.
Han, S., Kim, B., Han, J., K.Kim, and Song, J. (2017).
Adaptive Data Placement for Improving Performance
of Online Social Network Services in a Multicloud
Environment. In Scientific Programming, pages 1–17.
Huguenin, K., Kermarrec, A. M., Kloudas, K., and Ta
¨
ıani,
F. (2012). Content and Geographical Locality in User-
generated Content Sharing Systems. In NOSSDAV,
pages 77–82.
Jiao, L., Li, J., Du, W., and Fu, X. (2014). Multi-objective
data placement for multi-cloud socially aware ser-
vices. In INFOCOM, pages 28–36.
Kosar, T. and Livny, M. (2004). Stork: making data place-
ment a first class citizen in the grid. In ICDCS, pages
342–349.
Kosar, T. and Livny, M. (2005). A framework for reliable
and efficient data placement in distributed computing
systems. JPDC, 65(10):1146–1157.
Li, X., Zhang, L., Wu, Y., Liu, X., Zhu, E., Yi, H., Wang, F.,
Zhang, C., and Yang, Y. (2017). A Novel Workflow-
Level Data Placement Strategy for Data-Sharing Sci-
entific Cloud Workflows. IEEE TSC, PP(99):1–14.
Liu, X. and Datta, A. (2011). Towards Intelligent Data
Placement for Scientific Workflows in Collaborative
Cloud Environment. In IPDPSW, pages 1052–1061.
Nishtala, R., Fugal, H., Grimm, S., Kwiatkowski, M., Lee,
H., Li, H. C., McElroy, R., Paleczny, M., Peek, D.,
Saab, P., Stafford, D., Tung, T., and Venkataramani,
V. (2013). Scaling Memcache at Facebook. In NSDI,
pages 385–398.
Rochman, Y., Levy, H., and Brosh, E. (2013). Re-
source placement and assignment in distributed net-
work topologies. In INFOCOM, pages 1914–1922.
Shabeera, T., Kumar, S. M., Salam, S. M., and Krishnan,
K. M. (2017). Optimizing vm allocation and data
placement for data-intensive applications in cloud us-
ing aco metaheuristic algorithm. IJEST, 20(2):616 –
628.
Shankaranarayanan, P. N., Sivakumar, A., Rao, S., and
Tawarmalani, M. (2014). Performance Sensitive
Replication in Geo-distributed Cloud Datastores. In
DSN, pages 240–251.
White, T. (2012). Hadoop: The Definitive Guide. O’Reilly
Media, Inc.
Yu, B. and Pan, J. (2015). Location-aware associated data
placement for geo-distributed data-intensive applica-
tions. In INFOCOM, pages 603–611.
Yu, B. and Pan, J. (2016). Sketch-based data placement
among geo-distributed datacenters for cloud storages.
In INFOCOM, pages 1–9.
Yu, B. and Pan, J. (2017). A Framework of Hypergraph-
based Data Placement among Geo-distributed Data-
centers. IEEE TSC, PP(99):1–14.
Yu, T., Qiu, J., Reinwald, B., Zhi, L., Wang, Q., and Wang,
N. (2012). Intelligent database placement in cloud en-
vironment. In ICWS, pages 544–551.
Yuan, D., Yang, Y., Liu, X., and Chen, J. (2010). A
data placement strategy in scientific cloud workflows.
FGCS, 26(8):1200 – 1214.
Zaharia, M., Xin, R. S., Wendell, P., Das, T., Armbrust,
M., Dave, A., Meng, X., Rosen, J., Venkataraman, S.,
Franklin, M. J., Ghodsi, A., Gonzalez, J., Shenker, S.,
and Stoica, I. (2016). Apache spark: A unified engine
for big data processing. CACM, 59(11):56–65.
Zhang, J., Chen, J., Luo, J., and Song, A. (2016). Effi-
cient location-aware data placement for data-intensive
applications in geo-distributed scientific data centers.
Tsinghua Science and Technology, 21(5):471–481.
Zhao, Q., Xiong, C., and Wang, P. (2016a). Heuristic data
placement for data-intensive applications in heteroge-
neous cloud. Journal of Electrical and Computer En-
gineering, 2016:1–8.
Zhao, Q., Xiong, C., Zhang, K., Yue, Y., and Yang, J.
(2016b). A data placement algorithm for data inten-
sive applications in cloud. JGDC, 9(2):145–156.
CLOSER 2019 - 9th International Conference on Cloud Computing and Services Science
36
