
Inter-observer Reliability in Computer-aided Diagnosis of Diabetic
Retinopathy
Jo
˜
ao Gonc¸alves, Teresa Conceic¸
˜
ao and Filipe Soares
Fraunhofer Portugal AICOS, Rua Alfredo Allen 455/461, 4200-135 Porto, Portugal
Keywords:
Convolution Neural Networks, Feature-based Machine Learning, Inter-observer Reliability, Diabetic
Retinopathy.
Abstract:
The rapid growth of digital data in healthcare demands medical image analysis to be faster, precise and, at
the same time, decentralized. Deep Learning (DL) fits well in this scenario, as there is an enormous data
to sift through. Diabetic Retinopathy (DR) is one of the leading causes of blindness that can be avoided if
detected in early stages. In this paper, we aim to compare the agreement of different machine learning models
against the performance of highly trained ophthalmologists (human graders). Overall results show that transfer
learning in the renowned CNNs has a strong agreement even in different datasets. This work also presents an
objective comparison between classical feature-based approaches and DL for DR classification, specifically,
the interpretability of these approaches. The results show that Inception-V3 CNN was indeed the best-tested
model across all the performance metrics in distinct datasets, but with lack of interpretability. In particular,
this model reaches the accuracy of 89% on the EyePACS dataset.
1 INTRODUCTION
The global report of world health organization states
that the number of people with diabetes has risen from
108 million in 1980 to 422 million in 2014. The
top 10 list of mortality causes includes more than
half of global deaths (54%), and diabetes holds out
as the seventh position, having a strong correlation
with the first two leading cause of deaths reported
in 2016 as well (World Health Organization et al.,
2014). The estimated global prevalence of referable
diabetic retinopathy (DR) among patients with dia-
betes is 35.4%, and 2.6% of global blindness can be
attributed to diabetes (Bourne et al., 2013).
Along these lines, DR is rapidly emerging as a
global health issue that may threat patients’ visual
acuity and visual functioning if untreated. Timely
identification and referral for treatment are essen-
tial to reduce disease complications associated with
vascular abnormalities, whose diagnosis requires eye
retina examination. This will cause a high demand
for primary evaluation and detection of the different
stages of DR in order to prevent it from evolving
to more complicated conditions and avoid treatment
costs later stages.
The major obstacle to the implementation of more
widespread screenings programs is the number of
clinicians qualified for interpreting the retinal fun-
dus images. This problem demands decentralization
in the screening programs which can be achieved
through the use of novel and portable instruments,
such as smartphone solutions for fundus imaging.
The smartphone itself can run a machine learning al-
gorithm to measure the patient’s likelihood for DR
referable stages. These algorithms are an important
tool that can make valid decisions when it comes to
reducing inefficiencies in healthcare workflows. Deep
Learning (DL) shows remarkable results in the image
classification task of DR detection (higher than 90%
(Gulshan et al., 2016) sensitivity and specificity). In
addition to that can be deployed in the smartphone
with device attachments and respective applications.
The aim of this study is to compare the relia-
bility of machine learning approaches with the per-
formance of highly trained ophthalmologists (human
grade). Furthermore, the effectiveness and capabil-
ity of machine learning, both classical feature-based
and based on DL, have been studied for the classifica-
tion of DR. The transfer learning technique is applied
in differents pre-trained state of the art CNN designs
(Inception-V3 and Densenet-121) and trained again in
EyePACS and Messidor datasets. Finally, the impor-
tance of interpretability for medical imaging is dis-
cussed in the last subsection of Results.
Gonçalves, J., Conceição, T. and Soares, F.
Inter-observer Reliability in Computer-aided Diagnosis of Diabetic Retinopathy.
DOI: 10.5220/0007580904810491
In Proceedings of the 12th International Joint Conference on Biomedical Engineering Systems and Technologies (BIOSTEC 2019), pages 481-491
ISBN: 978-989-758-353-7
Copyright
c
2019 by SCITEPRESS – Science and Technology Publications, Lda. All rights reserved
481

2 RECENT RELATED WORK
Historically, much of the work in literature related
to image classification and detection of DR has sig-
nificantly been focused on classical feature-based
machine learning (FbML) approaches such as kNN
and SVM (Mookiah et al., 2013). These incorpo-
rate meticulous image pre-processing steps as well
as complex feature extraction which, in its sense, try
to mimic the manual analysis made by experts on
retinal changes and lesions such as microaneurysms
(MA), hemorrhages, hard and soft exudates, neovas-
cularization and so on. In order to do so, methods are
usually designed to compute explicit features previ-
ously defined by experts. If the extracted features are
relevant and unique, then a simple decision system
method can show remarkable results detecting very
specific lesions or predicting the presence or absence
of DR. The downside of these approaches is building
and maintaining complex feature extraction pipelines.
The applied computer vision algorithms require accu-
rate calibration and are usually prone to errors given
image variability or quality factors thus impacting the
final accuracy of the classification model.
Recent studies have reported that DL approaches,
mainly CNN, outperform the classical hand-designed
algorithms for imaging classification. These networks
can drop the occasionally erratic pre-processing steps
and are able to cope with image variability through
data augmentation methods. Furthermore, CNN is
not designed to identify specific features and there-
fore, they may actually learn visual elements and as-
sociations that are imperceptible to the human eye.
Nevertheless, DL algorithms are extremely data and
resource hungry, demanding huge annotated datasets
and access to a lot of processing power which may not
always come in hand. Additionally, the lack of inter-
pretability in DL models, which are still understood
as “black-boxes”, also presents a major drawback to
its real-world implementation.
One of the most pertinent articles in the area of
DL applied to detection of DR is the original inves-
tigation by (Gulshan et al., 2016). This study as-
sesses the sensitivity and specificity of DL models
to detect DR in images from table-top fundus cam-
eras through a CNN. The model was trained and vali-
dated with 118,419 fundus images from the EyePACS
dataset and evaluated in two datasets: EyePACS 1
(8788 fundus images); and the Messidor 2 (1745 fun-
dus images). The specific neural network used was
Inception-V3 architecture, but no details about fine-
tuning parameters or the pre-processing steps beyond
black borders trimming and image resizing were pro-
vided. The performance achieved an area under the
receiver operating characteristics curve (AUC) of 0.99
for referable DR in both datasets.
Lam et al. propose an automatic DR analysis al-
gorithm based on two-stage DL algorithm (Lam et al.,
2018). Firstly, a local network is trained to classify
regions of images into four classes. Secondly, the
deeper global network is fed with the weight lesion
map previously computed. In this way, the global net-
work pays more attention to the regions with lesions.
The disadvantage of this approach is the arduous task
of annotating and labeling all the images regions.
Krause et al. published a study about the impor-
tance of agreement between different graders (Krause
et al., 2017). The quadratic-weight kappa score
was measured between different graders and between
graders and the algorithm. The results show that the
majority decision of the 3 ophthalmologists yielded a
higher agreement (kappa score 0.87) than individual
ophthalmologists alone (kappa score range from 0.80
to 0.84). The 3 retinal specialists also had a kappa
score higher than the ophthalmologists range from
0.82 to 0.91). The common source of disagreement
was image artifacts that resemble typical pathologies
such as MAs. Raumviboonsuk et al. describe agree-
ment values in referable DR of 0.63, 0.24, 0.28 for
retina specialists, general ophthalmologists and all
readers respectively (Raumviboonsuk et al., 2018).
Arianti et al. report an agreement value of 0.64 for
the interpretation of fundus images between one non-
physician ophthalmic and one retina specialist (Ari-
anti and Andayani, 2016).
Regarding DL interpretability, Poplin et al. goes
beyond predicting DR on retinal fundus images and
assess cardiovascular risk factors via DL (Poplin
et al., 2018). The evidence is provided, using atten-
tion maps, that DL may uncover additional signals in
retinal fundus images that will allow for better cardio-
vascular risk stratification.
Some previous comparison work with regard to
medical imaging has been made. (Wang et al.,
2017) stated that CNN’s performance was not sig-
nificantly different from other feature-based methods
when classifying mediastinal lymph node metastasis
of lung cancer from PET/CT images, although being
more objective and convenient since no visual seg-
mentation or feature extraction was needed. A CNN
slightly outperforms an ensemble of bagged trees (50
trees) and a multilayer perceptron with respect to
ECG signal images in (Andreotti et al., 2017) and the
hand-engineered features from the signals showed to
be heavily influenced by the choice of pre-processing
steps.
For the specific case of DR classification, a com-
parison between an SVM and a CNN on the classifi-
HEALTHINF 2019 - 12th International Conference on Health Informatics
482
cation of different stage levels is performed by (Kelly,
2017). The authors conclude that the SVMs is more
limited in both accuracy and data handling. Firstly, it
could not handle the use of a large number of samples
(only 3000 images from the EyePACS dataset could
be fed to the model in contrast with the 55’000 used in
the CNN). Moreover, the SVM was also more sensi-
tive to class imbalance and perform badly in recogniz-
ing different severity levels, being more appropriate
for the binary classification case (distinguish between
class 0 and the others).
The majority state of the art report an increase in
the performance when using DL but don’t particularly
implement any clear or fair comparison methodology.
Therefore, in this work, we aim to perform a more
practical and objective comparison between classical
Machine Learning approaches and CNN on the DR
classification based on performance metrics as well
as model interpretability.
Machine Learning interpretability is an emerging
research topic, crucial to close the gap between en-
gineering and medicine. A really accurate model
in terms of performance does not necessarily mean
that it will be better engaged by medical experts. In
fact, medical experts tend to prefer the classical ap-
proaches given its similarity to human logic and rea-
soning, thus being more understandable and trustwor-
thy. Along these lines, it is still unclear that DL mod-
els are indeed a better approach to solve the computer-
aided medical diagnosis problem.
3 METHODS
Two datasets were used in this study: one provided
by Kaggle, containing over 80.000 images from the
EyePACS dataset, graded into one of five classes (no
DR, Mild, Moderate, Severe, Proliferative DR) by
one clinician (there are several experts involved in
the grading process but each image is only graded by
one); and the publicly available Messidor dataset with
1200 images, whose ground truth considers four dif-
ferent stages of DR (R0, R1, R2, R3). This dataset
was mainly used for testing the performance and
agreement between machine learning models.
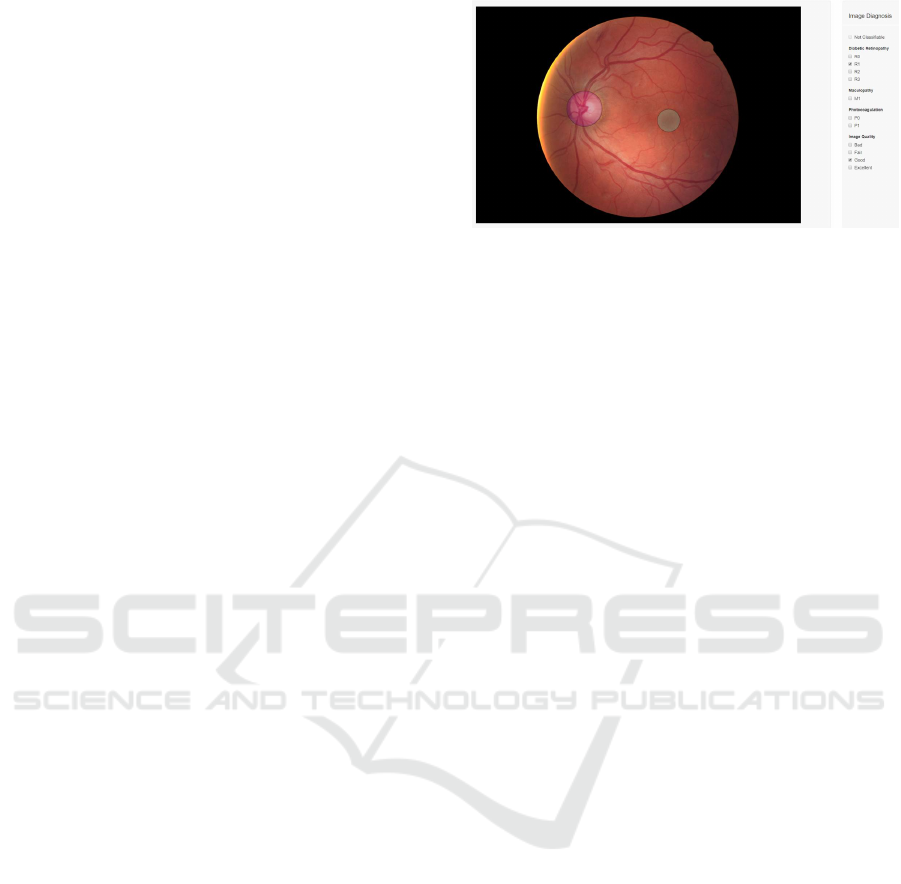
From the EyePACS dataset, we randomly extract
350 images and the remaining dataset is split 65% for
train and 35% for validation. The 350 images were
graded by two licensed ophthalmologists using a de-
veloped annotation tool (Figure 1) and later provided
as the test set. After the grading process, we remove
24 images from the original 350 since both observers
considered not classifiable (R
ˆ
ego et al., 2018). The
ground truth for this test set is the statistical mode be-
Figure 1: The annotation tool developed.
tween the two observers and the original label of the
EyePACS dataset for the DR diagnosis. Since we only
have 3 observations (including the original label) for
each image, generating a ground truth for the several
stages of DR would be less valid considering the size
of the test dataset. Therefore, although we train all
models with the original multiclass labels, the results
are later reported and analyzed as binary (0: no DR,
1: Mild, Moderate, Severe and Proliferative).
In our experiments, the metrics used in the valida-
tion of the training process are the quadratic-weight
kappa and F1 score for the five classes. The F1 score
is a commonly used metric in information retrieval
for classifiers evaluation that measures the balancing
between precision and recall.
The quadratic-weight kappa (k) evaluates the
inter-observer agreement. The calculated value is ob-
tained using the formula provided by (Fleiss et al.,
1969) for more than two classes.
Since the dataset is considerably imbalanced, the
kappa metric is employed to considering the size of
the five classes (marginal distribution of the response
variable) and avoiding over-optimistic scores of accu-
racy and F1 score. In other words, it assesses how
better is the classifier compared to a random guess of
that class.
3.1 Feature-based Machine Learning
Contrarily to DL methods where manual image pre-
processing and feature extraction techniques are prac-
tically non-existent, FbML approaches entail meticu-
lous computer vision techniques to extract relevant in-
formation from the images and feed the classification
algorithm with proper values.
Specific guidelines concerning several retinal le-
sions and transformations are followed by medical ex-
perts in the diagnosis and distinction between the dif-
ferent levels of DR severity. Among them, we identify
microaneurysms (MA), Exudates and Vessels Area as
some of the most relevant features that can also be
good candidates for learning features. Based on pre-
Inter-observer Reliability in Computer-aided Diagnosis of Diabetic Retinopathy
483

vious work by (Costa et al., 2016) and (Felgueiras
et al., 2016) we build a pipeline for extraction of the
number of microaneurysms, exudates area and vessels
area from each dataset image and feed a classification
algorithm with the extracted metrics. A number of
previous works in the area also take into considera-
tion other features such as color, texture and geomet-
ric features but we argue that this complexity increase
may come at a cost of lower interpretability (espe-
cially for the clinicians), so we keep things as simpler
as possible while maintaining its relevance.
Next, following the contribution of (Feurer et al.,
2015), we used a framework for learning pipeline
optimization to jointly choose the best classification
pipeline including data and feature pre-processing
methods as well as classifier choice and respec-
tive hyper-parameters. The best pipeline was cho-
sen individually for each dataset, based on a 1-hour
search, optimizing the F1-weighted performance met-
ric through cross-validation (CV) (Messidor dataset)
or holdout-set technique (EyePACS dataset). A dif-
ferent validation strategy was used given the signifi-
cantly different dataset sizes. A smaller dataset (Mes-
sidor) will be more likely to overfit if the validation
is done using a single holdout set. On the other hand,
a CV strategy increases the time needed for each al-
gorithm try, therefore, for a very large dataset (Eye-
PACS) more algorithms are tested and better results
are expected.
The best pipeline model extracted by the opti-
mization for the Messidor dataset employs an SVM
with a 4th-degree polynomial kernel and parameters
C = 4201.84 and gamma = 0.124. For EyePACS, the
chosen classifier is a Random Forest composed of 100
Decision Trees. Both of them are preceded by a pre-
processing step that by using quantiles information,
transforms features data into a uniform and normal
distribution respectively. Here, we define ’best’ as be-
ing the model with the greater F1 score, since it is a
particular balanced metric for measuring the perfor-
mance, taking into consideration both sensibility and
specificity.
As our main purpose is to compare FbML results
with the DL architectures, the same train and test data
splits were used for both. The FbML methodology is
illustrated in Figure 2.
3.2 Convolutional Neural Networks
DL algorithms, in particular, the CNN, have rapidly
become a methodology of choice for analyzing med-
ical images. The main advantage is learning the
features directly from raw data without the help of
any human expert for feature engineering, changing
the analytic model from features engineering to data-
driven feature construction.
CNNs are surprisingly effective at image classi-
fication. Typically, the convolution layers (a filter
that slides over the image) connect multiple local fil-
ters with their input data (raw data or the output of
previous layers) and learn the invariant local features
transformations, then, the pooling layers gradually re-
duce the output size to avoid and minimize overfit-
ting. Finally, activation functions introduce the non-
linearity aspect in the hidden layers kernels. These
processes are locally performed such that the image
features representation in one region will not influ-
ence the other regions. The concatenation of these
feature-maps learned by different layers improves the
variation in the input of the subsequent layers and in-
creases the efficiency of the network.
Szegedy et al. introduced the Inception-V1 archi-
tecture implementation (Szegedy et al., 2015) in the
winning solution of ImageNet benchmark ILSVRC
2014 (Russakovsky et al., 2015). The next itera-
tions of the architecture (Szegedy et al., 2016) show
that kernels size larger than 3x3 can be efficiently
computed with a series of smaller convolutions, and
that additional regularization with batch normaliza-
tion provides faster training by reducing the internal
covariate shift (Ioffe and Szegedy, 2015). With these
developments, it exceeded its predecessor on the Im-
ageNet benchmark.
Dense CNNs (Huang et al., 2016) connect each
layer directly to subsequent layers in a feed-forward
fashion, exploiting the potential of the network
through the features reuse. Since this type of archi-
tectures uses less feature concatenation, the network
has low efficiency in terms of memory and speed
(quadratic memory with respect to the depth of net-
work).The crucial part in Inception-V3 (and many
others CNNs) is the usage of the down-sampling
(pooling) layers to reduce the size of the feature maps
parameters. To accelerate this process, the dense net-
work is split into multiple connected dense blocks.
The layers that are in between these blocks are trans-
action layers, which are designed to do 1x1 convolu-
tion with 128 filters, followed by 2x2 pooling layers.
Compared to the inception architecture, Densenet re-
quires fewer parameters, as there is no need to learn
redundant features maps. Instead, each layer adds
new features. The Densenet architecture used was
Densenet-121, a network with 121 number of train-
able layers in dense blocks.
Additionally, to test the superiority of state of art
models architectures we create a simple sequential
CNN illustrated in Figure 3 for the same classifica-
tion. The proposed CNN has similar to the architec-
HEALTHINF 2019 - 12th International Conference on Health Informatics
484
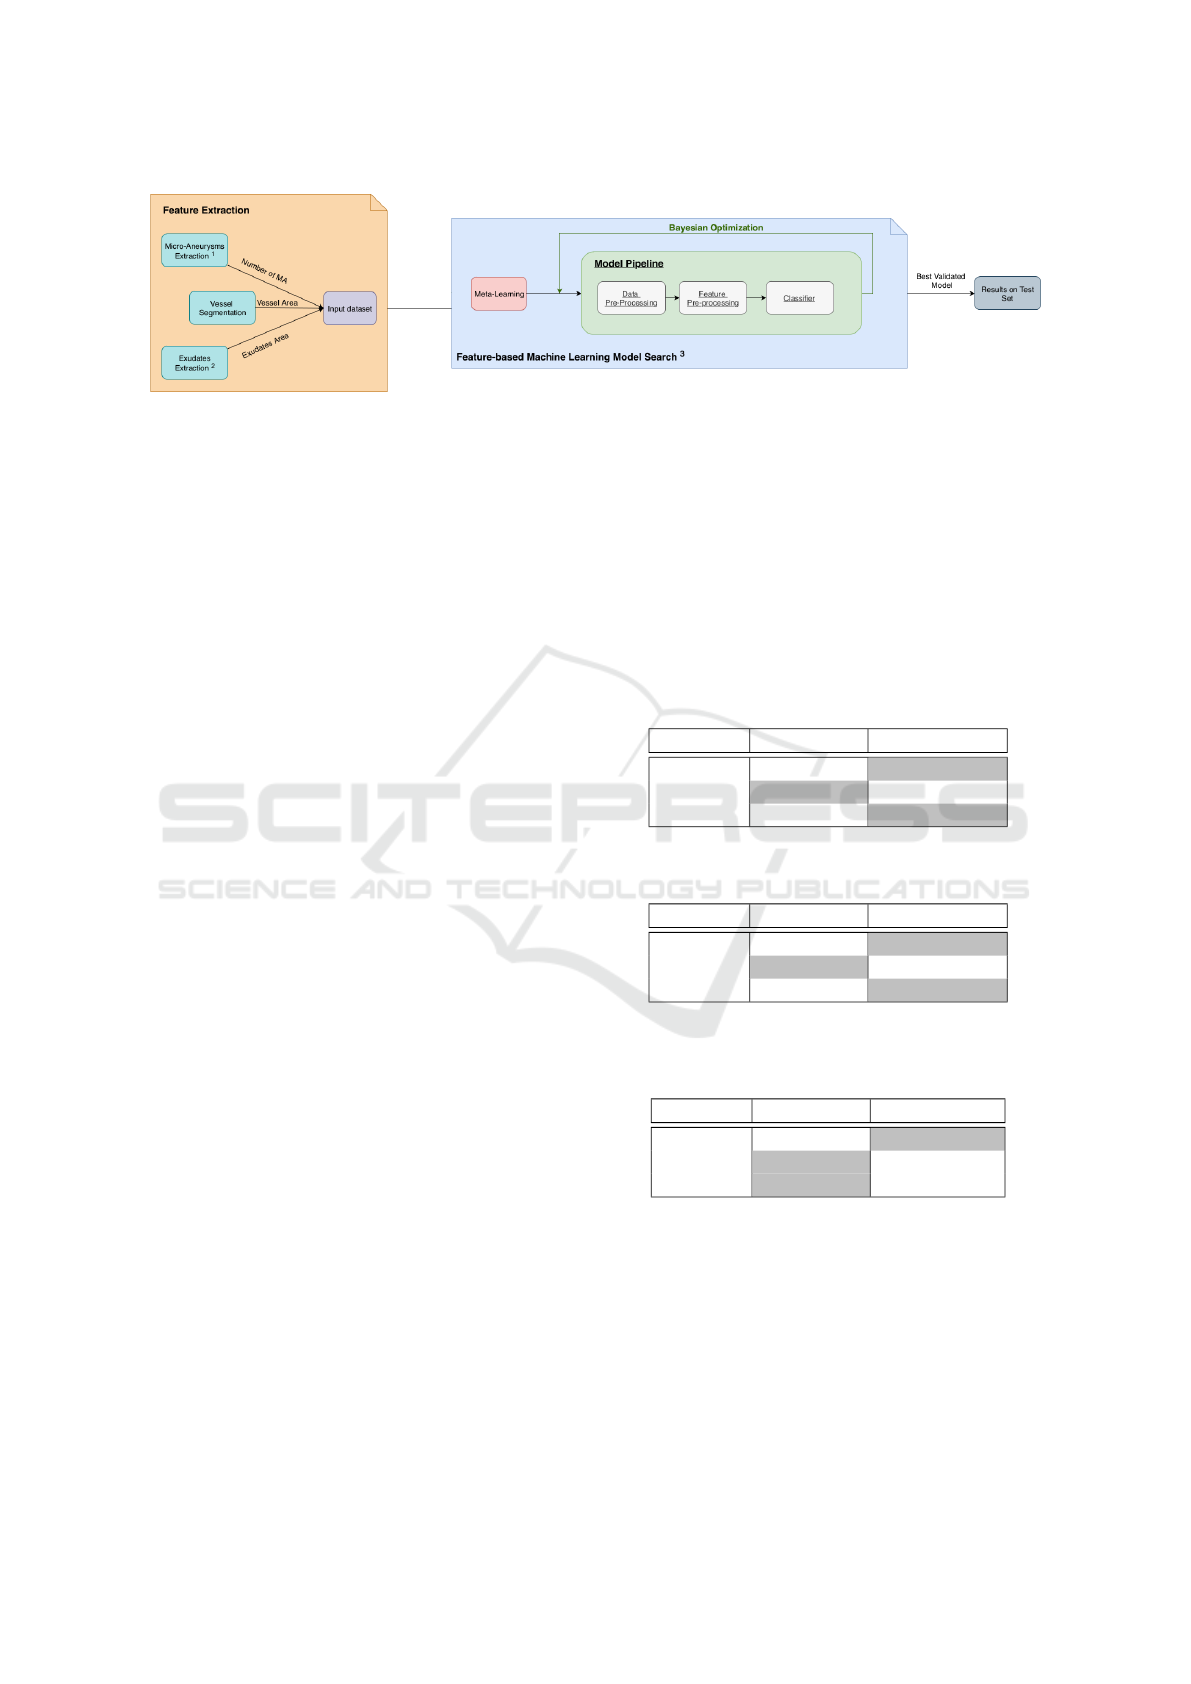
Figure 2: FbML Methodology.
1
Extraction from (Costa et al., 2016);
2
Extraction from (Felgueiras et al., 2016);
3
Optimiza-
tion Framework (Feurer et al., 2015).
ture that LeCun and Bengio (LeCun et al., 1995) used
for image classification. The notable change was the
introduction of a batch normalization layer after the
convolution layers and an increase in the depth of the
network (number of layers).
When trained from scratch, deep neural networks
must learn all the basic filters (edges and corners)
as well as the complex ones (colors, textures or ge-
ometry for example). Since we use previously com-
puted weights from the ImageNet dataset classifica-
tion (Russakovsky et al., 2015), the network already
has these pre-computed filters. Using the strategy of
transfer learning and fine-tuning, filters will be ad-
justed to a new type of image and problem. The DL
framework keras (Chollet et al., 2015) was used with
the tensorflow (Abadi et al., 2016) machine learn-
ing back-end on a high-end Nvidia GPU Tesla V100
through a docker container.
Before feeding the images to the DL models, we
minimize the required pre-processing steps in order
to retain small details and intricate features. Trim
of black borders, image resize (to 3x512x512) and
normalization between [-1,1] are employed. Data
augmentation techniques, including rotation, flips,
brightness and contrast enhancement, are also applied
to the train data to increase class diversity.
Re-training the models architecture with the fun-
dus images is done by fine-tuning across all lay-
ers, replacing the top layers with one average pool-
ing layer, a layer for 50% dropout of connections,
a fully connected layer and another layer for 25%
dropout. Finally, a softmax layer is added allowing
to divide the classification into 5 classes. All models
are trained with cross-entropy as loss function and us-
ing the Adam optimizer (Kingma and Ba, 2014) with
a 1e-4 learning rate. The training process is stopped
when the performance on validation images cease to
improve. Inception-V3 was stopped after 12 epoch’s
with a batch size of 24. The Densenet-121 is trained
with a smaller batch size of 12 due to the model de-
sign memory constraints and was stopped after 28
epochs. Our simple sequential CNN uses a batch size
of 24 and the training terminated after 27 epochs.
4 RESULTS AND DISCUSSION
The CNN models evaluation results on the 326 (350
minus 24) never seen before images are summarized
in Tables 1, 2 and 3.
Table 1: Results of Inception-V3 on EyePACS test set.
One Grader Three Graders
Accuracy 0,891 0,929
Precision 0,918 0,759
F1 score 0,746 0,780
Table 2: Results of Densenet-121 on EyePACS test set.
One Grader Three Graders
Accuracy 0,885 0,950
Precision 0,962 0,857
F1 score 0,718 0,840
Table 3: Results of Simple Sequential CNN on EyePACS
test set.
One Grader Three graders
Accuracy 0,665 0,730
Precision 0,360 0,277
F1 score 0,380 0,343
The F1 score ranged from 72% to 75% for the one
grader case and from 78% to 84% using three graders
in the state of art CNN models whereas the simple se-
quential CNN achieved 38% for one grader and 34%
for the three graders. However the F1 score do not
take account the true negatives into account.
Inter-observer Reliability in Computer-aided Diagnosis of Diabetic Retinopathy
485
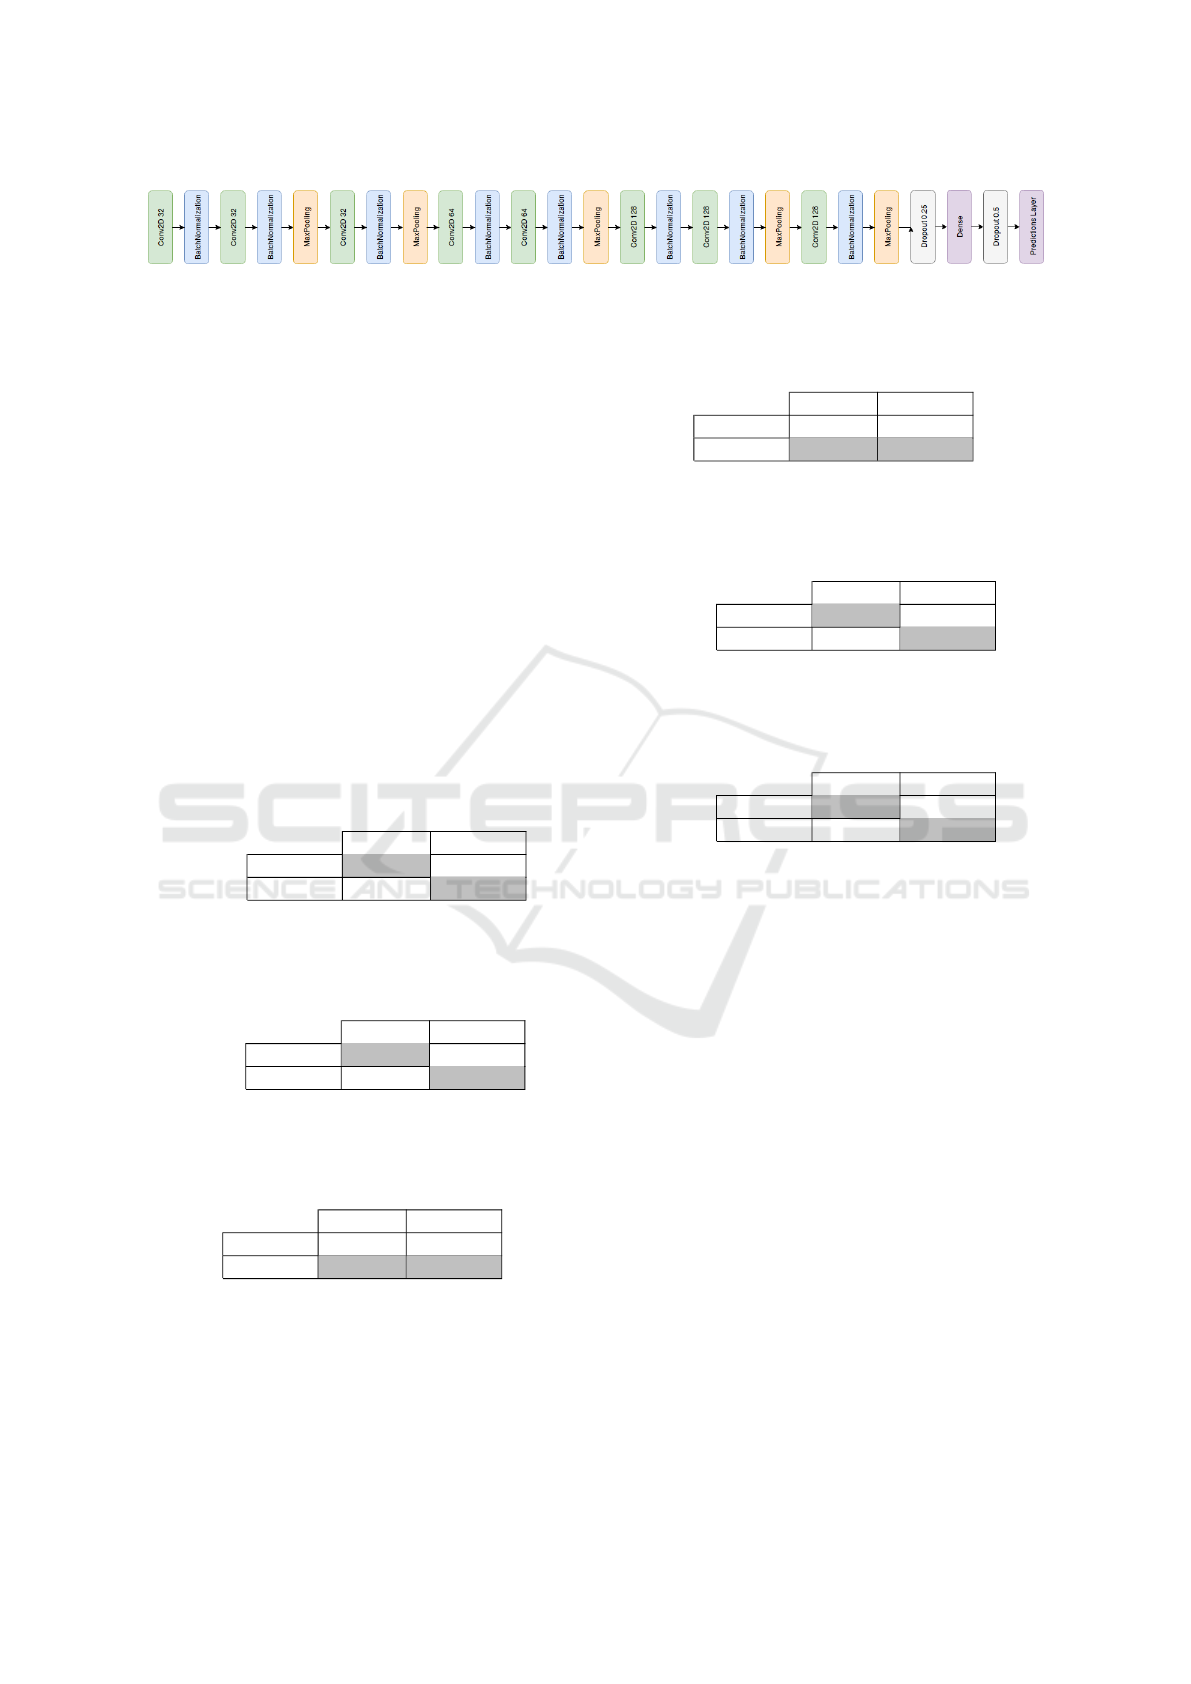
Figure 3: Simple sequential CNN.
4.1 Machine Learning and Experts
Agreement
The key evaluation task is to quantitatively assess
the agreement between human graders and machine
learning solutions, from the test of extracted 350 Eye-
PACS images set.
The agreement between observers varies greatly
between studies (R
ˆ
ego et al., 2018; Krause et al.,
2017; Raumviboonsuk et al., 2018; Arianti and An-
dayani, 2016) having agreements between weak and
moderate. This can be explained by the experience of
the graders at some extent, the image quality or even
the classification guidelines in use.
To get key insights into this agreement measure,
we further compare the human graders with the ma-
chine learning algorithms, summarized in the tables
4,5,6,7, 8 and 9.
Table 4: Results on EyePACS test set. Agreement between
graders and Inception-V3.
Human graders
Positive Negative Total
Inception
Positive 41 13 54
Negative 10 262 272
Total 51 275 326
Table 5: Results on EyePACS test set. Agreement between
graders and Densenet-121.
Human graders
Positive Negative Total
Densenet
Positive 42 7 49
Negative 9 268 277
Total 51 275 326
Table 6: Results on EyePACS test set. Agreement between
graders and simple sequential CNN.
Human graders
Positive Negative Total
sCNN
Positive 23 60 83
Negative 28 215 243
Total 51 275 326
Calculated agreements between the ground truth
and Inception-V3 (Table 4), Densenet-121 (Table 5)
and the simple sequential CNN (Table 6) were respec-
tively k = 0.739, k = 0.811 and k = 0.185.
Feature-based machine learning (Table 7)
achieved a bigger agreement with the ground truth
Table 7: Results on EyePACS test set. Agreement between
graders and our feature-based machine learning.
Human graders
Positive Negative Total
FbML
Positive 9 5 14
Negative 42 270 312
Total 51 275 326
Table 8: Results on EyePACS test set. Agreement between
Inception-V3 and Densenet-121.
Inception-V3
Positive Negative Total
Densenet
Positive 45 9 54
Negative 4 268 272
Total 49 277 326
Table 9: Results on Messidor. Agreement between
Inception-V3 and Densenet-121.
Inception-V3
Positive Negative Total
Densenet
Positive 475 103 578
Negative 18 604 622
Total 493 707 1200
than the sequential CNN but far from the state of art
architectures with k = 0.224.
The two best CNN approaches, Inception-V3 and
Densenet-121, obtained a moderate to strong paired
agreement, with k = 0.85 on the EyePACS dataset
(Table 8) and k = 0.797 on the Messidor dataset (Ta-
ble 9). The kappa score values were interpreted ac-
cording to McHugh (McHugh, 2012) as: k < 0 no
agreement; k ∈ [0, 0.2] none; k ∈ [0.21, 0.39] mini-
mal; k ∈ [0.4, 0.59] weak; k ∈ [0.6, 0.79] moderate;
k ∈ [0.8, 0.9] strong; k ∈ [0.91, 0.99] almost perfect
agreement; and k = 1 perfect agreement.
4.2 FbML and CNN Comparison
In addition to the evaluation of inter-observer relia-
bility, we aim to explore and compare different types
of Machine Learning on the classification of DR and
the impact of distinct dataset characteristics on their
performance.
Table 10, summarize the models with best perfor-
mance, on both EyePACS and Messidor datasets for
each type of Machine Learning model. As we did not
acquired annotated data for the Messidor dataset, only
HEALTHINF 2019 - 12th International Conference on Health Informatics
486

Table 10: Overall performance comparison between
Feature-based Machine Learning (FbML) and Convolu-
tional Neural Networks (Inception-V3 CNN) on Messidor
and EyePACS datasets, with ground-truth formed by one
grader.
Messidor EyePACS
FbML CNN FbML CNN
Sensitivity 0.771 0.785 0.120 0.629
Specificity 0.725 0.849 0.980 0.980
Accuracy 0.750 0.816 0.766 0.891
Precision 0.771 0.849 0.733 0.918
F1 score 0.771 0.816 0.211 0.746
the results for one grader ground-truth are depicted.
In general the CNN approach performed much
better than FbML. The Inception-V3 CNN was in-
deed the best tested model across all the performance
metrics. This is consistent in both datasets, suggesting
that the CNN’s predictions could generalize similarly
to other datasets of retinal fundus images.
A second aspect is the major influence of the type
of dataset on the performance of each machine learn-
ing model. In Messidor, a smaller dataset with bet-
ter quality and less image variability, the results were
consistently even for both FbML and DL. On the
other hand, training and testing the EyePACS dataset
presented good results with CNN (inline with most
state of art) and outperforming the results in Messi-
dor. Nonetheless, its performance degraded substan-
tially when using FbML. Not only has EyePACS a
much larger number of samples but also a lot more
variability in terms of quality (some of the images
cannot even be considered classificable). The results
suggest that DL networks benefit greatly from this,
however, FbML models, given its lower complexity,
do not seem to handle well the amount of information
neither its non linearities.
Another important factor to notice is that due to
the imbalanced dataset, FbML on EyePACS is ex-
tremely biased for the negative class (very high speci-
ficity and a very low sensitivity), which does not oc-
cur in the Messidor case.
Finally, one should also point out that the com-
puter vision feature-extraction methods can also be a
considerable bottleneck due to their extreme sensitiv-
ity to image variability, also contributing to a much
less discriminative model. Computer Vision algo-
rithms usually require attentive and tedius calibration
for each specific dataset and depending on the sample
size and image resolution, the whole extraction pro-
cess can take a long time.
Concluding, regarding dataset size, the FbML
pipeline have the advantage of not requiring much
data to produce reasonable results, however they can
fail to generalize to different types of data or to
unwanted perturbations. In particular, the feature-
extraction component needs to be manually and min-
uciously tuned. DL requires much more training time,
but it scales much better to large datasets, having
more generalization and adaptability power. In the
presence of a lot of data, one can simply apply the
same DL pipeline and expect similar results without
need for manual tuning.
4.2.1 Interpretability
Despite the encouraging results of DL, there is still a
lack of transparency on how the predictions are be-
ing made and on its behavior and internal operation.
Why did the model made this decision? How much
did each feature or image region contributed to the fi-
nal outcome? Even though we might understand the
algorithms, most of the times, reasoning the model
behaviour is still uncertain. These informations are
even more crucial for clinical applications in order to
make sure no wrong diagnosis are made and decide
upon the best treatment strategy.
Regarding classical machine learning approaches,
their interpretability depends on the actual chosen
classifier and its degree of complexity as well as the
data dimensionality. However, in general, methods to
understand the overall model, such as computing fea-
ture importances or decision boundaries, as well as
instance-wise methods like extracting prediction con-
fidence level or prediction paths can be employed. For
example, Figure 4 shows the decision boundary be-
tween two of the features of the SVM classifier ap-
plied on the Messidor dataset. By analysing the fig-
ure, we can intuitively note that for the plotted range
of Vessel Areas our estimator tends to classify in-
stances with less than 5 microaneurysms as healthy
eyes. Furthermore, the higher number of positive
classes (orange triangles) that fall into the negative
area (blue) indicate that further tuning should be done
as the decision boundary is not perfectly fited to the
data. The same behaviour is observed when differen-
tiating between severity levels of DR (Figure 5). We
notice that almost all of healthy instances (No DR)
are correctly placed in the blue area as well as the
most severe level (3) in the red one. Differences in
the other levels do not seem to be correctly fited by the
classifier as a significant number of green and orange
markers are not assigned to their own color area. This
visually demonstrates that although properly distin-
guishing between healthy and non-heatlhy eyes, the
model fails at discriminating between different stages
of the disease.
As far as DL classifiers is concerned, one of the
reasons for building more and more complex models
Inter-observer Reliability in Computer-aided Diagnosis of Diabetic Retinopathy
487
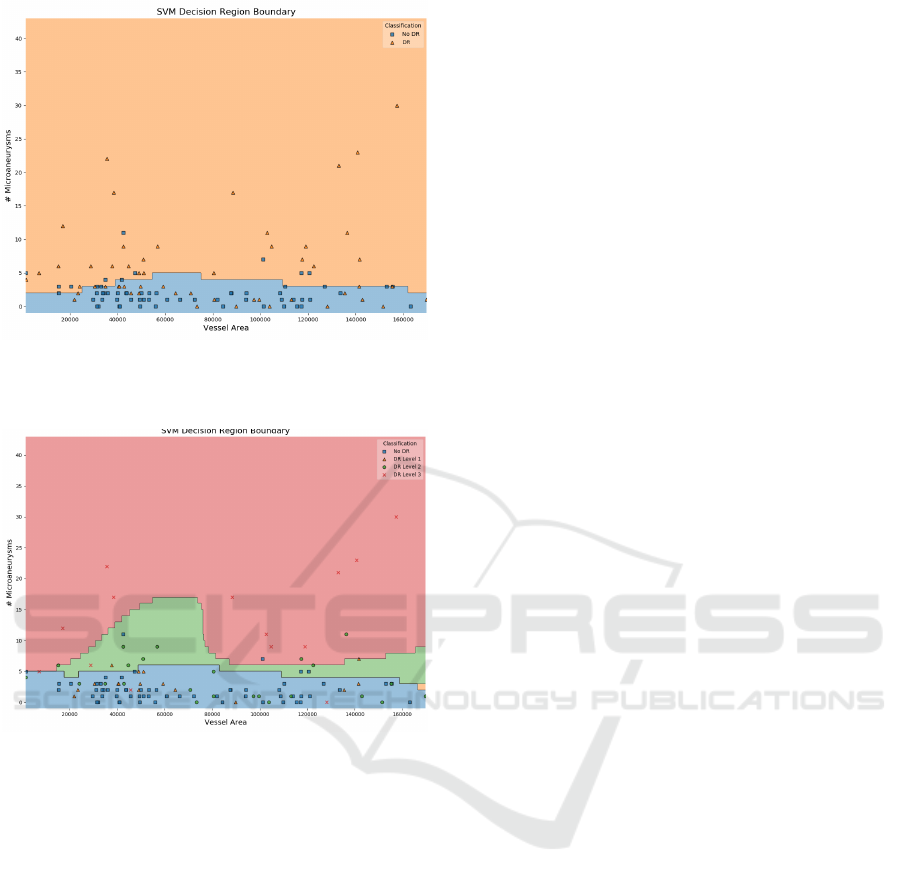
Figure 4: SVM Decision Boundary of Messidor Pipeline
Model between two of the extracted features: Vessel Area
and Number of Microaneurysms.
Figure 5: SVM Decision Boundary of Messidor Pipeline
Model between two of the extracted features: Vessel Area
and Number of Microaneurysms, discriminated by DR
stages: No DR(R0), DR Level 1 (R1), DR Level 2 (R2),
DR Level 3 (R3).
is precisely to identify patterns and correlations that
are not necessarily recognizable by humans. Thus,
interpretability will naturally be compromised.
Some techniques have been developed and suc-
cessfully employed among experts to extract mean-
ingful information from DL classifiers. In particu-
lar, filter visualization and activation maps are the
most well-known techniques to enhance CNN’s inter-
pretability (Zhang and Zhu, 2018). Since convolu-
tional layers work as image feature extraction, visual-
izing either the filters applied in each specific layer or
their output, can help to understand and debug what
is happening inside the network. For example, by
looking at these filters, we know that in general the
first layers will extract more general low-level fea-
tures such as edges, shapes or texture, while deeper
units will be more discriminative and represent more
high-level concepts such as objects or scenes. The
fact that, as the name suggests, Deep Networks are
usually very dense with a high number of layers (spe-
cially if considering architectures such as Inception-
V3 and Densenet-121), makes this technique lacking
a lot of conceptual interpretation for the end-user, al-
though useful for debugging.
Activation maps are a step forward in this direc-
tion, as they present a way of visualizing which parts
of the image influence the final prediction. It has
been successfully employed for classification and lo-
calization of several retinal components and lesions
such as optic disc, microaneurysms or exudates (Lam
et al., 2018) (Gondal et al., 2017). Nonetheless, dis-
ease diagnosis is much more abstract than specific ob-
ject identification, thus presenting a bigger challenge.
The network learns distinctive features and correla-
tions between shapes, sizes, colors and different eye
regions, which frequently can not be correctly visu-
alized or even understood in a meaningful way. En-
couragingly, in a recent study (Poplin et al., 2018),
saliency maps consistently highlighted eye images in
models trained to predict cardiovascular risk factors.
Some DL models tended to identify prominent re-
gions like blood vessels, optic disc and macula while
others had a more uniform distribution through the
image. Additionally, high saliencies were obtained
at optic discs and along the main blood vessels when
classifying laterality in fundus images through a CNN
(Jang et al., 2018), which correspond to the main fea-
tures that human experts tend to identify as well.
Although proper identification of prominent re-
gions, further inferences can not be made with respect
to the true patterns identified by the model. This was
verified as well by the activation maps generated by
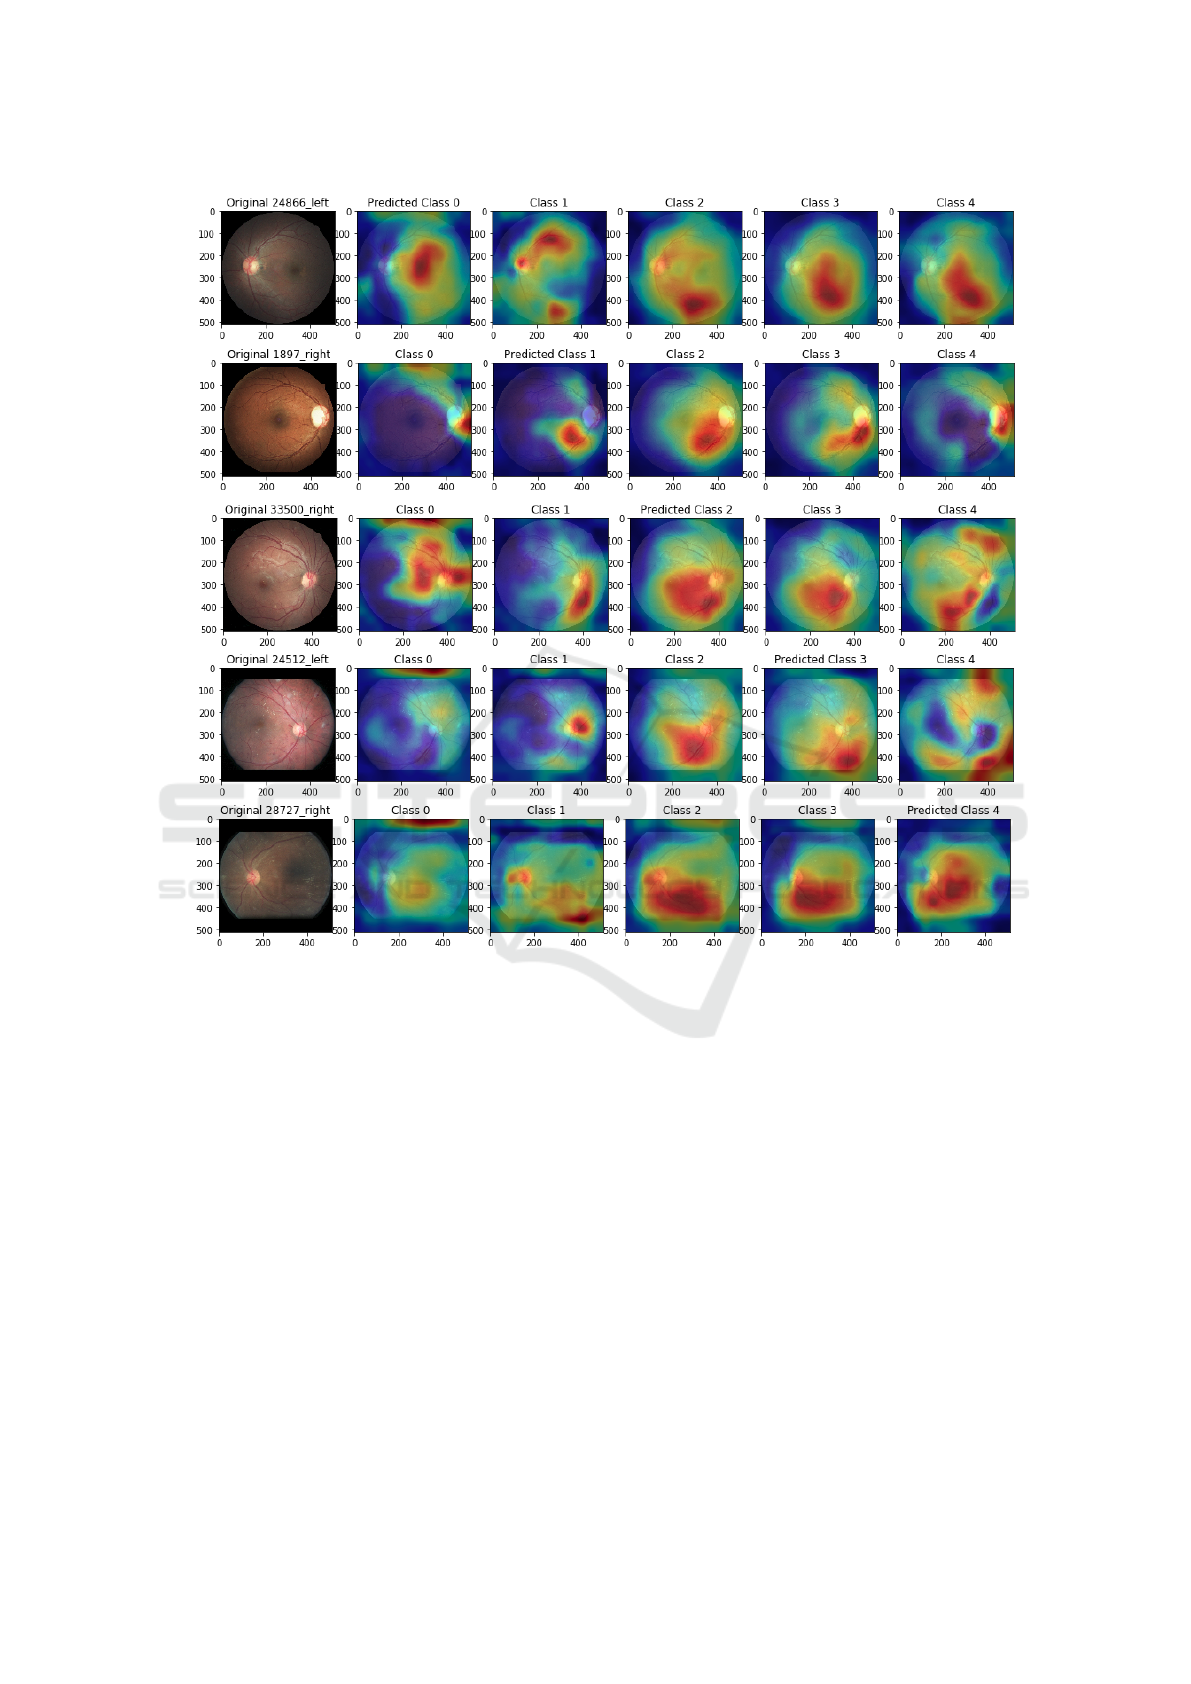
our network. Comparison of activation maps for dif-
ferent predicted classes is illustrated in Figure 6. A
few patterns can be identified. For instance, class
3 (5th column) tends to generate activations among
the lower main blood vessel. Some obvious features
for the human eye like exudates, do not seem to be
that relevant since they are not highlighted by the
heat maps. Additionally, similarities in activations for
the same image among classes 2,3,4 suggest that dif-
ferences between severity levels are often subtle and
may not be correctly interpreted by simply visualiz-
ing an activation map. Despite presenting some in-
sights into the network model, these patterns are not
intuitively explainable neither for engineers nor clin-
icians. Along these lines, even though some CNN
applications have been increasingly interpretable, we
are still far from reaching proper interpretable DL ap-
proaches in the presence of much more detail and in-
formation such as in fundus images.
HEALTHINF 2019 - 12th International Conference on Health Informatics
488
a)
b)
c)
d)
e)
Figure 6: Inception-V3 Activation Maps for correctly predicted images. Each row a), b), c), d), e) represents images with
ground-truth 0 (no DR), severity levels 1 (Mild), 2 (Moderate), 3 (Severe), 4 (Proliferative DR), respectively. Each column
depict the activation relatively to a given class. For instance, in the row a), the first image represents an eye with no DR
(ground-truth class 0, predicted class 0). The 5 following images are the activations produced by each output of the final
prediction layer.
An alternative approach to produce an inter-
pretable model for DR classification while still tak-
ing advantages of some of the neural networks char-
acteristics as been proposed by (Costa et al., 2018).
Through a Multiple-Instance Learning (MIL) tech-
nique, the authors extract visual features and descrip-
tors, ensembled in a bag of visual words (BoVW) to
produce a mid-level representation. Two neural net-
works are jointly optimized to encode and classify
the feature vector into healthy or non-healthy. By en-
forcing a interpretability-enhancement loss function
at the encoder level, the model becomes more visu-
ally meaningful.
5 CONCLUSION
In summary, the best test results were obtained with
Inception-V3 CNN architecture through the Eye-
PACS dataset reaching the accuracy of 89%. Also in
this work, the agreement between human graders and
machine learning approaches was assessed. The re-
sults show a strong agreement between computerized
solutions of Inception-V3 and Densenet-121. Even
when tested in different datasets the agreement be-
tween these networks is strong.
Considerable work remains to be done with re-
spect to validating, optimizing and generalizing these
algorithms. We consider that the growth of digital
Inter-observer Reliability in Computer-aided Diagnosis of Diabetic Retinopathy
489

clinical records seems to bring promising opportuni-
ties to create deep and rich datasets in order to inves-
tigate how well this transfer learning approach gen-
eralizes. To make sure that the machine learning al-
gorithms are functioning as intended, data cleaning
is necessary for the EyePACS dataset, discarding im-
ages that leave inaccurate or inconsistent grading by
the human graders or the machine learning methods,
as performed by (Gulshan et al., 2016).
In light of all of these, it is interesting to consider
the possibilities and consequences of the widespread
deployment of these algorithms in DR screening pro-
grams. The biggest challenge will be the poor under-
standing of how the algorithm reaches its final predic-
tion. Although accurate and precise, DL algorithms
are still considered a ”black box” due to their scale
and complexity, whereas the retina specialist inter-
prets the images based on recognizable features, more
in line with feature-based machine learning. There-
fore, a combination of machine learning algorithms
that have a strong agreement for the initial screen-
ing coupled with human grading to classify the posi-
tive predictions would likely yield a system with high
sensitivity and specificity, reducing the number of pa-
tients being referred unnecessarily.
In future work, we intend to deeply explore ex-
isting methodologies as well as develop new ones for
this purpose, so that disease diagnosis through DL can
be easily accepted by the medical society.
ACKNOWLEDGEMENTS
We would like to acknowledge the financial support
obtained from North Portugal Regional Operational
Programme (NORTE 2020), Portugal 2020 and
the European Regional Development Fund (ERDF)
from European Union through the project Symbi-
otic technology for societal efficiency gains: Deus
ex Machina (DEM), NORTE-01-0145-FEDER-
000026. The experimental data were kindly
provided by the Messidor program partners (see
http://www.adcis.net/en/DownloadThirdParty/
Messidor.html) and by EyePACS LLC. (see
http://www.eyepacs.com). It is also important
to acknowledge Telmo Barbosa and Silvia R
ˆ
ego,
from Fraunhofer Portugal AICOS for the develop-
ment of the annotation tool and management of the
dataset with multiple graders, and finally, the medical
doctors T
ˆ
ania Borges from Centro Hospitalar do
Porto and Gustavo Bacelar from CINTESIS, who
kindly annotated the images.
REFERENCES
Abadi, M., Barham, P., Chen, J., Chen, Z., Davis, A., Dean,
J., Devin, M., Ghemawat, S., Irving, G., Isard, M.,
et al. (2016). Tensorflow: a system for large-scale
machine learning. 16(1):265 – 283.
Andreotti, F., Carr, O., Pimentel, M. A., Mahdi, A., and
De Vos, M. (2017). Comparing feature-based classi-
fiers and convolutional neural networks to detect ar-
rhythmia from short segments of ecg. Computing,
44(1):1 – 4.
Arianti, A. and Andayani, G. A. (2016). Inter-
observer agreement in fundus photography for dia-
betic retinopathy screening in primary health care.
Ophthalmologica Indonesiana, 42(2):84 – 85.
Bourne, R. R., Stevens, G. A., White, R. A., Smith, J. L.,
Flaxman, S. R., Price, H., Jonas, J. B., Keeffe, J.,
Leasher, J., Naidoo, K., et al. (2013). Causes of vi-
sion loss worldwide, 1990–2010: a systematic analy-
sis. The lancet global health, 1(6):339 – 349.
Chollet, F. et al. (2015). Keras: Deep learning library for
theano and tensorflow. URL: https://keras. io/k, 7(8).
Costa, J., Sousa, I., and Soares, F. (2016). Smartphone-
based decision support system for elimination of
pathology-free cases in diabetic retinopathy screen-
ing.
Costa, P., Galdran, A., Smailagic, A., and Campilho, A.
(2018). A Weakly-Supervised Framework for Inter-
pretable Diabetic Retinopathy Detection on Retinal
Images. IEEE Access, 6:18747 – 18758.
Felgueiras, S., Costa, J., Soares, F., and Monteiro, M. P.
(2016). Cotton wool spots in eye fundus scope. Mas-
ter’s thesis, Faculdade de Engenharia da Universidade
Porto.
Feurer, M., Klein, A., Eggensperger, K., Springenberg, J.,
Blum, M., and Hutter, F. (2015). Efficient and robust
automated machine learning. In Cortes, C., Lawrence,
N. D., Lee, D. D., Sugiyama, M., and Garnett, R., edi-
tors, Advances in Neural Information Processing Sys-
tems 28, pages 2962 – 2970. Curran Associates, Inc.
Fleiss, J. L., Cohen, J., and Everitt, B. (1969). Large sample
standard errors of kappa and weighted kappa. Psycho-
logical bulletin, 72(5):323.
Gondal, W. M., K
¨
ohler, J. M., Grzeszick, R., Fink, G. A.,
and Hirsch, M. (2017). Weakly-supervised localiza-
tion of diabetic retinopathy lesions in retinal fundus
images. arXiv preprint arXiv:1706.09634.
Gulshan, V., Peng, L., Coram, M., Stumpe, M. C., Wu,
D., Narayanaswamy, A., Venugopalan, S., Widner, K.,
Madams, T., Cuadros, J., et al. (2016). Development
and validation of a deep learning algorithm for de-
tection of diabetic retinopathy in retinal fundus pho-
tographs. Jama, 316(22):2402 – 2410.
Huang, G., Liu, Z., van der Maaten, L., and Weinberger,
K. Q. (2016). Densely connected convolutional net-
works. arXiv preprint arXiv:1608.06993.
Ioffe, S. and Szegedy, C. (2015). Batch normalization: Ac-
celerating deep network training by reducing internal
covariate shift. arXiv preprint arXiv:1502.03167.
HEALTHINF 2019 - 12th International Conference on Health Informatics
490

Jang, Y., Son, J., Park, K. H., Park, S. J., and Jung, K.-
H. (2018). Laterality Classification of Fundus Images
Using Interpretable Deep Neural Network. Journal of
Digital Imaging.
Kelly, R. (2017). Critical Comparison of the Classifi-
cation Ability of Deep Convolutional Neural Net-
work Frameworks with Support Vector Machine Tech-
niques in the Image Classification Process. Master’s
thesis, Dublin Institue of Technology.
Kingma, D. P. and Ba, J. (2014). Adam: A
method for stochastic optimization. arXiv preprint
arXiv:1412.6980.
Krause, J., Gulshan, V., Rahimy, E., Karth, P., Wid-
ner, K., Corrado, G. S., Peng, L., and Webster,
D. R. (2017). Grader variability and the importance
of reference standards for evaluating machine learn-
ing models for diabetic retinopathy. arXiv preprint
arXiv:1710.01711.
Lam, C., Yu, C., Huang, L., and Rubin, D. (2018). Reti-
nal lesion detection with deep learning using image
patches. Investigative ophthalmology & visual sci-
ence, 59(1):590 – 596.
LeCun, Y., Bengio, Y., et al. (1995). Convolutional net-
works for images, speech, and time series. The
handbook of brain theory and neural networks,
3361(10):1995.
McHugh, M. L. (2012). Interrater reliability: the kappa
statistic. Biochemia medica: Biochemia medica,
22(3):276–282.
Mookiah, M. R. K., Acharya, U. R., Chua, C. K., Lim,
C. M., Ng, E. Y. K., and Laude, A. (2013). Computer-
aided diagnosis of diabetic retinopathy: A review.
Computers in Biology and Medicine, 43(12).
Poplin, R., Varadarajan, A. V., Blumer, K., Liu, Y., Mc-
Connell, M. V., Corrado, G. S., Peng, L., and Webster,
D. R. (2018). Prediction of cardiovascular risk fac-
tors from retinal fundus photographs via deep learn-
ing. Nature Biomedical Engineering, 2(3):158.
Raumviboonsuk, P., Krause, J., Chotcomwongse, P.,
Sayres, R., Raman, R., Widner, K., Campana,
B. J., Phene, S., Hemarat, K., Tadarati, M., et al.
(2018). Deep learning vs. human graders for classi-
fying severity levels of diabetic retinopathy in a real-
world nationwide screening program. arXiv preprint
arXiv:1810.08290.
R
ˆ
ego, S., Soares, F., and Monteiro-Soares, M. (2018). Vali-
dation of a mobile clinical decision-support system in
diabetic retinopathy screening. Master’s thesis, Facul-
dade de Medicina da Universidade Porto.
Russakovsky, O., Deng, J., Su, H., Krause, J., Satheesh, S.,
Ma, S., Huang, Z., Karpathy, A., Khosla, A., Bern-
stein, M., et al. (2015). Imagenet large scale visual
recognition challenge. International Journal of Com-
puter Vision, 115(3):211 – 252.
Szegedy, C., Liu, W., Jia, Y., Sermanet, P., Reed, S.,
Anguelov, D., Erhan, D., Vanhoucke, V., and Rabi-
novich, A. (2015). Going deeper with convolutions.
pages 1 – 9.
Szegedy, C., Vanhoucke, V., Ioffe, S., Shlens, J., and Wo-
jna, Z. (2016). Rethinking the inception architecture
for computer vision. In Proceedings of the IEEE con-
ference on computer vision and pattern recognition,
pages 2818 – 2826.
Wang, H., Zhou, Z., Li, Y., Chen, Z., Lu, P., Wang, W., Liu,
W., and Yu, L. (2017). Comparison of machine learn-
ing methods for classifying mediastinal lymph node
metastasis of non-small cell lung cancer from 18 f-fdg
pet/ct images. EJNMMI research, 7(1):11.
World Health Organization, W., Organization, W. H., et al.
(2014). The top 10 causes of death.
Zhang, Q.-s. and Zhu, S.-C. (2018). Visual interpretability
for deep learning: a survey. Frontiers of Information
Technology & Electronic Engineering, 19(1):27–39.
Inter-observer Reliability in Computer-aided Diagnosis of Diabetic Retinopathy
491
