In-situ Comparison for 2.5D Treemaps
Daniel Limberger, Matthias Trapp and J
¨
urgen D
¨
ollner
Hasso Plattner Institute, Faculty of Digital Engineering, University of Potsdam, Germany
Keywords:
In-situ Comparison, 2.5D Treemap, Visual Analytics.
Abstract:
2.5D treemaps can be used to visualize tree-structured data using the height dimension for additional infor-
mation display. For tree-structured and time-variant data though, changes or variants in the data are difficult
to visualize. This paper presents an in-situ approach to depict differences between two versions (original and
comparative state) of a data set, e.g., metrics of different revisions of a software system, in a single 2.5D
treemap. Multiple geometry variants for the in-situ representation of individual nodes, especially concerning
height, area, and color, are presented and discussed. Finally, a preliminary study for the simultaneous change
of attributes in height and area is described, hinting that arrow pattern help to clarify reading direction.
1 INTRODUCTION
Most use cases for visualization using treemaps
(Johnson and Shneiderman, 1991) have one aspect
in common: the input data sets representing systems
or phenomena to be analyzed are in a state of flux.
For example, to understand and evaluate the devel-
opment of a software system using treemaps (Bohnet
and D
¨
ollner, 2011), it is required to be able to analyze
the data collected over time, such as the extent of code
changes or the number of developers involved. Thus,
the visualization of changes over time is an impor-
tant aspect for visual analytics of system evolution.
If each evolutionary step can be represented as a tree-
structured data set, one goal is to depict corresponding
changes between an original state to a comparative
state using differences of attribute values (Fig. 1).
Problem Statement. While approaches for visual-
ization of changing tree-structures over time can be
applied for 2D treemaps (Tu and Shen, 2007; G
´
omez
et al., 2013), early techniques for 2.5D treemap visu-
alization (Bladh et al., 2004; Trapp et al., 2013) only
support the presentation (mapping and rendering) of a
single data set or state at any time. In 2.5D treemaps
“extruded [. . . ] shapes allow for a 3D attribute space
mapping to 3D substitutes within a treemap’s two-
dimensional reference space, hence, 2.5D. In contrast,
various visualization techniques such as treecube or
3D polar treemap (Johnson, 1993) are classified as
3D treemap that lay out hierarchy elements within
a three-dimensional reference space (Schulz et al.,
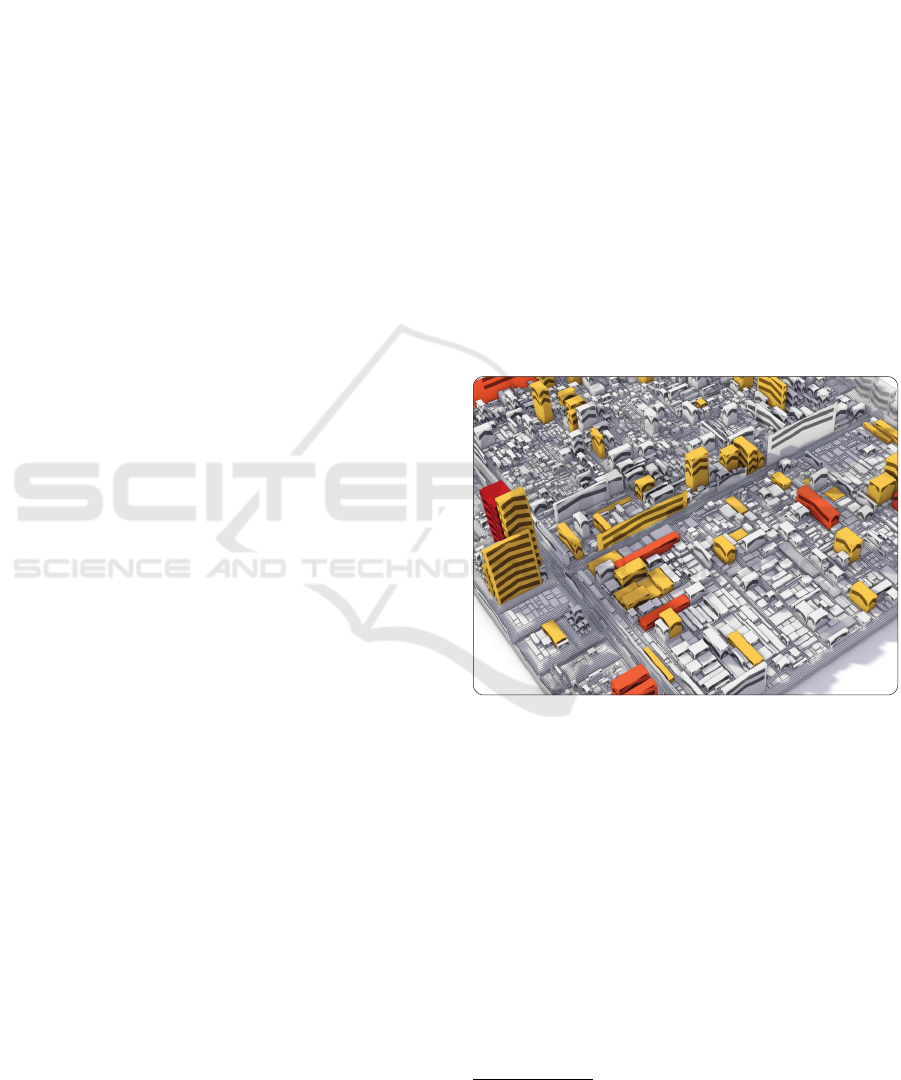
Figure 1: A 2.5D treemap depicting two revisions of met-
rics of a software system (Elasticsearch
1
) using a basic in-
situ template for the visual display of changes in height:
an arrow pattern. A more prominent color indicates code
units that were touched by only a few (yellow) or a single
(red) developer(s). The height of elements depict the cy-
clomatic complexity of the represented code unit. Finally,
an increase or decrease in height is indicated by upwards or
downwards pointing arrow pattern respectively.
2011). However, it should be noted that the term
3D treemap is often used to denote 2.5D treemap as
well.” (Limberger et al., 2017)
There are several approaches to visualize differ-
ences or variances in a data set that are applica-
ble to 2.5D treemaps. For example, small multi-
ples (Scheibel et al., 2016) can be used for the com-
1
Open Source, Distributed, RESTful Search Engine
with over 42.000 commits: github.com/elastic/elasticsearch
314
Limberger, D., Trapp, M. and Döllner, J.
In-situ Comparison for 2.5D Treemaps.
DOI: 10.5220/0007576203140321
In Proceedings of the 14th International Joint Conference on Computer Vision, Imaging and Computer Graphics Theory and Applications (VISIGRAPP 2019), pages 314-321
ISBN: 978-989-758-354-4
Copyright
c
2019 by SCITEPRESS – Science and Technology Publications, Lda. All rights reserved
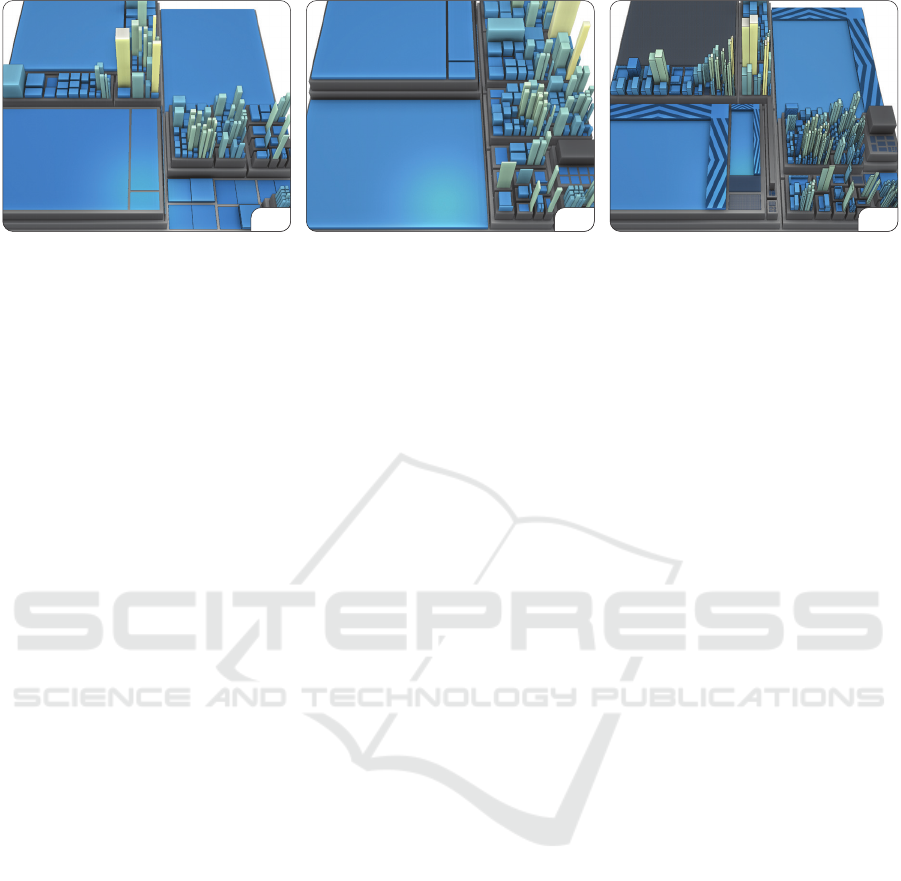
(a) (b) (c)
n
1
n
1
n
1
n
2
n
2
n
2
Figure 2: An exemplary in-situ visualization (c) shows the changes of two nodes n
1
and n
2
in mapped height and area
according to the differences in attribute values computed from the original state (a) and the respective comparative state (b).
parison of states or attribute mappings. To perceive
and locate changes, two depictions must be compared,
which might be a tedious and error-prone task. To re-
tain location and to visualize trends within changes of
attribute values, W
¨
urfel et al. applied the rendering
of natural metaphors to single or multiple items of a
2.5D treemap (W
¨
urfel et al., 2015). While it supports
visualization of change locations and trend directions,
it lacks capabilities to estimate the amount or degree
of attribute value changes. Besides static depiction,
changes can be communicated using animated transi-
tions (Fekete and Plaisant, 2002), which effectiveness
is limited by the number of changes that are animated
simultaneously.
Considering the treemap layout, the EvoCells rect-
angular layouting algorithm applies the evolution in
topology and associated weights of a tree-structured
dataset onto an initial layout is (Scheibel et al., 2018).
However, layout changes can cause confusion and
disorientation, especially when concerning the addi-
tion or removal of nodes. Even if the remaining lay-
out remains stable, the size changes of the individ-
ual nodes resulting from the new layout might dis-
tract from changes that may occur in the respective
attributes, such as item color or height.
A recently published flow-graph technique, Tem-
poral Treemaps (K
¨
opp and Weinkauf, 2019), allows
to visualize topology changes in tree-structured data.
The authors indicate that encoding changes in addi-
tional attributes might be possible using their tech-
nique. However, we find them to more or less discard
the inherent structure of classical treemaps and, by
that, the mental model typically associated with the
depicted topologies.
With respect to the approaches above, we argue
for a concept and technique to visualize changes or
trends using a single 2.5D treemap that enables users
to estimate the location, direction, dimension, and
quantity of changes without the need for animation.
Approach & Contributions. We argue that 2.5D
treemaps (using a common layouting strategy) can be
extended to presents two versions of mapped data in
a single visual representation (Fig. 2): Using an “in-
situ” (or “in position”) mapping approach, changes
between two data representations can be visualized by
depicting differences in height, area, and color of the
individual treemap items, simultaneously. We first an-
alyze, explore, and discuss the design space for visu-
alizing differences between two treemap items. Based
on the results, a developed prototypical in-situ imple-
mentation (integrated into a software tool for the vi-
sualization of static software system structures) rep-
resents the basis to perform a preliminary correlation
study to evaluate early results.
2 IN-SITU TREEMAP DESIGN
To visualize two states of a tree-structured data set us-
ing a single 2.5D treemap, we partially deviate from
the traditional 2.5D cuboid mapping of a treemap
item. Depending on the visual variables subjected to
change, e.g., color, area, or height as well as combina-
tions thereof, it maybe necessary to use a more com-
plex geometric structure. To this end, we discusses
so-called in-situ templates for the respective compar-
ative cases.
The taxonomy for visual comparison (Gleicher
et al., 2011) suggests that every comparison uses ei-
ther juxtaposition, superposition, or explicit encod-
ings for the visual display of original and compara-
tive states. Our overall approach uses a superposition,
that is, a single treemap. Each of the in-situ tem-
plates, however, utilize one of the three approaches,
thus, the resulting treemap might be composed of ei-
ther juxtapositioned, superpositioned, or explictly en-
coded comparisons of one or more attributes.
In general, the in-situ templates are intended to
represent leaf nodes and cannot simultaneously depict
inner nodes. When using a level-of-detail technique
In-situ Comparison for 2.5D Treemaps
315
that is linked directly to the data’s tree-structure, in-
situ templates might be used for inner nodes as well.
In that case, the templates should be adjusted to ac-
count for discriminability of leaf and inner nodes
(Elmqvist and Fekete, 2010; Limberger et al., 2017).
Please note that all of the following images are
captured from a prototypical implementation and
were adjusted in contrast and color for print.
2.1 Changes in Item Color
For a single cuboid, we map a data attribute to a color
for both the original data and for the comparative data,
and explore how best to display these two colors on
the same cuboid (Figure 3 summarizes a few design
alternatives for changes in color). By changing the
color alone, it is not required to deviate from a cuboid
geometry as a representation of a tree node. Either
color gradients, distinct colors, or color patterns can
be used. As shown in Figure 3(a), it can be difficult
to recognize the original and comparative color in a
color gradient or to perceive any change in color at all.
Furthermore, the intermediate colors have to be com-
puted by interpolating the underlying attribute values
and mapping the resulting values to color by applying
the treemap’s color scale. This process often causes
incomprehensible color gradients.
If the cuboid is split vertically instead as shown
in Figure 3(b), each half can distinctively encode one
of the two attribute values by its color. It should
be noted, that a reading direction is required in or-
der to unambiguously associate the colors to original
and comparative state. As Western culture generally
reads from left to right, we decided to arrange colors
for the original and comparative values accordingly.
Besides, the template is only beneficial if padding be-
tween siblings is applied. Otherwise, the halves of a
split cuboid might be indistinguishable from two con-
tiguous cuboids. To counter this, the cuboid could be
split diagonally though emphasizing the comparative
value at the cuboid front (Fig. 3(c)).
Alternatively, color patterns by means of proce-
dural texturing can be used (Fig. 3(d) and 3(e)). This,
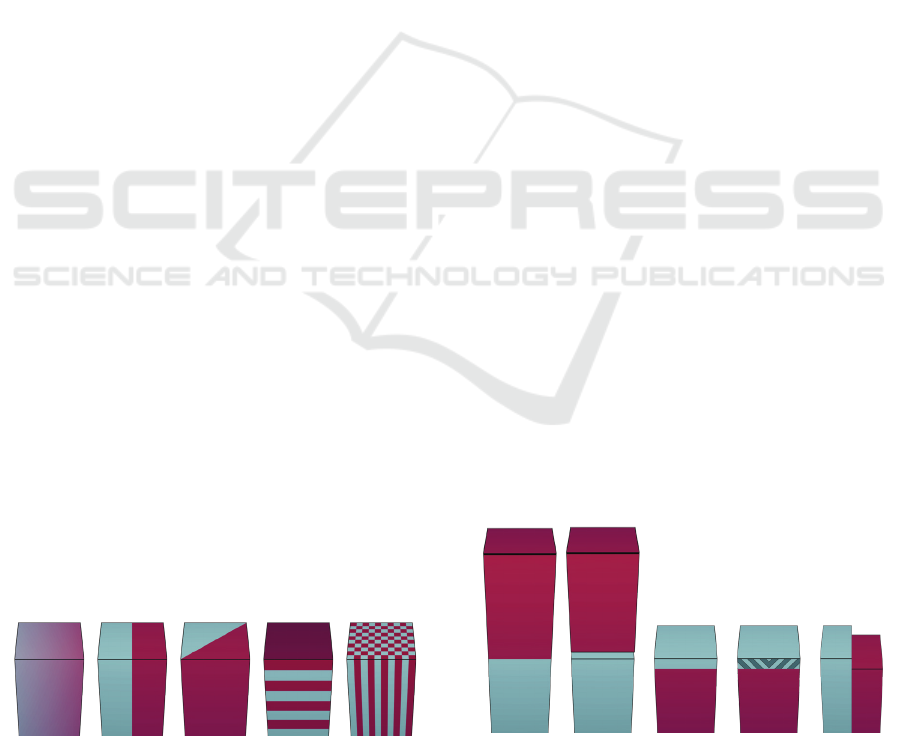
(a) (b) (c) (d) (e)
Figure 3: In-situ templates for depicting changes between
an original (bright cyan) and a comparative (dark magenta)
value of an attribute mapped to color.
however, might lead to perception problems due to vi-
sual clutter (e.g., very small cuboids). Likewise (es-
pecially with the pattern in Figure 3(e)), it is difficult
to establish an intuitive reading direction since no dis-
tinct beginning and end are recognizable.
2.2 Changes in Item Height
For the communication of differences in attribute val-
ues mapped to height we discuss three in-situ tem-
plates applying a stacked, combined, and side-by-side
(vertical split) arrangement of two distinct cuboids.
This is in part conceptually similar to the metaphors
property towers (Steinbr
¨
uckner and Lewerentz, 2010)
as well as bricks (Wettel and Lanza, 2008)—both ca-
pable of encoding multiple states of an attribute value.
Stacked Arrangement. If the area of a node re-
mains unchanged, two cuboids can be stacked on
top of each other (Fig. 4(a)). This approach tends
to increase the average height of treemap items and
thereby increases occlusion noticeably. Although
the hidden nodes could be made visible to the user
through navigation (e.g., camera rotation or tilt), we
prefer to keep occlusion in 2.5D treemaps to a min-
imum (padding, heightened elevation of the virtual
camera, etc.). Alternatively, transparency can be used
though, if latest order-independent transparency ren-
dering (Enderton et al., 2010) are not available or fea-
sible, transparency most likely causes visual clutter.
Furthermore, it is difficult to compare the heights of
the two cuboids to one another and, in order to em-
phasize the junction between the cuboids (especially
if they have the same color applied) we advise to use
a levitation-like effect as depicted in Figure 4(b).
Combined Arrangement. Given that the area of
a node is the same for its original and comparative
state (as with the stacked arrangement), the height of
(a) (b) (c) (d) (e)
Figure 4: In-situ templates for depicting changes between
an original (bright cyan) and a comparative (dark magenta)
value of an attribute mapped to height.
IVAPP 2019 - 10th International Conference on Information Visualization Theory and Applications
316

cuboids can be nested (Fig. 4(c)). Given a unique or-
dering (e.g., the comparative state item is displayed
within the first), this approach can only be used for
reductions. This can be circumvented by using, e.g.,
an arrow pattern encoding the direction of change
(Fig. 4(d)). Alternatively or in addition to that, trans-
parency could be used to encode a decrease in height:
the upper cuboid (depicting the amount of reduction)
would be displayed transparent. This is, again, most
likely constrained to the rendering capabilities since
it requires order-independent transparency.
Side-by-Side Arrangement. The two states can be
represented by cuboids arranged next to each other
(Fig. 4(e)), analogously to the vertical split for color
change. The overall height mapping of the treemap
remains unaffected and, similar to Section 2.1, the
original and comparative state should be displayed
on the left and right respectively. With this arrange-
ment, height changes can be identified more effec-
tively, since the respective cuboids are depicted di-
rectly next to each other. Due to the side-by-side
arrangement and, thus, the more explicit reading di-
rection, this template might be easier to read in gen-
eral (Talbot et al., 2014) but is not rotation-invariant.
Another disadvantage of this arrangement is the re-
duced area available for mapping which requires spe-
cific treatment in order to remain comparable to items
of unchanged nodes. In practice though, these are
negligible since rotational navigation does not benefit
exploration (except for resolving occlusion) and area
is mostly used to indicate a node’s magnitude.
2.3 Changes in Item Area
The change in the area of two nodes can be rep-
resented in different ways. A straight-forward ap-
proach would be to arrange both cuboids, side-by-side
(Fig. 5(a)) and consider their area mapping indepen-
dently of one another. Two cuboids of different ex-
tent and aspect ratio are difficult to compare in terms
of their area, especially if the depth of the cuboid
is shortened by perspective. Another problem is the
(a) (b) (c)
Figure 5: In-situ templates for depicting changes between
two values of an attribute mapped to area.
increased space necessary for the treemap which de-
creased the size of all items. Figure 5(b) shows how
a cuboid of smaller area can be positioned within a
cuboid of larger area at the bottom right corner. This
solves the aspect ratio issue, but is only feasible for
nodes of a more square-like aspect ratio.
Embedding the node with the smaller area within
the node of larger area posses the following problem:
it is no longer possible to know which of the areas be-
longs to which state. This problem can be approached
by introducing a reading direction, as described in
Section 2.1 and 2.2. Here, the reading direction of
the representation is adapted to a local reading direc-
tion as follows: the node of the reference state is lo-
cated at the top left and the node of the changed state
at the bottom right. If the area decreased, the area-
wise small cuboid is at the bottom right, but if the
area has increased, the square-shaped cuboid is at the
top left (Fig. 5(c)).
2.4 Depicting Multiple Changes
Previous sections discussed how changes of a single
visual variable can be communicated to a user. How-
ever, it is more probable that two or three variables
change simultaneously.
Color-height and Color-area Changes. Changes
in color mapping can be easily integrated into the ap-
proach for height and area changes. For this, the cor-
responding cuboid of a state is colored according to
its mapping. The cuboid positioning is retained, thus
the reading order described previously is preserved.
Height-area Changes. Similar to changes in color,
changes in item height can be integrated into the tem-
plates for the representation of area changes. The
template is divided into two items, each representing
the height of the respective nodes of the respective
state, e.g., the smaller cuboid represents the height of
the node with the smaller area. The prism with the
L-shaped footprint surrounding this cuboid represents
the height of the node with the larger area (Fig. 7(a)).
However, as shown in Figure 6, this approach, in
Figure 6.
combination with the reading direction proposed in
In-situ Comparison for 2.5D Treemaps
317
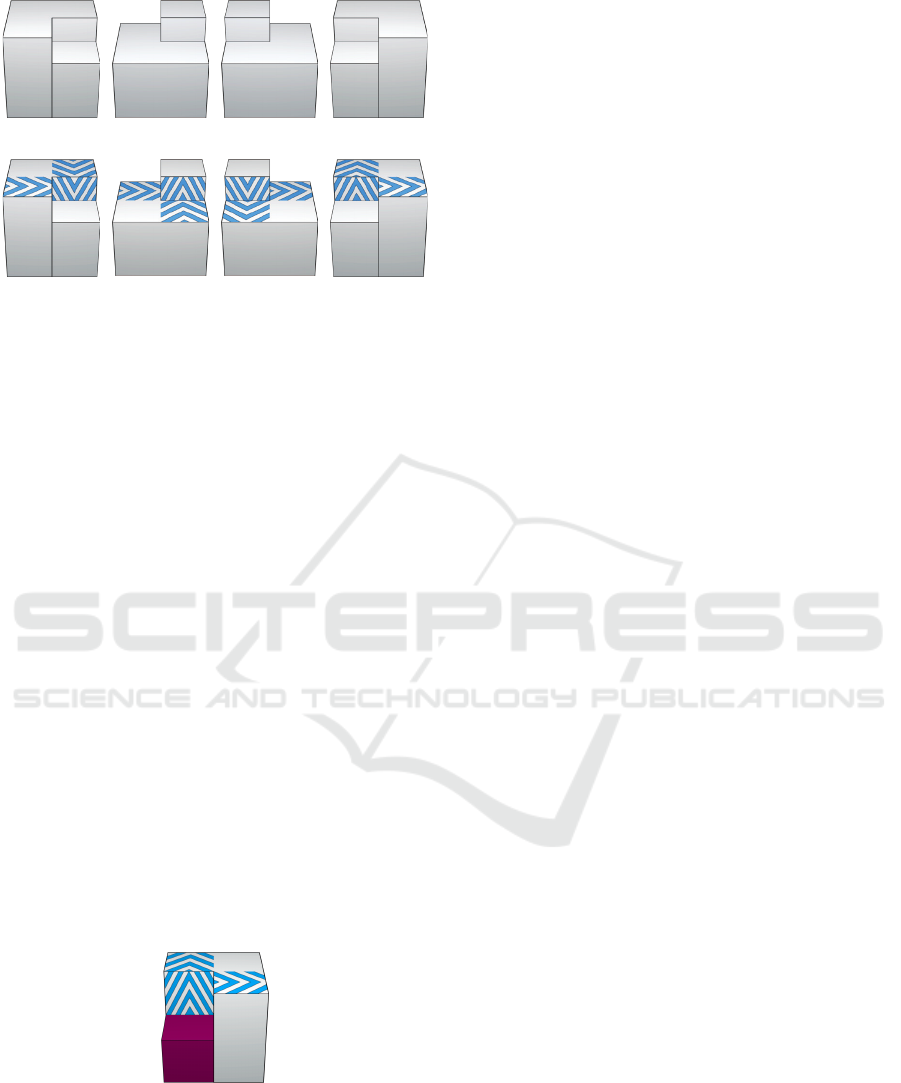
(a) (b) (c) (d)
(e) (f) (g) (h)
Figure 7: Templates for visualization of simultaneous
height and area changes: height and area decrease (a, e),
height increase and area decrease (b, f), height decrease and
area increase (c, g), and height and area increase (d, h).
Section 2.3, introduces occlusions: the original state
can no longer be perceived. To avoid such occlusions,
the notion of reading direction is extended as follows.
In addition to the distinction between original state
and comparative state, it should be ensured that the
presentation remains free from obfuscation. To this
end, the original state is arranged on the left and the
comparative state on the right, and the lower item is
displayed at the front and the higher item at the back.
The resulting four orientations are shown in Figure 7
(top row).
In order to increase readability we added proce-
dural textures that indicate the direction of the surface
and height changes. Figure 7 (bottom row) shows the
representations using arrow textures indicating the di-
rections in which the area and height have changed
from the original state to the comparison state.
Color-Height-Area Changes. Coincident changes
within all three visual variables can be represented us-
ing, e.g., procedural texturing in the height and area
change templates described above. The objects in the
Figure 8.
geometries, which already indicate the height change,
are colored according to the color of the state (as
shown in the Figure 8). The positioning and texturing
of the items are preserved according to the principles
introduced for simultaneous height and area changes.
This ensures the assignment of the two states and
avoids occlusions.
2.5 Hierarchy Changes & Quantization
A special case for in-situ visualization are changes
within the data hierarchy between two states, i.e.,
nodes are added, removed, or moved to different hi-
erarchy levels (K
¨
opp and Weinkauf, 2019). The pre-
sentation of these nodes is difficult because a respec-
tive corresponding node is missing. These cases can
be visually communicated using transparency render-
ing, e.g., added nodes are displayed with transparent
surface, while dropped nodes are only displayed as
wire-frame.
The way in which the amount of changes are pre-
sented is of particular importance for comparative vi-
sualizations. Using an exact mapping of changes the-
oretically allows for an accurate reading of differ-
ences, but makes it difficult to detect minimal differ-
ences between two states at the same time. Further,
perception is more difficult for 2.5D presentations,
since the difference mapping is additionally distorted
by perspective projection. To counter-balance these
effects, difference values can be quantized. This im-
pacts accuracy, but might increase readability, e.g., by
making minimal changes visible.
3 IMPLEMENTATION REMARKS
This section explains how the presented approach can
be integrated into existing systems and frameworks
for treemap visualization. Such integration basically
comprises the following five steps performed prior to
rendering: (1) import data sets for the two states to
compare, (2) merge both states into a single tree rep-
resentation, (3) determine changed attributes from the
merged tree, (4) compute the respective maximum at-
tribute values for layout purposes, and (5) perform
layouting and geometry synthesis.
Attribute Merging. For each attribute, the input
tree structures have an object that stores the individ-
ual values for each contained node (in the following
attribute map). To represent two states per node, two
attribute maps are used per stored attribute. The merg-
ing step first iterates over the nodes of the reference
tree and collects the attributes of the corresponding
node in the changed tree. If a node does not exist in
the changed, comparative tree or if it has been moved
within the tree, “null-values” are set for all of its at-
tributes; otherwise all attribute values that the node
are copied. Finally for each node of the changed tree
IVAPP 2019 - 10th International Conference on Information Visualization Theory and Applications
318

the newly added or omitted nodes of the first pass are
added to the reference tree.
Layout Computation & Geometry Synthesis. In
addition to an attribute normalization step, the lay-
out computation must also be adjusted to displayed
all nodes in correct relation to each other. It is nec-
essary to use the maximum value of both states at a
per-node level. Although this may drastically change
the layout of the in-situ treemap compared to the lay-
out of the individual states, all the nodes are displayed
in correct proportions. For every leaf node, the data
calculated in the previous steps (i.e., length, width,
height, and color, for each cuboid of both states) is
used to decide which of the geometries described in
Section 2 are selected for mesh generation. While in
most cases it is sufficient to compute absolute mesh
coordinates directly, mapping area changes benefits
from coordinates relative to a unit cube. This is be-
cause the in-situ template must be rotated in 90 degree
increments, depending on the interplay of height and
area change directions, as described in Section 2.4.
4 PRELIMINARY EVALUATION
To probe the effectiveness of some of the more com-
plex in-situ templates, we conducted a brief, prelim-
inary correlation study. Different variations of ren-
derings of small 2.5D treemaps were created using
our prototype. Each rendering comprised a prominent
node of simultaneous height and area change depicted
using the appropriate in-situ template (as shown in
Figure 7). The amount of change varied from 25% to
50% (either increase or decrease) and no color map-
ping was used, resulting in mostly white cuboids with
slight shading. The variations were derived from the
independent variables
• increase or decrease in height,
• increase or decrease in area, and
• with or without the use of the arrow pattern.
Cases in which either height or area remained un-
changed are not relevant for the specific in-situ tem-
plate used and was ignored.
The study was executed using Google Forms
1
. A
total of 28 participants were shown the static, precom-
puted renderings without randomization and, for each
rendering, were asked to identify the type of change
(increase or decrease) for height and area of a specific,
encircled node. The group of participants included
users with prior knowledge of treemaps as well as
1
https://www.google.com/forms/about/
Height
decr.
decr.
decr. w/o
w/
w/o
w/
w/o
w/
w/o
w/
decr.
decr.
decr.
incr.
incr.
incr.
incr.
decr.
decr.
incr.
incr.
incr.
incr.
Area Pattern
20%0% 40% 60% 80% 100%
Area change correctHeight change correct
Figure 9: Results for height and area-change templates.
users without prior knowledge of visualization tech-
niques in general.
For the evaluation the effectiveness was mea-
sured using a dichotomous accuracy of the answers;
only the binary correctness of the identified direc-
tion / types of changes (increase or decrease) in both
height and area was counted. The main goal was to
derive two indicators. First, whether or not the tem-
plate seems capable of communicating the direction
of change (increase or decrease). Second, if a more
explicit encoding of the read direction, by means of an
additional arrow pattern, can increase effectiveness.
The accuracy measures are shown in Figure 9
and indicate that the use of arrow patterns increased
the change accuracy for both height and area change
(in this case over 75%). In the case of oppos-
ing changes, some participants interpreted the larger
cuboid (Fig. 7(f) and Fig. 7(g)) as a small, superim-
posed body. In these cases, the arrow pattern seem
to have the biggest impact on clarifying the reading
direction. This suggest that the underlying template-
design requires further improvement in order to in-
crease accuracy.
5 CONCLUSIONS
This paper presents an in-situ visualization technique
for depicting changes in 2.5D treemap items (such as,
mapped color, height, and area) that allows for the
comparison of two versions of hierarchically orga-
nized data using a single image. A brief, preliminary
study hints that even for simultaneous data changes
affecting two visual variables, i.e., height and area,
in-situ representation might be helpful in recognizing
and assessing such changes. Changes that would be
In-situ Comparison for 2.5D Treemaps
319
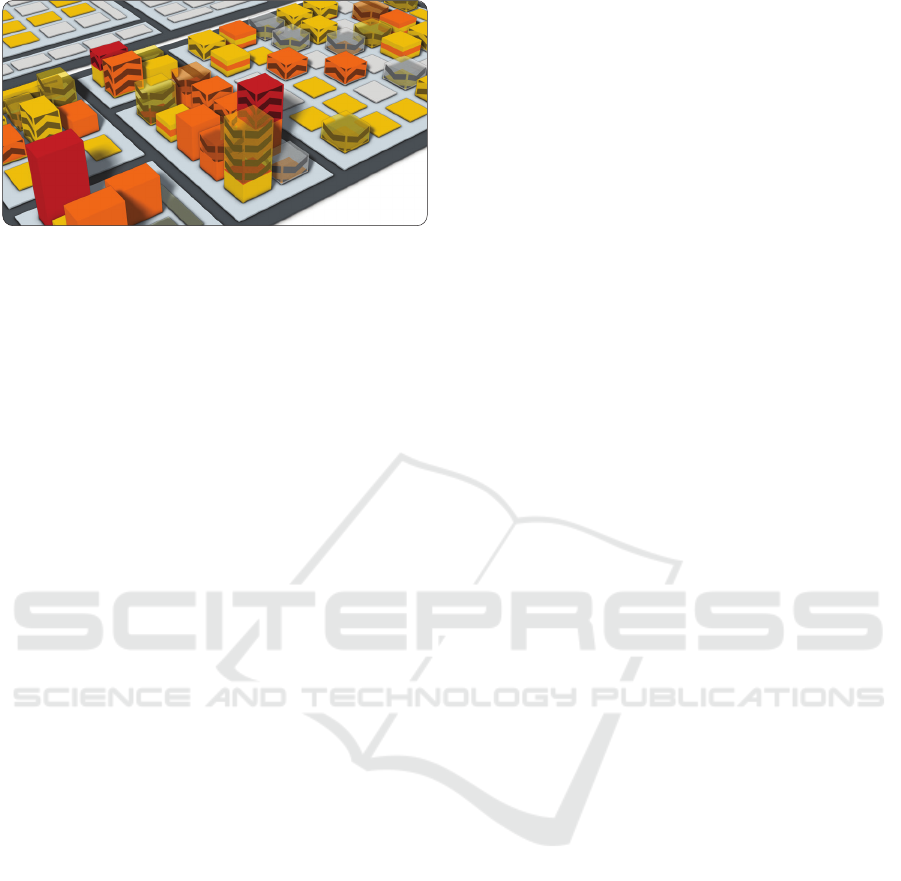
Figure 10: In-situ utilizing transparency for height changes.
difficult to perceived due to layout changes, e.g., by
adding or removing large nodes in a hierarchy, can
be visualized using an in-situ treemap and interpreted
sufficiently by the user. Even though the in-situ rep-
resentation of treemap items increases the complexity
of the treemap structure, it might provide an effective
alternative for the display of changes in 2.5D visual-
izations in general.
With respect to rendering techniques, we were
able to utilize GPU-based, stochastic and order-
independent transparency. First results (Fig. 10) show
that, regardless of the increased hardware require-
ments and the added visual complexity, transparency
might be an interesting extension to the design space
of in-situ templates. Moreover, we would like to eval-
uate the effectiveness of in-situ for large data sizes
and facilitate visual-analytics tasks of expert users.
Most importantly, an exhaustive and comprehensive
experiment and evaluation with the presented in-situ
templates is needed, also including task performance
in comparison to basic 2.5D treemaps.
ACKNOWLEDGMENTS
The authors would like to thank the anonymous re-
viewers for their valuable comments and sugges-
tions to improve the paper. The authors like to
thank Alexander Lehmann and Jan Philipp Sachse
for their technical contributions to the presented
approach. This work was funded by the Fed-
eral Ministry of Education and Research (BMBF),
Germany, within the InnoProfileTransfer research
group “4DnD-Vis” (www.4dndvis.de) and “BIMAP”
(www.bimap-project.de).
REFERENCES
Bladh, T., Carr, D. A., and Scholl, J. (2004). Extending
tree-maps to three dimensions: A comparative study.
In Proc. APCHI, pages 50–59.
Bohnet, J. and D
¨
ollner, J. (2011). Monitoring code quality
and development activity by software maps. In Proc.
ACM MTD, pages 9–16.
Elmqvist, N. and Fekete, J.-D. (2010). Hierarchical aggre-
gation for information visualization: Overview, tech-
niques, and design guidelines. IEEE Trans. Vis. Com-
put. Graph., 16(3):439–454.
Enderton, E., Sintorn, E., Shirley, P., and Luebke, D. (2010).
Stochastic transparency. In Proc. ACM SIGGRAPH
I3D, pages 157–164.
Fekete, J.-D. and Plaisant, C. (2002). Interactive informa-
tion visualization of a million items. In Proc. IEEE
IV, pages 117–124.
Gleicher, M., Albers, D., Walker, R., Jusufi, I., Hansen,
C. D., and Roberts, J. C. (2011). Visual comparison
for information visualization. Information Visualiza-
tion, 10(4):289–309.
G
´
omez, J. A. G., Pack, M. L., Plaisant, C., and Shneider-
man, B. (2013). Visualizing change over time using
dynamic hierarchies: Treeversity2 and the stemview.
IEEE Trans. Vis. Comput. Graph., 19(12):2566–2575.
Johnson, B. and Shneiderman, B. (1991). Tree-maps: A
space-filling approach to the visualization of hierar-
chical information structures. In Proc. IEEE VIS,
pages 284–291.
Johnson, B. S. (1993). Treemaps: Visualizing hierarchical
and categorical data. PhD thesis, University of Mary-
land. HCIL-94-04, UMI-94-25057.
K
¨
opp, W. and Weinkauf, T. (2019). Temporal treemaps:
Static visualization of evolving trees. IEEE Trans. Vis.
Comput. Graph., 25(1):534–543.
Limberger, D., Scheibel, W., Hahn, S., and D
¨
ollner, J.
(2017). Reducing visual complexity in software maps
using importance-based aggregation of nodes. In
Proc. IVAPP, VISIGRAPP, pages 176–185. INSTICC,
SciTePress.
Scheibel, W., Trapp, M., and D
¨
ollner, J. (2016). Interactive
revision exploration using small multiples of software
maps. In Proc. IVAPP, VISIGRAPP, pages 133–140.
Scheibel, W., Weyand, C., and D
¨
ollner, J. (2018). Evo-
cells - A treemap layout algorithm for evolving tree
data. In Proc. IVAPP, VISIGRAPP, pages 273–280.
SciTePress.
Schulz, H.-J., Hadlak, S., and Schumann, H. (2011). The
design space of implicit hierarchy visualization: A
survey. IEEE Trans. Vis. Comput. Graph., 17(4):393–
411.
Steinbr
¨
uckner, F. and Lewerentz, C. (2010). Representing
development history in software cities. In Proceedings
of the 5th International Symposium on Software Visu-
alization, SOFTVIS ’10, pages 193–202, New York,
NY, USA. ACM.
Talbot, J., Setlur, V., and Anand, A. (2014). Four ex-
periments on the perception of bar charts. IEEE
Transactions on Visualization and Computer Graph-
ics, 20:2152–2160.
Trapp, M., Schmechel, S., and D
¨
ollner, J. (2013). Inter-
active rendering of complex 3d-treemaps with a com-
parative performance evaluations. In Proc. GRAPP &
IVAPP, pages 165–175.
IVAPP 2019 - 10th International Conference on Information Visualization Theory and Applications
320

Tu, Y. and Shen, H.-W. (2007). Visualizing changes of hi-
erarchical data using treemaps. IEEE Transactions on
Visualization and Computer Graphics, 13(6):1286–
1293.
Wettel, R. and Lanza, M. (2008). Visual exploration of
large-scale system evolution. In IEEE Proc. WCRE,
Working Conference on Reverse Engineering, pages
219–228.
W
¨
urfel, H., Trapp, M., Limberger, D., and D
¨
ollner, J.
(2015). Natural phenomena as metaphors for visu-
alization of trend data in interactive software maps. In
Computer Graphics and Visual Computing, (CGVC),
pages 69–76.
In-situ Comparison for 2.5D Treemaps
321
