
Residual Convolutional Neural Networks for Breast Density
Classification
Francesca Lizzi
1,2,4
, Stefano Atzori
3
, Giacomo Aringhieri
3
, Paolo Bosco
1
, Carolina Marini
3
,
Alessandra Retico
1
, Antonio C. Traino
3
, Davide Caramella
2,3
and M. Evelina Fantacci
1,2
1
Istituto Nazionale di Fisica Nucleare (INFN), Pisa, Italy
2
University of Pisa, Pisa, Italy
3
Azienda Ospedaliero-Universitaria Pisana (AOUP), Pisa, Italy
4
Scuola Normale Superiore, Pisa, Italy
Keywords:
Convolutional Neural Networks, Breast Density, BI-RADS, Residual Neural Networks.
Abstract:
In this paper, we propose a data-driven method to classify mammograms according to breast density in BI-
RADS standard. About 2000 mammographic exams have been collected from the “Azienda Ospedaliero-
Universitaria Pisana” (AOUP, Pisa, IT). The dataset has been classified according to breast density in the
BI-RADS standard. Once the dataset has been labeled by a radiologist, we proceeded by building a Residual
Neural Network in order to classify breast density in two ways. First, we classified mammograms using two
“super-classes” that are dense and non-dense breast. Second, we trained the residual neural network to classify
mammograms according to the four classes of the BI-RADS standard. We evaluated the performance in terms
of the accuracy and we obtained very good results compared to other works on similar classification tasks.
In the near future, we are going to improve the results by increasing the computing power, by improving the
quality of the ground truth and by increasing the number of samples in the dataset.
1 INTRODUCTION
Breast cancer is one of the most diagnosed and fatal
cancer all over the world (International Agency for
Research on Cancer, 2018). The strongest weapons
we have against it are prevention and early diagno-
sis. It has been evaluated that one woman in eight is
going to develop a breast cancer in her life (Loberg
et al., 2015). It is also widely accepted that early di-
agnosis is one of the most powerful instrument we
have in fighting this cancer (Loberg et al., 2015).
Full Field Digital Mammography (FFDM) is a non-
invasive high sensitive method for early stage breast
cancer detection and diagnosis, and represents the ref-
erence imaging technique to explore the breast in a
complete way (D. R. Dance et al., 2014). Since mam-
mography is a 2D x-ray imaging technique, it suf-
fers from some intrinsic problems: a) breast struc-
tures overlapping, b) malignant masses absorb x-rays
similarly to the benignant ones and c) the sensitiv-
ity of the detection is lower for masses or microcal-
cification cluster in denser breasts. Breast density is
the amount of fibroglandular tissue with respect to fat
tissue as seen on a mammographic exam (Krishnan
et al., 2017). A mammogram with a very high per-
centage of fibro-glandular tissue is less readable be-
cause dense tissue presents an x-ray absorption coef-
ficient similar to cancer one. Furthermore, to have
a sufficient sensitivity in dense breast, a higher dose
has to be delivered to the subject (Miglioretti et al.,
2016). Moreover, breast density is an intrinsic risk
factor in developing cancer (McCormack, 2006). In
order to have an early diagnosis, screening programs
are performed on asymptomatic women at risk in a
range between 45 and 74 years. Since a lot of healthy
women are exposed to ionizing radiation, dose deliv-
ering should be carefully controlled and personalized
with respect to the imaging systems, measurement
conditions and breast structures. Furthermore, the
European Directive 59/2013/EURATOM (Euratom,
2013) states that subjects have to be well informed
about the amount of received radiation dose. For these
reasons, the RADIOMA project (“RADiazioni IOn-
izzanti in MAmmografia”, funded by “Fondazione
Pisa”, partners: “Dipartimento di Fisica” of Univer-
sity of Pisa, “Istituto Nazionale di Fisica Nucleare”
(INFN), “Fisica sanitaria” of “Azienda Ospedaliero-
Universitaria Pisana” (AOUP) and “Dipartimento di
258
Lizzi, F., Atzori, S., Aringhieri, G., Bosco, P., Marini, C., Retico, A., Traino, A., Caramella, D. and Fantacci, M.
Residual Convolutional Neural Networks for Breast Density Classification.
DOI: 10.5220/0007522202580263
In Proceedings of the 12th International Joint Conference on Biomedical Engineering Systems and Technologies (BIOSTEC 2019), pages 258-263
ISBN: 978-989-758-353-7
Copyright
c
2019 by SCITEPRESS – Science and Technology Publications, Lda. All rights reserved
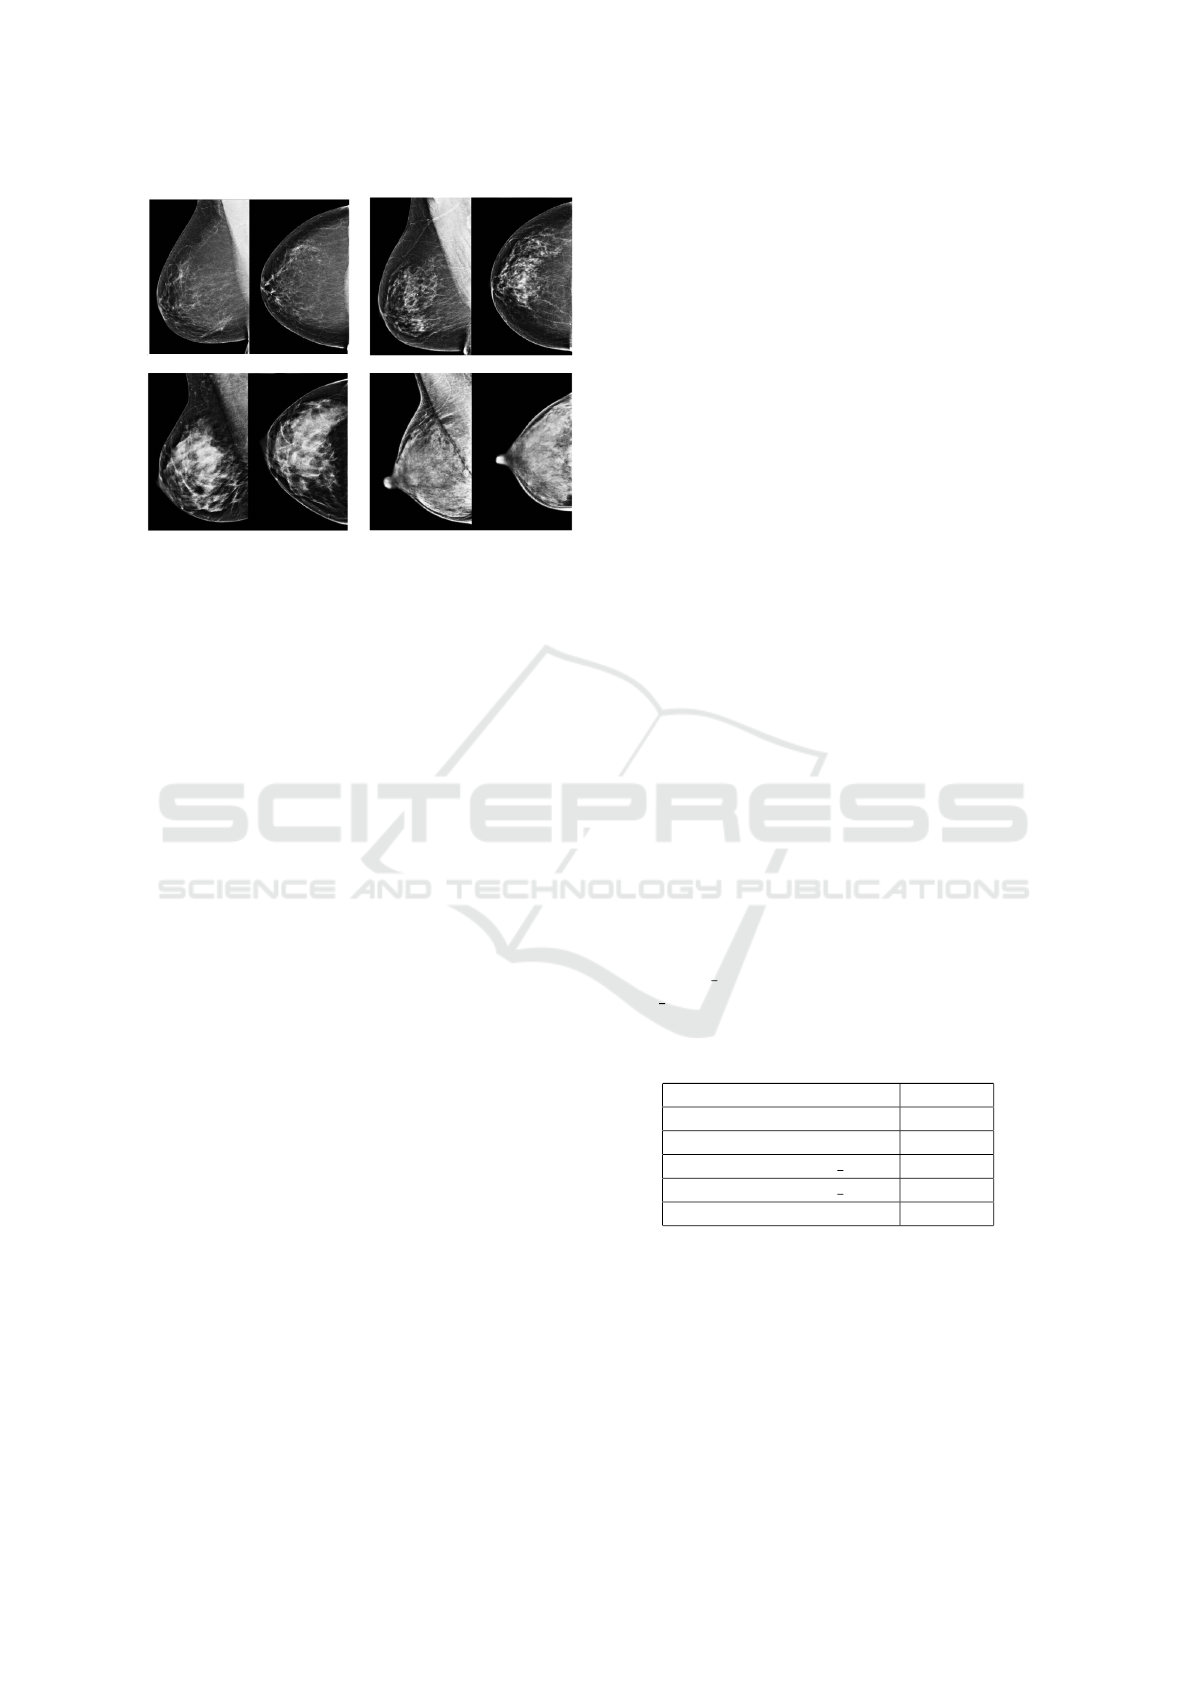
Figure 1: Top left: almost entirely fatty breast (“A”). Top
right: breast with scattered areas of fibroglandular density
(“B”). Lower left: heterogeneously dense breast (“C”).
Lower right: extremely dense breast (“D”).
Ricerca Traslazionale e delle Nuove Tecnologie in
Medicina e Chirurgia” of University of Pisa) was born
with the aim of developing a personalized and reliable
dosimetric quantitative index for mammographic ex-
amination (Traino et al., 2017) (Sottocornola et al.,
2018). Since breast dense tissue is radio-sensitive,
a new personalized dosimetric index should consider
breast density. For all these reasons, we decided
to build a breast density classifier based on a resid-
ual convolutional neural network. The breast density
standard we chose is reported on the Fifth Edition of
the BI-RADS Atlas (Breast Imaging-Reporting And
Data System) (Sickles et al., 2013). The BI-RADS
standard consists in four qualitative classes, defined
by textual description (Figure 1): almost entirely fatty
(“A”), scattered areas of fibroglandular density (“B”),
heterogeneously dense (“C”) and extremely dense
(“D”).
The assessment of breast density is a very impor-
tant issue since a woman with a dense breast should
be directed towards more in-depth screening paths.
As radiologist breast density assessment suffers from
a not-negligible intra and inter-observer variability
(Ciatto et al., 2005), computer methods have been de-
veloped. The most known is called Cumulus (Alonzo-
Proulx et al., 2015) which is a software that works
with radiologist manual input and allows to segment
fibroglandular tissue. In the last years, fully auto-
mated methods have been developed in order to re-
duce the breast density assessment variability as much
as possible (Alonzo-Proulx et al., 2015). Other works
applied deep learning techniques to solve this kind of
problem. Wu et al. (Wu et al., 2017) trained a deep
convolutional neural network in order to produce both
BI-RADS and two super-class classification. Fonseca
et al. (Fonseca et al., 2017) used a HT-L3 Network
to extract features to be fed to Support Vector Ma-
chine. In this paper, we propose a residual convolu-
tional neural network to perform BI-RADS classifica-
tion.
2 MATERIALS AND METHODS
2.1 Data Collection
In order to have a sufficient number of digital
mammographic exams, the “Azienda Ospedaliero-
Universitaria Pisana” collected 1962 mammographic
exams (7848 images/single projections) from the
Senology Department. The dataset has been collected
and classified by a radiologist, specialized in mam-
mography, with the support of a radiology technician.
The chosen selection criteria are:
• All exam reports were negative. Where possible,
the later mammographic exam in medical records
has been examined to verify the current health
state of the woman.
• Badly exposed X-ray mammograms have not
been collected.
• Only women with all the four projections usually
kept in mammography (craniocaudal and medio-
lateral oblique of left and right breast) have been
chosen.
Moreover, the mammographic imaging sys-
tems used were GIOTTO IMAGE SDL, SELE-
NIA DIMENSIONS, GE Senograph DS VER-
SION ADS 54.11 and GE Senograph DS VERSION
ADS 53.40 (Table 1).
Table 1: Mammographic imaging systems as reported in
DICOM files.
IMAGING SYSTEM EXAMS
Giotto Image SDL 230
Selenia Dimensions 50
GE Senograph ADS 54.11 121
GE Senograph ADS 53.40 1561
TOTAL 1962
The mammographic exams were provided in DI-
COM image format. Each exam includes the four
standard mammographic projections.
2.2 Network Model
In order to train, fit and evaluate the CNNs, Keras
(Chollet, 2018) has been used. Keras is an API writ-
ten in Python with Tensorflow in backend. In order to
Residual Convolutional Neural Networks for Breast Density Classification
259
make these exams readable to Keras, they have been
converted in the Portable Network Graphics (PNG)
format in 8 bits, maintaining the original size. Even if
the exams have been acquired in 12 bits, they had to
be converted in 8 bits because Keras does not support
12 or 16 bits images. All the PNG images has been
controlled one by one and automatically divided ac-
cording to the density class and the mammographic
projections. We present a model based on a very
deep residual convolutional neural network (He et al.,
2015). The architecture is the same for both two
super-classes classification and BI-RADS classifica-
tion. The architecture was made of 41 convolutional
layers, organized in residual blocks, and it had about
2 millions learnable parameters. The input block con-
sists of a convolutional layer, a batch normalization
layer (Ioffe and Szegedy, 2015), a leakyReLU as ac-
tivation function and a 2D-max pooling. The output
of this block has been fed into a series of four blocks,
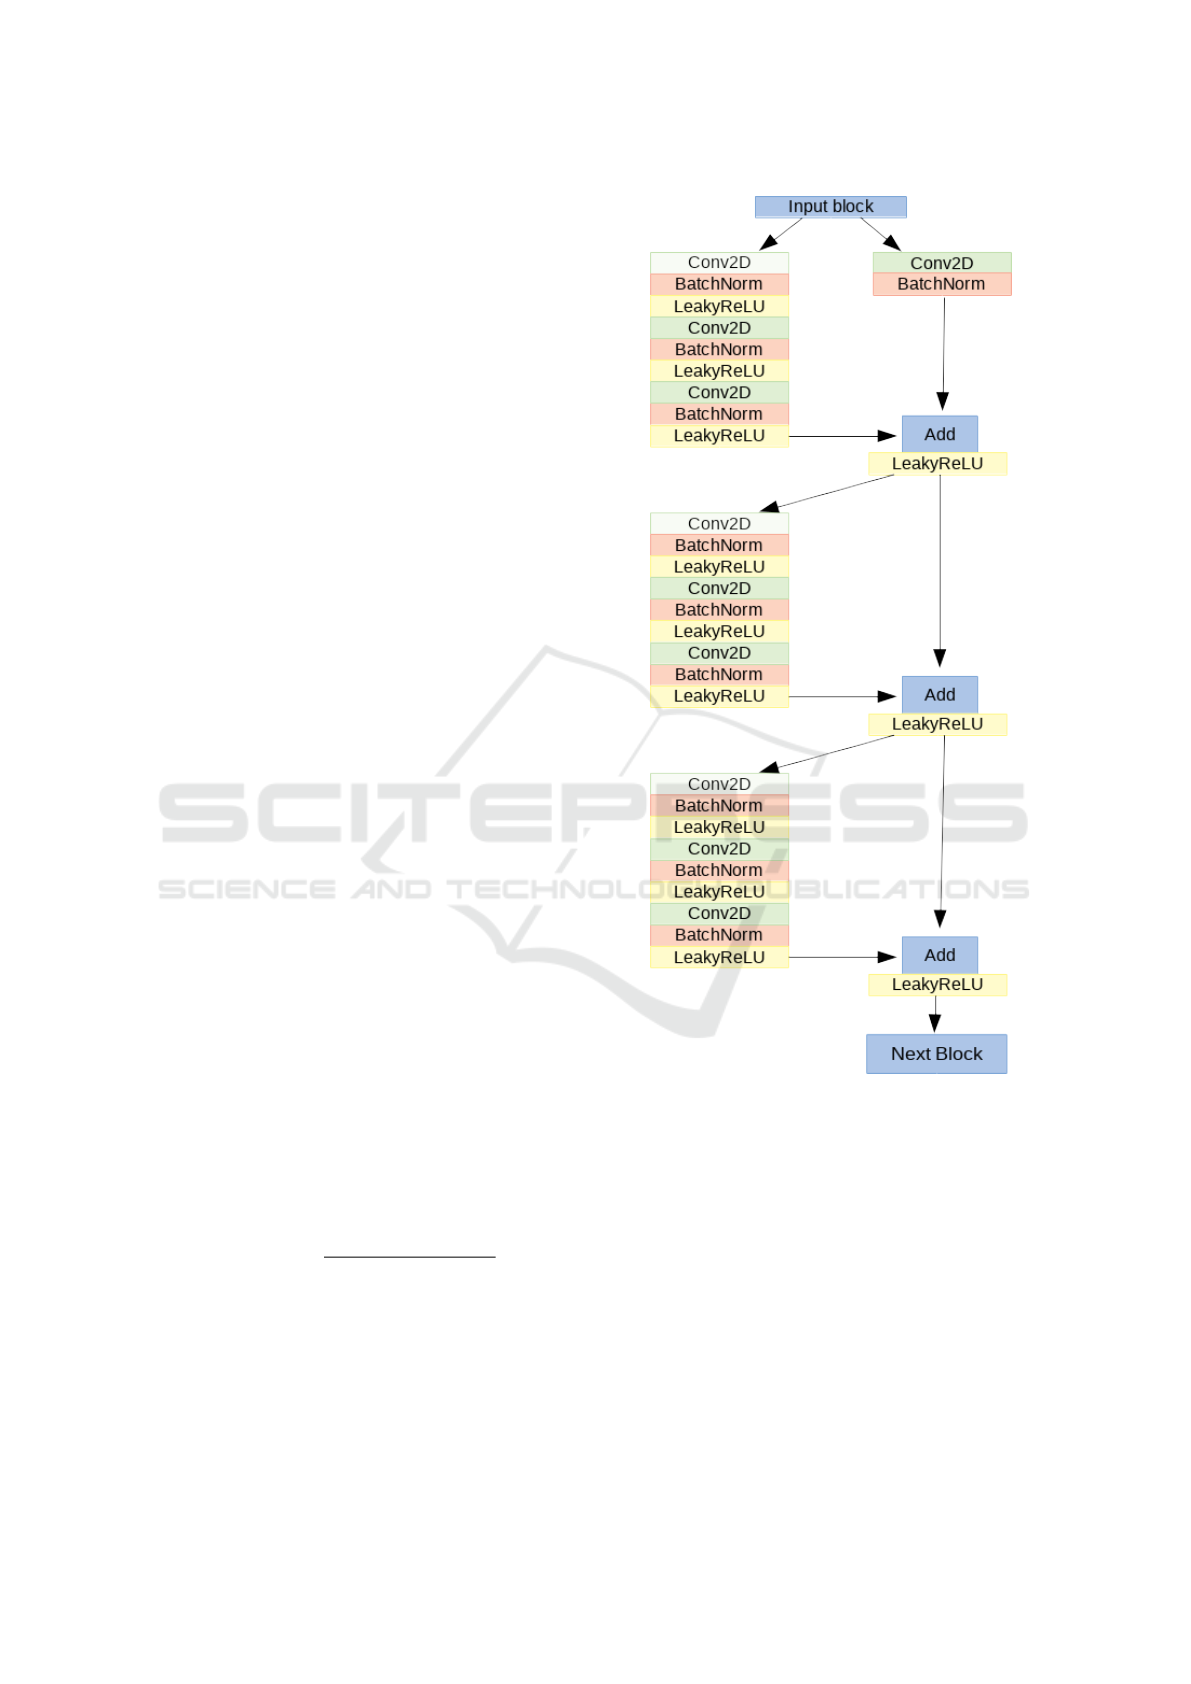
each made of 3 residual modules. In Figure 2, the
architecture of one of the four block is shown.
The input of each of the four blocks is shared by
two branches: in the first, it passes through several
convolutional, batch normalization, activation and
max pooling layers while in the other branch it passes
through a convolutional layer and a batch normaliza-
tion only. The outputs of these two branches are then
added together to constitute the residual block pre-
viously proposed by He et al. (He et al., 2015). The
sum goes through a non-linear activation function and
the result passes through two identical modules. The
architecture of the left branch of these last modules
is the same of the first one. In the right branch, in-
stead, no operation is performed. At the exit of the
module, the two branches are summed together. At
the end of the network, the output of the last block
is fed to a global average pooling and to a fully-
connected layer with a softmax as activation function.
For both the problems, the optimizer is a Stochastic
Gradient Descent (SGD), all the activation functions
are leakyReLU (α = 0.2), the loss function is a cate-
gorical cross-entropy and the performance measure is
the accuracy. The accuracy measures the capability of
the network to predict the right label on test mammo-
grams and it is defined as:
Accuracy =
T P + TN
T P + TN + FP + FN
(1)
where TP is the number of true positive, TN the num-
ber of true negative, FP the number of false positive
and FN the number of false negative. The training
has been performed in mini-batches of 8 images. In
Table 2, the optimized hyperparameters that are equal
for all the network are reported. The CNN has been
trained for 100 epochs and the reported results refer to
Figure 2: One of the four blocks made of 3 residual blocks.
the epoch with the best validation accuracy. In order
to consider all the four projections related to a sub-
ject, four CNNs have been separately trained. The
final breast density assessment has been produced by
an overall evaluation of the four mammographic pro-
jections related to a subject. The number of samples
per class in the dataset has been rescaled in order to
respect the distribution of classes reported on the BI-
RADS Atlas (Figure 3) (Sickles et al., 2013).
2.2.1 Two Super-classes Classification
In BI-RADS standard, the discrimination between
dense and non-dense breast means to classify two
BIOINFORMATICS 2019 - 10th International Conference on Bioinformatics Models, Methods and Algorithms
260
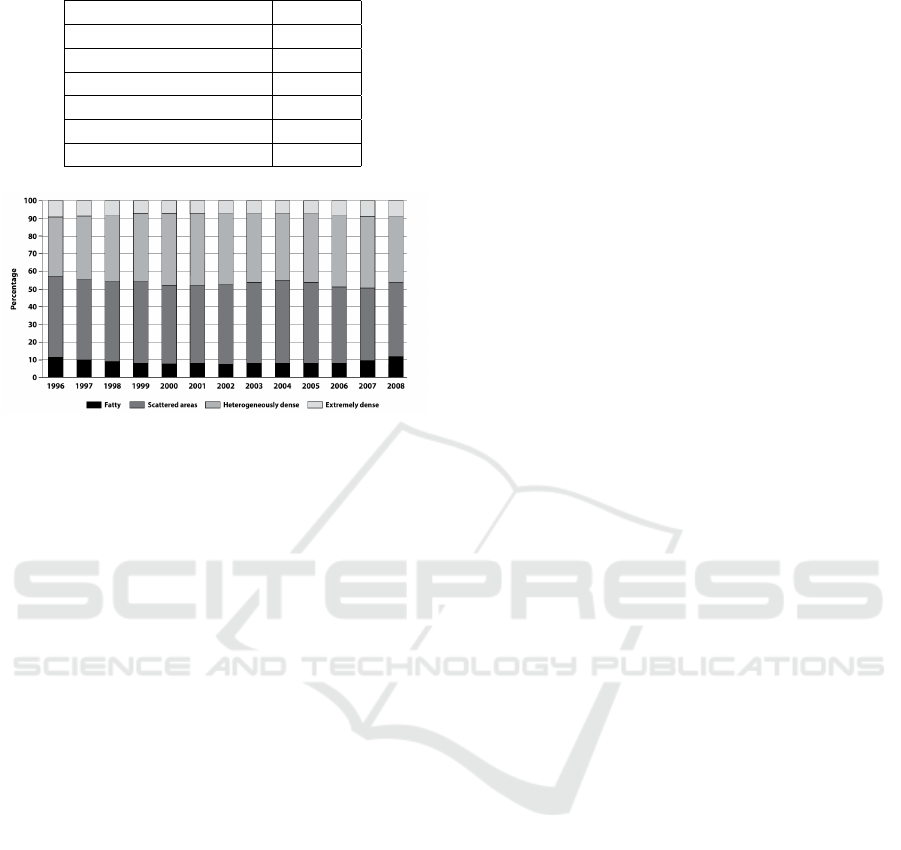
Table 2: Chosen Hyperparameters.
HYPERPARAMETER VALUE
Batch size 8
LeakyReLU alpha 0.2
Learning Rate (LR) 0.1
LR decay 0.1
SGD momentum 0.9
Nesterov True
Figure 3: BI-RADS density classes distribution of 3865070
screening mammography examinations over 13 years
(1996-2008).
“super-classes”, the one made of mammograms be-
longing to A and B classes and the other made of C
and D classes. This problem has a clinical relevance
since a woman with a dense breast should be exam-
ined more carefully. The AOUP dataset has been ran-
domly divided in training set (1356 exams), valida-
tion set (120 exams) and test set (120 exams). Four
CNNs have been trained on the four different mam-
mographic projections. The classification scores of
the last layers of each CNN have been averaged in
order to produce a label that takes into account all
the images related to a single subject. Furthermore,
different input image sizes have been explored in or-
der to understand whether there is a dependence of
accuracy on the image input size. So, seven differ-
ent CNNs per projection have been trained with im-
ages with dimensions ranging from 250x250 pixels to
850x850 pixels.
2.2.2 BI-RADS Classification
The dataset has been randomly divided in training set
(1170 exams), validation set (150 exams) and test set
(150 exams). Since breast density is an overall evalu-
ation of the projections, if a density asymmetry oc-
curs between the left and right breast, the radiolo-
gist assigns the higher class of that subject. To re-
produce such behaviour, the classification scores have
been averaged separately for right and left breast and,
if asymmetry occured, the higher class has been as-
signed to the woman.
2.3 Computing Power
The hardware has been made available by INFN and
consists in:
• CPUs: 2x 10 cores Intel Xeon E5-2640v4 @2.40
GHz;
• RAM: 64 GB;
• GPUs: 4x nVidia Tesla K80, with 2x GPUs Tesla
GK210, 24 GB RAM and 2496 CUDA cores
each;
3 RESULTS
The results for the CNN trained on the dense/non-
dense problem are reported in Table 3. The best test
accuracy over all the four projections is reached by
650x650 pixel images and it is equal to 89.4% (chance
level for a two-class classification problem equal to
50%). Furthermore, there are no evidence of remark-
able accuracy trend over input image size.
In Table 4, the results of the training on the four
BI-RADS classes are reported. The values of the ac-
curacy refer to the label assigned with the rule ex-
plained above. The maximum accuracy is obtained
for images of 650x650 pixels size and it is equal
to 78.0% (chance level for a two-class classification
problem equal to 25%). As above, there is not a clear
trend of the accuracy over input image size.
4 DISCUSSION
Regarding the dense/non-dense problem, the convolu-
tional neural network trained on 650x650 pixels im-
ages predicts the right label with an accuracy equal
to 89.4%, which is the best test accuracy obtained in
this task to our knowledge. Compared to the previ-
ous work of Wu et al. (Wu et al., 2017), the per-
formance on the two “super-class” problem is com-
parable. In fact, Wu et al. reached a test accuracy
equal to 86.5% with their whole dataset, which con-
sisted in about 200000 exams. Since Wu et al. (Wu
et al., 2017) studied how the accuracy changed over
the number of samples in the training set, we can com-
pare our results with theirs obtained on the 1% of their
dataset. In that case they obtained a test accuracy
equal to 84.9% which is lower than the one reached
in this work. Regarding the BIRADS classification,
we obtained a test accuracy on 650x650 pixel images
equal to 78.0%. This result is comparable with re-
spect to the one achieved by previous works. Fonseca
et al. (Fonseca et al., 2017) reached an accuracy of
Residual Convolutional Neural Networks for Breast Density Classification
261
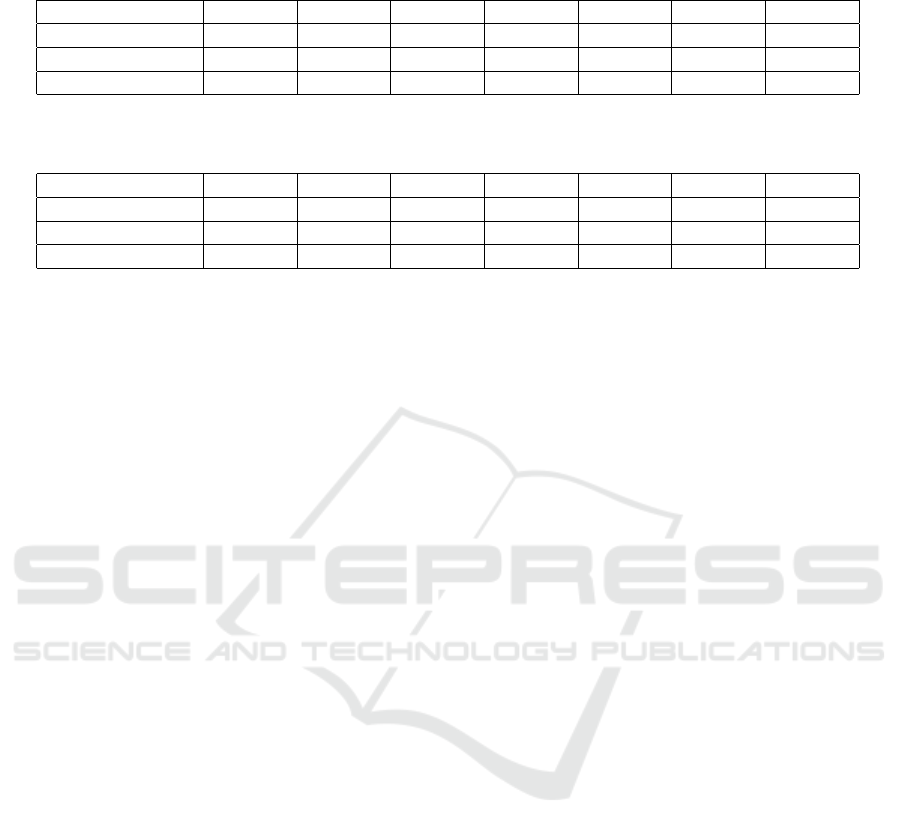
Table 3: Accuracy means over different projections for dense/non-dense problem. BV = mean calculated using classification
scores at the epoch of Best Validation accuracy.
Input size 250x250 350x350 450x450 550x550 650x650 750x750 850x850
Right breast (BV) 86.3% 90.6% 84.4% 86.9% 88.8% 85.6% 86.3%
Left breast (BV) 86.9% 85.6% 85.0% 85.0% 85.0% 85.0% 86.9%
All proj (BV) 86.3% 86.9% 84.4% 85.6% 89.4% 87.5% 86.3%
Table 4: Accuracy means over different projections for BI-RADS problem. BV = mean calculated using classification scores
at the epoch of Best Validation accuracy.
Input size 250x250 350x350 450x450 550x550 650x650 750x750 850x850
Right breast (BV) 74.7% 76.7% 74.7% 72.7% 77.3% 76.0% 72.7%
Left breast (BV) 72.7% 70.7% 72.0% 68.7% 74.7% 72.7% 72.0%
All proj (BV) 76.0% 76.7% 74.0% 73.3% 78.0% 75.3% 72.0%
76% by training their HT-L3 network on about 1000
exams. Wu et al. (Wu et al., 2017) reached an ac-
curacy equal to 76.7%, by using their whole dataset.
We are aware that a correct comparison can only be
made using the same dataset. However, a validated
and shared mammographic dataset is not available
yet. The test accuracy of our approach can be further
increased by implementing some technological and
methodological improvements. First, the considered
ground truth is represented by the density assessment
made by one radiologist only. Since the intra-observer
and inter-observer variabilities are quite high in BI-
RADS classification (Ekpo et al., 2016), we could
produce a ground truth using the maximum agreement
between more than one radiologist. In fact, especially
for mammograms belonging to B and C classes, the
assessment produced by only one physician can be
considered as a confusing factor. Second, we are go-
ing to increase the size of our dataset by collecting
a huge number of screening mammographic exams
from “Azienda USL Nord-Ovest Toscana” (ATNO).
Third, we are going to use more powerful GPUs,
which will allow us to improve the size of the im-
ages used as input of the CNNs and study whether
and how the accuracy changes. Furthermore, we are
aware that relevant information may be lost in the
conversion from 12 to 8 bits. For this reason we are
going to work directly with Tensorflow and use im-
ages at full depth. Moreover, a way to improve ac-
curacy may be the possibility to build a model able
to take as input the four mammographic projections,
related to one subject, that would be merged together
into the CNN architecture. Finally, a cross-validation
process could be done to validate this classifier and to
estimate the performance variability and the stability
of the parameters.
5 CONCLUSIONS
In this paper, a residual convolutional neural network
to classify mammograms density has been presented.
First, the AOUP collected a dataset of 1962 mammo-
graphic exams from the Senology Department. Fur-
ther, a CNN has been trained in order to discriminate
between non-dense and dense breasts, represented re-
spectively by exams belonging to A and B classes,
and exams belonging to C and D classes. The highest
test accuracy is equal to 89.4%. This result is very
good compared to the one achieved by Wu et al. (Wu
et al., 2017). Finally, a residual convolutional neural
network has been trained in order to classify mam-
mograms in the four BI-RADS standard classes. The
best test accuracy is equal to 78.0%, which is com-
parable with respect to the one achieved by previ-
ous works. This work demonstrates that breast den-
sity can be successfully analyzed with residual con-
volutional neural networks and opens several perspec-
tives on this research field. Indeed, new techniques of
image processing can be explored in order to obtain
higher accuracy and to include more samples in the
dataset. Futhermore, it can help in the evaluation of
biomarkers to predict breast cancer, being able to an-
alyze the huge amount of data that can be collected
from screening programs. We are going to collect, in
fact, a high number of mammographic exams from
Tuscany screening program along with information
gathered through a questionnaire on known risk fac-
tors of breast cancer.
ACKNOWLEDGEMENTS
This work has been partially supported by the RA-
DIOMA Project, funded by Fondazione Pisa, Tech-
nological and Scientific Research Sector, Via Pietro
BIOINFORMATICS 2019 - 10th International Conference on Bioinformatics Models, Methods and Algorithms
262

Toselli 29, Pisa. We would like to thank Giulia Fe-
riani and Sharon Gruttadauria for the contribution to
the realization of the dataset.
REFERENCES
Alonzo-Proulx, O., Mawdsley, G. E., Patrie, J. T., Yaffe,
M. J., and Harvey, J. A. (2015). Reliability of au-
tomated breast density measurements. Radiology,
275(2):366–376.
Chollet, F. (2018). Keras documentation.
Ciatto, S., Houssami, N., Apruzzese, A., Bassetti, E., Bran-
cato, B., Carozzi, F., Catarzi, S., Lamberini, M., Mar-
celli, G., Pellizzoni, R., Pesce, B., Risso, G., Russo,
F., and Scorsolini, A. (2005). Categorizing breast
mammographic density: intra- and interobserver re-
producibility of BI-RADS density categories. The
breast, 14(4):269–275.
D. R. Dance, S. Christofides, I.D. McLean, and A.D.A.
Maidment, K.H. Ng (2014). Diagnostic Radiology
Physics: A Handbook for Teachers and Students.
Ekpo, E. U., Ujong, U. P., Mello-Thoms, C., and McEn-
tee, M. F. (2016). Assessment of Interradiologist
Agreement Regarding Mammographic Breast Den-
sity Classification Using the Fifth Edition of the BI-
RADS Atlas. American Journal of Roentgenology,
206(5):1119–1123.
Euratom (2013). Council directive 2013/59/euratom
of 5 december 2013 laying down basic safety
standards for protection against the dangers aris-
ing from exposure to ionising radiation, and re-
pealing directives 89/618/euratom, 90/641/euratom,
96/29/euratom, 97/43/euratom and 2003/122/eu-
ratom. page 73.
Fonseca, P., Casta
˜
neda, B., Valenzuela, R., and Wainer,
J. (2017). Breast density classification with convo-
lutional neural networks. In Beltr
´
an-Casta
˜
n
´
on, C.,
Nystr
¨
om, I., and Famili, F., editors, Progress in Pat-
tern Recognition, Image Analysis, Computer Vision,
and Applications, volume 10125, pages 101–108.
Springer International Publishing.
He, K., Zhang, X., Ren, S., and Sun, J. (2015). Deep resid-
ual learning for image recognition. Conference on
Computer Vision and Pattern Recognition (CVPR).
International Agency for Research on Cancer (2018).
http://gco.iarc.fr/today/home.
Ioffe, S. and Szegedy, C. (2015). Batch normalization: Ac-
celerating deep network training by reducing internal
covariate shift. arXiv:1502.03167.
Krishnan, K., Baglietto, L., Stone, J., Simpson, J. A., Sev-
eri, G., Evans, C. F., MacInnis, R. J., Giles, G. G.,
Apicella, C., and Hopper, J. L. (2017). Longitudinal
study of mammographic density measures that predict
breast cancer risk. 26(4):651–660.
Loberg, M., Lousdal, M. L., Bretthauer, M., and Kalager,
M. (2015). Benefits and harms of mammography
screening. Breast Cancer Res. 2015;17:63., 17(1).
McCormack, V. A. (2006). Breast density and parenchy-
mal patterns as markers of breast cancer risk: A meta-
analysis. Cancer Epidemiology Biomarkers & Pre-
vention, 15(6):1159–1169.
Miglioretti, D. L., Lange, J., van den Broek, J. J., Lee,
C. I., van Ravesteyn, N. T., Ritley, D., Kerlikowske,
K., Fenton, J. J., Melnikow, J., de Koning, H. J., and
Hubbard, R. A. (2016). Radiation-induced breast can-
cer incidence and mortality from digital mammogra-
phy screening: A modeling study. Annals of Internal
Medicine, 164(4):205.
Sickles, E., D’Orsi, C., and Bassett, L. e. a. (2013). ACR
BI-RADS
R
atlas, breast imaging reporting and data
system.
Sottocornola, C., Traino, A., Barca, P., Aringhieri, G.,
Marini, C., Retico, A., Caramella, D., and Fantacci,
M. E. (2018). Evaluation of dosimetric properties in
full field digital mammography (ffdm) - development
of a new dose index. In Proceedings of the 11th Inter-
national Joint Conference on Biomedical Engineering
Systems and Technologies - Volume 1: BIODEVICES,,
pages 212–217. INSTICC, SciTePress.
Traino, A. C., Sottocornola, C., Barca, P., Marini, C.,
Aringhieri, G., Caramella, D., and Fantacci, M. E.
(2017). Average absorbed breast dose in mammogra-
phy: a new possible dose index matching the require-
ments of the european directive 2013/59/EURATOM.
European Radiology Experimental, 1(1).
Wu, N., Geras, K. J., Shen, Y., Su, J., Kim, S. G., Kim,
E., Wolfson, S., Moy, L., and Cho, K. (2017). Breast
density classification with deep convolutional neural
networks. arXiv:1711.03674.
Residual Convolutional Neural Networks for Breast Density Classification
263
