
Market Power in Emissions Trading and Renewable Energy Policy
Mari Ito and Ryuta Takashima
Department of Industrial Administration, Tokyo University of Science, Chiba, Japan
Keywords:
Cap-and-Trade, Renewable Portfolio Standards, Market Power, Social Welfare, Electricity Price.
Abstract:
Policies for reducing greenhouse gas emissions, e.g., cap-and-trade (C&T) as emissions permits trading and
renewable portfolio standards (RPS) as renewable energy policies, have recently been introduced in various
countries. In this study, we examine market equilibria under C&T and RPS in a bi-level optimization frame-
work. For the lower level, generation of outputs of renewable and non-renewable sectors and electricity prices
are decided by maximizing their profits. For the upper level, the policy maker chooses optimal policy level in
an attempt to maximize the social welfare. Our results indicate that C&T is the best scheme for both increasing
social welfare and reducing greenhouse gas emissions.
1 INTRODUCTION
In recent years, greenhouse gas emissions (i.e., car-
bon dioxide (CO
2
) and methane) have been impli-
cated as contributing to global warming. A number
of measures to control those emissions have been pro-
posed in various countries. IEA (2018) examines the
effectiveness of policy and support scheme for renew-
able energy in various countries. The support and
target schemes have increased generation capacity of
renewables significantly: in 2010, 61 countries had
a feed-in tariff (FIT), renewable portfolio standards
(RPS) or auction system in place. Additionally, by
2017, the scheme had expanded to 121 countries, not
only in US and EU but also in Asia and Sub-Saharan
Africa.
Two commonly implemented policy instruments
are the cap-and-trade (C&T) scheme and a policy for
promoting renewable energy technologies known as
RPS. Under C&T, CO
2
emission quotas are set for
each country, region, or sector. The non-renewable
energy sectors are required to achieve CO
2
reduc-
tions. Some sectors are successful, exceeding CO
2
emission quotas. By contrast, there are unsuccess-
ful ones. C&T is a system of trading through a mar-
ket where successful and unsuccessful sectors buy
to cover shortages or sell excess capacity emissions
quotas. By contrast, RPS requires a certain percent-
age of electricity generation to originate from renew-
able energy sources. In most cases, producers are
allowed to meet RPS by self-generation, procuring
power from renewable energy sources via bi-lateral
contracts, and purchasing renewable energy certifi-
cates/credits (RECs) from secondary markets. The
REC price is endogenously determined by supply and
demand conditions in the REC market.
Some countries have introduced C&T and
RPS (ICAP, 2017; REN21, 2017). We assume that
C&T and RPS are both adequate policy schemes
viewed from the aspect of CO
2
reductions, but we do
not know which is preferable and how each one im-
pacts social welfare. Hibiki and Kurakawa (2013) dis-
cussed whether FIT or RPS as renewable energy poli-
cies is preferable from the aspect of social welfare.
Their findings indicated that governments should in-
troduce RPS when marginal damage cost is relatively
high. They did not evaluate whether C&T as emis-
sions permits trading or RPS as renewable energy
policies is preferable from the aspect of social wel-
fare.
Market power in the electricity market greatly in-
fluences electricity prices and production (Siddiqui et
al., 2016). Modeling market power in electricity mar-
kets using a Cournot oligopoly structure has already
been done. For example, Siddiqui et al. (2016) ana-
lyze market power in electricity markets under RPS.
The result of their research showed welfare losses
are actually higher when there is less potential for
exercising market power. Tanaka and Chen (2012)
analyze the impact of C&T on the electricity mar-
ket. They show the relationship between emission
cap levels and market equilibrium, however they do
not show socially optimal emission cap, to be given
exogenously as parameters.
Ito, M. and Takashima, R.
Market Power in Emissions Trading and Renewable Energy Policy.
DOI: 10.5220/0007470304290434
In Proceedings of the 8th International Conference on Operations Research and Enterprise Systems (ICORES 2019), pages 429-434
ISBN: 978-989-758-352-0
Copyright
c
2019 by SCITEPRESS – Science and Technology Publications, Lda. All rights reserved
429

Our study develops an analytical model to deter-
mine an optimal policy level in a Cournot oligopoly
structure for both C&T and RPS. We extend the
model of Tanaka and Chen (2012) by considering the
optimal policy level (i.e., the rate of emission cap
and the rate of RPS). All sectors may then strategi-
cally determine output quantities to maximize prof-
its. We then apply the model to analyze a relation-
ship between market equilibria and energy and envi-
ronmental policy as C&T and RPS. Thus, the analyt-
ical model is used to generate contestable hypothe-
ses, while the numerical experiment gives us a more
meaningful and intuitive interpretation of the results.
We highlight the effect on electricity prices, social
welfare, and CO
2
emissions under C&T and RPS.
The following findings are provided in this pa-
per. Under C&T, the electricity price influences re-
newable energy generation. Electricity prices are high
because of low levels of non-renewable energy gener-
ation. The social surplus of C&T’s electricity market
becomes relatively large. C&T directly controls CO
2
emissions. Under RPS, renewable energy generation
decreases along with non-renewable energy genera-
tion. Electricity prices are low due to the high level of
renewable energy generation. RPS does not control
CO
2
emissions comparatively because non-renewable
energy generation also increases when renewable en-
ergy generation increases.
The remaining part of this paper is organized as
follows: Section 2 introduces one single-level model
and two bi-level models. After laying out our numer-
ical data in Section 3, we use the proposed model to
conduct experiments. Section 4 contains concluding
remarks along with suggestions for future research.
2 MODEL
In this study, we assume that there are one renewable
energy sector and two non-renewable energy sectors
possessing thermal power in the electricity industry.
We adopt a complementary approach to the mod-
els’ interaction between a deregulated electricity in-
dustry and a policymaker by assuming that the poli-
cymaker’s objective is to maximize social welfare in-
clusive of damages. In order to explore the variation
of outcomes, we allow for the following market set-
tings:
Benchmark Setting (BM). This benchmark
setting has a policymaker operating all power
plants in order to maximize social welfare,
considering damage from emissions. This
setup results in a single-level program.
C&T. The C&T is a market-based scheme for
reducing the emission of CO
2
effectively in a
region. Policymaker imposes upper-limit of
the emissions, that is, “cap” on power pro-
ducers. The power producers then trade a
difference between the upper-limit and actual
emissions in the market of the emission per-
mit. If actual emission for a power producer
is fewer (more) than upper-limit, the producer
might be able to sell (buy) the emission per-
mit. Energy sectors’ decisions at the lower
level are made by price-taking renewable and
non-renewable energy sectors that take the
rate of emission cap as given and maximize
their profits inclusive of emission revenues
or costs, the shadow price of the emission
cap constraint. At the upper level, the policy
maker decides the emission cap percentage in
order maximize social welfare constrained by
the lower level.
RPS. The RPS scheme is one for encourag-
ing power producers to supply a certain min-
imum share of their electricity from renew-
able energy sources. In countries or regions
where the RPS scheme is introduced there is
usually secondary market for REC. If the pro-
ducers can not meet the RPS target, in order
to meet the target they might be able to pur-
chase the certificates in the REC market. En-
ergy sectors’ decisions at the lower level are
made by renewable energy and non-renewable
energy sectors that take the RPS percentage
target as given and maximize their profits in-
clusive of REC revenues or costs determined
by the shadow price of the RPS constraint.
Each sector is dominant and behaves in Cournot
fashion (i.e., it is able to influence the electricity
price). Since we will examine three settings, we de-
note ·
∗
, ·
†
, and ·
⋄
as the optimal values for the decision
variables under BM, C&T, and RPS, respectively.
2.1 Notation
The parameters, and variables adopted in this study
are:
Parameters.
a: Intercept of the linear inverse demand function
(U.S. Dollars/MWh)
b: Slope of the linear inverse demand function
(U.S. Dollars/MWh
2
)
c
1
: Cost of non-renewable energy production 1
(U.S. Dollars/MWh)
ICORES 2019 - 8th International Conference on Operations Research and Enterprise Systems
430

c
2
: Cost of non-renewable energy production 2
(U.S. Dollars/MWh)
c
r
: Cost of renewable energy production (U.S. Dol-
lars/MWh)
r
1
: Emissions factor for non-renewable energy sector
1 (t- CO
2
)
r
2
: Emissions factor for non-renewable energy sector
2 (t- CO
2
)
e
cap
: Emission cap (t-CO
2
)
e
b
1
: Emissions for the non-renewable energy sector 1
determined in benchmark setting (t-CO
2
)
e
b
2
: Emissions for the non-renewable energy sector 2
determined in benchmark setting (t-CO
2
)
k: Rate of increase in the marginal cost of CO
2
emis-
sions (U.S. Dollars/MWh
2
)
Variables.
q
1
: Non-renewable energy 1 production (MWh)
q
2
: Non-renewable energy 2 production (MWh)
q
r
: Renewable energy production (MWh)
p: Electricity price (U.S. Dollars)
p
REC
: Market-clearing price for RECs (U.S. Dol-
lars/MWh)
p
e
: Emission price (U.S. Dollars)
α: Optimal proportion of electricity from renewable
energy (%)
β: Rate of emission cap (%)
e
1
: Emissions of non-renewable energy sector 1 (t-
CO
2
)
e
2
: Emissions of non-renewable energy sector 2 (t-
CO
2
)
For non-renewable and renewable energy sectors,
we assume the quadratic cost functions C
1
(q
1
) =
1
2
c
1
q
2
1
, C
2
(q
2
) =
1
2
c
2
q
2
2
, and C
r
(q
r
) =
1
2
c
r
q
2
r
, which
reflect not only marginal costs of production but also
amortized capital costs. As for the demand side, we
also aggregate consumers’ willingness to pay as a
linear inverse demand function, i.e., p = a − bq (in
U.S. Dollars/MWh), where q = q
1
+ q
2
+ q
r
is total
consumption. We assume that b < c
i
< c
r
< α in
order to ensure that there is an equilibrium and to
capture the general characteristic that renewable en-
ergy has a higher level of costs than non-renewable
energy sources. Here, a > 0 (in U.S. Dollars/MWh)
and b > 0 (in U.S. Dollars/MWh
2
) are the intercept
and slope of the inverse demand function, respec-
tively. The externality from emissions is included
via a damage function that is convex only in its pro-
duction from the non-renewable energy sector, i.e.,
d(q
1
, q
2
) =
1
2
k(q
1
+ q
2
)
2
for k > 0. Other types
of damage functions may be posited but increasing
marginal effects from emissions capture the fact that
atmospheric concentrations of greenhouse gases are
more difficult to reverse in greater abundance. In or-
der to facilitate comparative statics of the resulting so-
lutions, we assume that k > b.
2.2 Benchmark Setting
The benchmark setting selects generation of either
type in order to maximize sectors’ own profits by
solving the following single-level problem:
max
q
1
≥0
π
1
= pq
1
−C
1
(q
1
), (1)
max
q
2
≥0
π
2
= pq
2
−C
2
(q
2
), (2)
max
q
r
≥0
π
r
= pq
r
−C
r
(q
r
). (3)
Eqs. (1)–(3) are transformed to Karush-Kuhn-Tucker
(KKT) conditions because they are convex functions.
0 ≤ q
1
⊥ −a + bq
1
+ c
1
q
1
+ bq ≥ 0, (4)
0 ≤ q
2
⊥ −a + bq
2
+ c
2
q
2
+ bq ≥ 0, (5)
0 ≤ q
r
⊥ −a + bq
r
+ c
r
q
r
+ bq ≥ 0. (6)
We derive optimal generations q
∗
1
, q
∗
2
, and q
∗
r
by
Eqs. (4)–(6). Social welfare is thus defined as fol-
lows:
aq
∗
−
1
2
b(q
∗
)
2
−C
1
(q
∗
1
) −C
2
(q
∗
2
) −C
r
(q
∗
r
)
−d(q
∗
1
+ q
∗
2
).
(7)
We treat the emissions of non-renewable energy in the
benchmark setting e
b
1
and e
b
2
as benchmark parameters
for policies with emissions trading.
2.3 Cap-and-Trade
Lower-level Problem
At the lower level, each sector selects its production
in order to maximize its profit, which consists of rev-
enues from electricity sales minus costs.
max
q
1
,p
e
≥0
π
1
= pq
1
−C
1
(q
1
)− p
e
(r
1
q
1
−βe
b
1
), (8)
max
q
2
,p
e
≥0
π
2
= pq
2
−C
2
(q
2
)− p
e
(r
2
q
2
−βe
b
2
), (9)
max
q
r
≥0
π
r
= pq
r
−C
r
(q
r
). (10)
In Eqs. (8) and (9), non-renewable energy sectors de-
termine production to maintain emission cap (e
cap
)
based on the emissions of non-renewable energy sec-
tor determined in benchmark setting (e
b
i
) and the rate
of emissions cap (β). Eqs. (8)–(10) are transformed
Market Power in Emissions Trading and Renewable Energy Policy
431

to KKT conditions because they are convex optimiza-
tion problems. The emission cap (e
cap
) is defined as
e
cap
= βe
b
1
+ βe
b
2
. Eq. (14) provide the adjustment
conditions in the emissions trading market.
0 ≤ q
1
⊥ −a + bq
1
+ c
1
q
1
+ bq + p
e
r
1
≥ 0, (11)
0 ≤ q
2
⊥ −a + bq
2
+ c
2
q
2
+ bq + p
e
r
2
≥ 0, (12)
0 ≤ q
r
⊥ −a + bq
r
+ c
r
q
r
+ bq ≥ 0, (13)
0 ≤ p
e
⊥ r
1
q
1
+ r
2
q
2
− e
cap
≥ 0. (14)
We derive optimal generation q
†
1
, q
†
2
, and q
†
r
by Eqs.
(11)–(14).
Upper-level Problem
For the upper-level problem, the policymaker selects
the optimal rate of emission cap, β
†
in order to max-
imize social welfare using q
†
1
, q
†
2
, and q
†
r
that are de-
rived at the lower level:
max
β
aq
†
−
1
2
b(q
†
)
2
−C
1
(q
†
1
) −C
2
(q
†
2
)
−C
r
(q
†
r
) − d(q
†
1
, q
†
2
).
(15)
2.4 Renewable Portfolio Standards
Lower-level Problem
At the lower level, each sector selects its production
in order to maximize its profit, which consists of rev-
enues from electricity sales minus costs.
max
q
1
≥0
π
1
= pq
1
−C
1
(q
1
) − αp
REC
q
1
, (16)
max
q
2
≥0
π
2
= pq
2
−C
2
(q
2
) − αp
REC
q
2
, (17)
max
q
r
≥0
π
r
= pq
r
−C
r
(q
r
) + (1 − α)p
REC
q
r
. (18)
In Eqs. (16) and (17), the RPS requirement results in
an extra cost resulting from the obligation to purchase
RECs at the equilibrium REC price, p
REC
(in U.S.
Dollars/MWh). In Eq. (18), the renewable energy sec-
tor earns revenues from RECs in proportion to p
REC
and the RPS constraint. Since each of these problems
is convex, it may be replaced by the KKT conditions.
Hence, the lower-level problem in Eqs. (19)–(22) con-
sists of each sector’s KKT conditions for profit maxi-
mization and the RPS constraint:
0 ≤ q
1
⊥ −a − bq
1
− c
1
q
1
− bq − p
REC
α ≥ 0, (19)
0 ≤ q
2
⊥ −a − bq
2
− c
2
q
2
− bq − p
REC
α ≥ 0, (20)
0 ≤ q
r
⊥ −a − bq
r
− c
r
q
r
− bq
+p
REC
(1 − α) ≥ 0,
(21)
0 ≤ p
REC
⊥ (1 − α)q
r
− αq
1
− αq
2
≥ 0. (22)
In Eq. (22), REC price satisfies REC market settle-
ment condition. We derive optimal generation q
⋄
1
, q
⋄
2
,
and q
⋄
r
through Eqs. (19)–(22).
Table 1: Evaluation conditions.
Intercept of inverse demand function a 100
Slope of inverse demand function b 0.01
Production cost of
non-renewable energy sector 1
c
1
0.026
Production cost of
non-renewable energy sector 2 c
2
0.024
Renewable energy production cost c
r
0.25
Emission factor of
non-renewable energy sector 1 r
1
0.5
Emission factor of
non-renewable energy sector 2 r
2
0.8
Damage cost k [0, 0.1]
Upper-level Problem
At the upper-level problem, the policymaker selects
the optimal RPS proportion, α
⋄
in order to maximize
social welfare using q
⋄
1
, q
⋄
2
, and q
⋄
r
derived at the lower
level:
max
α
aq
⋄
−
1
2
b(q
⋄
)
2
−C
1
(q
⋄
1
) −C
2
(q
⋄
2
)
−C
r
(q
⋄
r
) − d(q
⋄
1
, q
⋄
2
).
(23)
3 NUMERICAL EXAMPLES
In this section, we compare the effect of C&T and
RPS on renewable energy production, market price,
social welfare, and CO
2
emissions using the proposed
model. Table 1 shows the evaluation conditions. The
parameter values are set by reference to Siddiqui et al.
(2016) and Tanaka and Chen (2012).
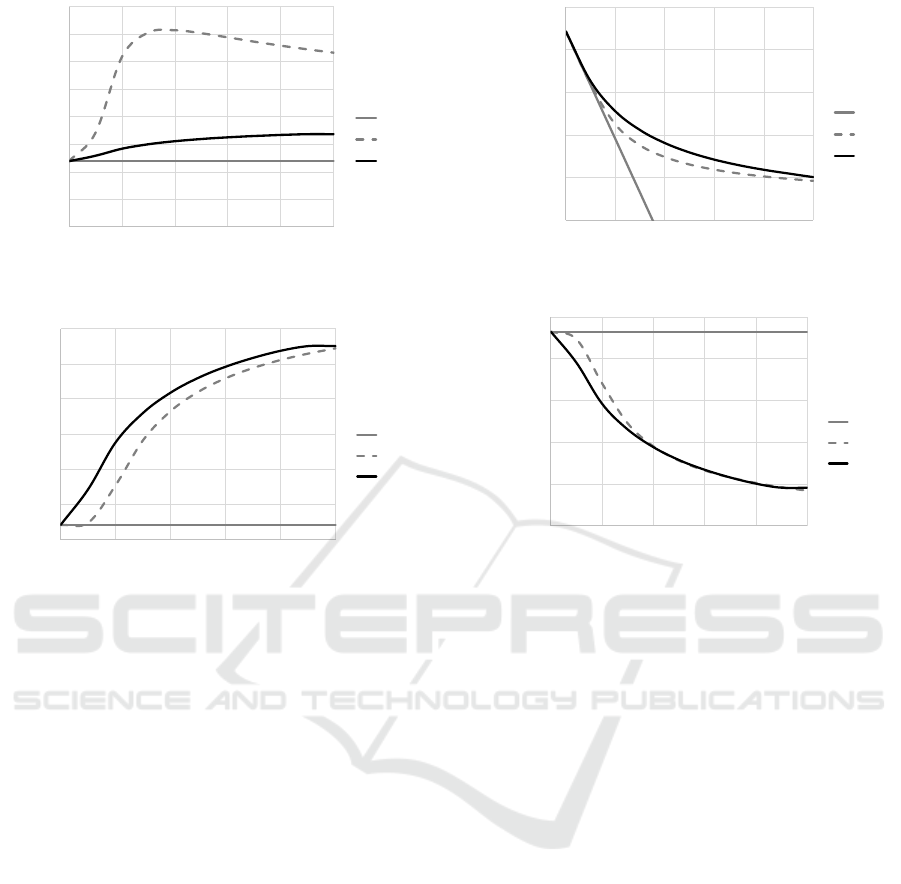
Figure 1 shows the effect of the rate of increase
in the marginal cost of CO
2
emissions, k, on renew-
able energy production, q
r
, under a benchmark set-
ting, C&T, and RPS. In the figure, the benchmark
setting, the emissions trading by cap-and-trade, and
the renewable energy policy as the renewable port-
folio standards are denoted by BM, C&T, and RPS,
respectively.
Renewable energy generation under C&T and
RPS are almost the same as that under BM when k
is low, whereas renewable energy generation under
C&T and RPS increases when k increases. C&T has
directly no influence on renewable energy generation
due to the trading scheme between non-renewable en-
ergy generation. However, renewable energy gener-
ation under C&T has a tendency to increase when k
becomes large. Renewable energy generation under
RPS also increases quickly when k increases. This
outcome might be because RPS is a direct policy of
renewable energy. However, renewable energy gen-
eration decreases after k = 0.03, approximately. In-
tuitively, non-renewable energy generation decreases
ICORES 2019 - 8th International Conference on Operations Research and Enterprise Systems
432
0
100
200
300
400
500
600
700
800
Ͳ
ͲǤͲʹ
ͲǤͲͶ
ͲǤͲ
ͲǤͲͺ
ͲǤͳ
q
r
[MWh]
k [U.S. Dollars/MWh
2
ሿ
BM
RPS
C&T
Figure 1: Renewable energy generation.
60
65
70
75
80
85
90
Ͳ
ͲǤͲʹ
ͲǤͲͶ
ͲǤͲ
ͲǤͲͺ
ͲǤͳ
p [U.S. Dollar/MWh]
k [U.S. Dollars/MWh
2
]
BM
RPS
C&T
Figure 2: Electricity prices.
as k becomes large. Thus the decrease causes small
generation of renewable energy due to characteristic
of RPS scheme.
Figure 2 depicts the effect of the rate of increase
in the marginal cost of CO
2
emissions, k, on electric-
ity prices, p, under BM, C&T, and RPS. Under C&T,
the electricity prices are high because of little non-
renewable energy generation. The renewable energy
sector is unaffected by k increases, using renewable
energy generation to obtain higher profits (see Fig. 1).
Under RPS, the electricity prices are low due to the
higher usage of renewable energy generation.
Figure 3 exhibits the effect of the rate of increase
in marginal cost of CO
2
emissions, k, on social wel-
fare under BM, C&T, and RPS.
Social welfare decreases when k increases due to
the impact of damages from increased CO
2
emissions.
Comparing C&T and RPS, the social welfare attained
from C&T is higher than from RPS. The reason for
this outcome must greatly influence electricity prices
(see Fig. 2). The social surplus of C&T’s electricity
market becomes relatively large.
Figure 4 shows the effect of the rate of increase in
marginal cost of CO
2
emissions, k, on CO
2
emissions,
e, under BM, C&T, and RPS.
On the one hand, C&T and RPS control CO
2
emissions when k increases. CO
2
emissions under
Ͳ
ͷͲͲͲͲ
ͳͲͲͲͲͲ
ͳͷͲͲͲͲ
ʹͲͲͲͲͲ
ʹͷͲͲͲͲ
0 0.02 0.04 0.06 0.08 0.1
Social welfare [U.S. Dollars]
k [U.S. Dollars/MWh
2
]
Ƭ
Figure 3: Social welfare.
Ͳ
ͷͲͲ
ͳͲͲͲ
ͳͷͲͲ
ʹͲͲͲ
ʹͷͲͲ
Ͳ
ͲǤͲʹ
ͲǤͲͶ
ͲǤͲ
ͲǤͲͺ
ͲǤͳ
e
ሾ
Ǧ
ʹ
ሿ
k [U.S. Dollars/MWh
2
]
BM
RPS
C&T
Figure 4: CO
2
emissions.
C&T are lower than that of RPS because C&T is
a policy aiming to directly control CO
2
emissions.
On the other hand, CO
2
emissions under RPS is
higher than those under C&T. RPS does not con-
trol CO
2
emissions as well, by comparison, because
non-renewable energy generation also increases along
with renewable energy generation. This means that
the damage cost for RPS is larger than that for C&T.
Thus, the effects of the damage cost as well as elec-
tricity prices lead to large social welfare for C&T.
4 CONCLUDING REMARKS
In this study, we examine C&T and RPS aimed at
reducing greenhouse gas emissions that cause global
warming. We develop an analytical model for C&T
and RPS and used it to decide the optimum level of
power generation, electricity prices, rate for an emis-
sions cap, and RPS requirement percentage. We an-
alyze how the regulation level affects market equi-
librium. Furthermore, we show how policymakers
should decide the level of regulation for the purpose
of maximizing social welfare. In the end, C&T’s so-
cial welfare turns out being higher than that of the
RPS. Naturally, enforcement of C&T is effective for
controlling CO
2
emissions. From the viewpoint of
Market Power in Emissions Trading and Renewable Energy Policy
433

social welfare and CO
2
reductions, the government
enforces C&T.
We analyze the problem of a simple setting with
two non-renewable energy sectors and one renewable
energy sector in this study. In reality, the number of
sectors and the ratio of renewable energy sectors to
them, differ by country and world region. Future re-
search should extend itself to models where the num-
ber of sectors may be set. We will also extend the
model to introduce the policy mix scheme consisting
of C&T and RPS in order to investigate the interaction
between the schemes.
ACKNOWLEDGMENT
This study was supported in part by the Grant-in-Aid
for Scientific Research (B) (Grant No. 15H02975)
from the Japan Society for the Promotion of Science.
REFERENCES
Hibiki, A. and Kurakawa, Y. (2013). Which is a better sec-
ond best policy, the feed-in tariff scheme or the renew-
able portfolio standard scheme? RIETI Discussion
Paper, 13-J-070, in Japanese.
International carbon action partnership (2017). Emissions
trading worldwide: status report 2017.
International energy agency (2018). Renewables 2018:
analysis and forecasts to 2023, Paris.
Renewable energy policy network for the 21st century
(2017). Renewables 2017 global status report, Paris.
Siddiqui, A.S., Tanaka, M., and Chen, Y. (2016). Are tar-
gets for renewable portfolio standards too low?: The
impact of market structure on energy policy. European
Journal of Operational Research, 250(1), 328–341.
Tanaka, M., and Chen, Y. (2012). Market power in emis-
sions trading: Strategically manipulating permit price
through fringe firms. Applied Energy, 96, 203–211.
ICORES 2019 - 8th International Conference on Operations Research and Enterprise Systems
434
