
Deep Analysis of CNN Settings for New Cancer Whole-slide Histological
Images Segmentation: The Case of Small Training Sets
Sonia Mejbri
1
, Camille Franchet
2
, Reshma Ismat-Ara
1
, Josiane Mothe
1
,
Pierre Brousset
2
and Emmanuel Faure
1
1
Toulouse Institute of Computer Science Research, Toulouse, France
2
The University Cancer Institute Toulouse, Oncopole, France
{Franchet.Camille, Brousset.Pierre}@iuct-oncopole.fr
Keywords:
Breast Cancer, Histological Image Analysis, Convolutional Neural Networks, Deep Learning, Semantic
Segmentation.
Abstract:
Accurate analysis and interpretation of stained biopsy images is a crucial step in the cancer diagnostic rou-
tine which is mainly done manually by expert pathologists. The recent progress of digital pathology gives
us a challenging opportunity to automatically process these complex image data in order to retrieve essential
information and to study tissue elements and structures. This paper addresses the task of tissue-level segmen-
tation in intermediate resolution of histopathological breast cancer images. Firstly, we present a new medical
dataset we developed which is composed of hematoxylin and eosin stained whole-slide images wherein all 7
tissues were labeled by hand and validated by expert pathologist. Then, with this unique dataset, we proposed
an automatic end-to-end framework using deep neural network for tissue-level segmentation. Moreover, we
provide a deep analysis of the framework settings that can be used in similar task by the scientific community.
1 INTRODUCTION
Cancer is still a leading cause of death worldwide.
The detection of breast cancer at an early stage of its
development can help to treat it more easily and pre-
vent the progression of the tumor. It is thus of huge
importance (Torre et al., 2016). When a suspicious le-
sion is detected in the breast during a physical exam-
ination or a mammogram, additional tests are needed
to determine whether it is a cancer or not and, if so,
which kind of cancer it is. During biopsy, pathologists
examine histological structures in order to provide an
accurate diagnosis and several prognostic clues. Prac-
tically, pathologists need not only to observe the en-
tire tissue slide at low magnification but also to nav-
igate through different resolutions to be able to com-
bine architectural and cytological information in or-
der to produce their medical diagnosis. This process
requires a lot of time and concentration and can be
hampered by some inter and intra-individual variabil-
ity (Loukas, 2013).
Latest technological advances in whole slide
imaging and the availability of considerable computa-
tional power have enabled digitizing pathology slides
at microscopic resolution. This process makes pos-
sible the evaluation of breast cancer stained sections
helped by computer vision. These approaches can
guide some of the diagnostic routine tasks in order
to assist pathologists in the medical decision-making
process. This assistance can reduce the workload of
the experts by saving time, reducing costs and, most
importantly, improving diagnostic (Cruz-Roa et al.;
Janowczyk and Madabhushi, 2016). In the context
of breast cancer, several machine learning algorithms
have been developed and applied to increase the ef-
fectiveness in pathological tasks. For instance, re-
searchers have proposed methods to detect nuclei, mi-
tosis (Janowczyk and Madabhushi, 2016) and lym-
phocytes (Janowczyk and Madabhushi, 2016). These
previous studies show several limitations that we ad-
dress in this work. First, images used in the cited
approaches are only small samples of breast cancer
or Tissue Micro Arrays (TMA) histological images
at full resolution (Beck et al., 2011). Each image
captures only a small sample of the full tumor ex-
tend, which is not representative of the whole slides
images (WSIs) used in routine diagnostic pathology.
This problem has partially been addressed by dis-
tinguishing tumor-patches from non-tumor-patches
(Wang et al., 2016). Another limitation is that related
120
Mejbri, S., Franchet, C., Ismat-Ara, R., Mothe, J., Brousset, P. and Faure, E.
Deep Analysis of CNN Settings for New Cancer Whole-slide Histological Images Segmentation: The Case of Small Training Sets.
DOI: 10.5220/0007406601200128
In Proceedings of the 12th International Joint Conference on Biomedical Engineering Systems and Technologies (BIOSTEC 2019), pages 120-128
ISBN: 978-989-758-353-7
Copyright
c
2019 by SCITEPRESS – Science and Technology Publications, Lda. All rights reserved

work studies consider two categories of tissue only
(tumor and non tumor) which is not representative of
the complex structure of histological images. A typ-
ical section of solid tumor is a very heterogeneous
structure. Also a single sub-type of breast cancer car-
cinoma which is Invasive carcinoma (IC) (Cruz-Roa
et al.). Previous studies do not take into account the
non-invasive breast cancer type called ”in situ car-
cinoma” despite its frequency (20 to 25% of newly
diagnosed breast cancers). Reporting the presence
of both invasive and/or in situ carcinoma is a chal-
lenging part of a diagnostic pathology workup since
there is a significant difference of treatment options
of the disease. ion might be crucial to identify areas
where a full resolution analysis should be performed.
There are very few whole slide breast cancer datasets
with pixel-level annotations. Regarding breast can-
cer pathological dataset Spanhol et al introduced The
Breast Cancer Histopathological Image Classification
(BreakHis) wich is composed of 2,480 benign and
5,429 malignant samples of microscopic images of
breast tumor tissue (Spanhol et al.). However, these
two categories of tissues are not enough because it
does not reflect the complexity of tissue diversity. To
tackle this shortcoming, Grand Challenge on Breast
Cancer Histology Images (BACH) had launched an
annotated Whole-slide images dataset (Aresta et al.,
2018). The organization provided 10 pixel-wise anno-
tated regions for the benign, in situ and invasive carci-
noma classes present in a entire sampled tissue which
represent a partially annotated masks. In recent years,
deep learning models, especially convolutional neural
networks (CNNs) (LeCun et al.) have emerged as a
new and more powerful model for automatic segmen-
tation of pathological images. The power of a CNN
based model lies in its deep architecture which allows
for learning relevant features at lower levels of ab-
straction. (Hou et al., 2016) proposed a patch-based
CNN and to train a decision fusion model as a two-
level model: patch-based and image-based model to
classify WSIs into tumor subtypes and grades. Chen
et al. proposed an encoder-decoder architecture to
gland segmentation in benign and malignant (Chen
et al., 2016a). Cruz et al. presented a classification
approach for detecting presence and extent of inva-
sive breast cancer on WSIs using a ConvNet classifier
(Cruz-Roa et al.).
The greatest challenge in the medical imaging do-
main especially in pathology is to deal with small
datasets and limited amount of annotated samples,
especially when employing supervised convolutional
learning algorithms that require large amounts of la-
beled data for the training process. Previous studies
that investigated the problem of breast cancer patho-
logical images analysis, did not provide a proper
quantitative and qualitative parameters evaluation for
training deep CNN from scratch with few annotated
samples only.
Contributions
The contribution of this paper is two folds: first since
there is no publicly available annotated data for this
task we developed a new dataset; second we con-
ducted a set of experiments to evaluated several CNN
architectures and settings on that new type of data.
More precisely, we:
• developped a new dataset of WSIs with different
subtypes of breast cancer. The data set consists in
11 whole-slide images fully annotated.
• proposed a fully automatic framework. We ap-
plied machine learning algorithms to extract the
predictive model, and more precisely, we applied
and adapted a patch-based deep learning approach
on our new dataset. While our model relies on ex-
isting architectures (SegNet (Badrinarayanan and
Kendall, 2017), U-Net (Ronneberger et al.), FCN
(Long et al., 2015) and DeepLab (Chen et al.,
2016b)), the originality of our work resides in a
deep analysis of the parameters of the model.
• conducted several experiments to evaluate the set-
tings of each step of the proposed framework in
order to get the optimal set of parameters when
dealing with this new data for a tissue-level seg-
mentation task.
The paper is organized as follows: in Section 2, we
present the new data set that we built. Section 3
presents the framework we developed as well as an
overview of the experiments and evaluation measures.
Section 4 presents the details of the experiments and
their results. Section 5 provides the main recommen-
dations related to the influence of the model parame-
ters.Section 6 concludes this paper and discusses fu-
ture work.
2 NEW ANNOTATED DATASET
This work involved anonymized breast cancer slides
from the archives of the pathology department of the
Toulouse University Cancer Institute. The breast can-
cer images waere acquired with a Panoramic Digital
Slide Scanners 3DHISTECH. This selection was re-
viewed by an expert pathologist to confirm the pres-
ence of at least one of the two cited categories of car-
cinoma considered in this study. To describe the com-
plexity of the tissue structures present in the image
Deep Analysis of CNN Settings for New Cancer Whole-slide Histological Images Segmentation: The Case of Small Training Sets
121
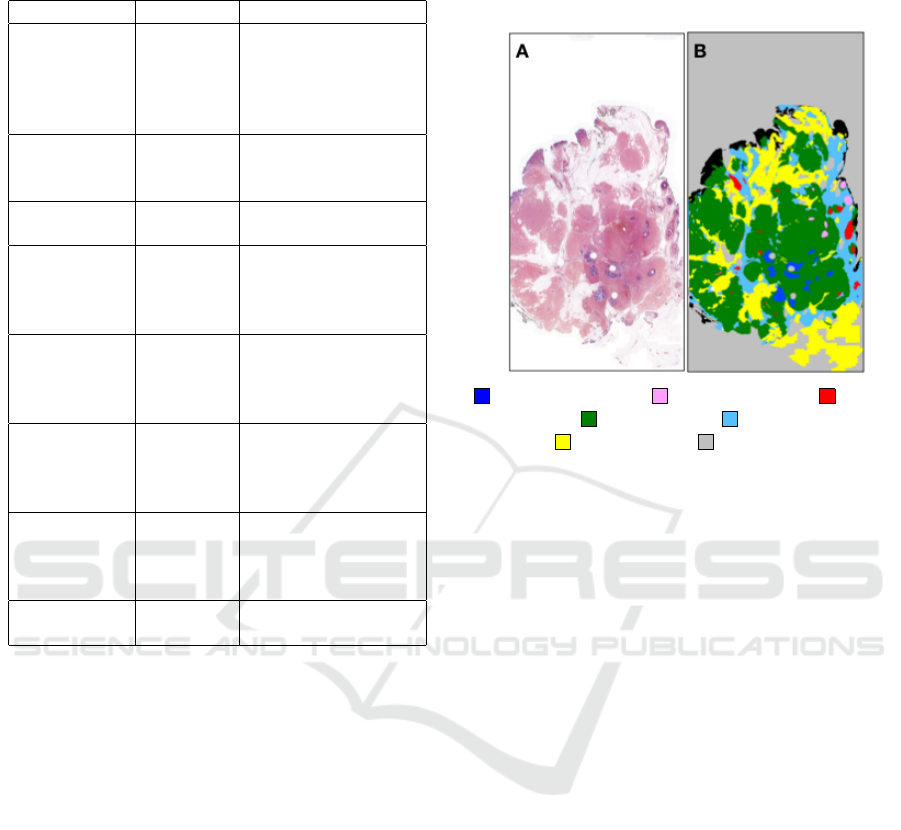
Table 1: Tissues categories characteristics and correspond-
ing average area present in the dataset.
Tissue label Avg. area Tissue description
Invasive car-
cinoma (IC)
8.11% (±
7.2%)
carcinoma that
spreads outside the
ducts and invade the
surrounding breast
tissue.
Ductal Carci-
noma In situ
(DCIS)
0.75%
(±1.89%)
carcinoma confined
to the ducts.
Benign
epithelium
1.77%
(±1.9%)
non-malignant
lesions in the tissue.
Simple
stroma
18.57%
(±8.58%)
homogeneous com-
position, includes
tumor stroma and
fibrosis
Complex
stroma
8.57%
(±6.2%)
heterogeneous com-
position, a mixture of
fibrous and adipose
tissue
Adipose tis-
sue
21.5%
(±11.31%)
monotonous tis-
sue, comprised
mostly of adipocytes,
fat-storing cells.
Artifacts 1.15%
(±1.09%)
random noise due to
the staining proce-
dure and folds of tis-
sue slices
Background 43.96%
(±8.53%)
absence of tissue
of breast cancer, the pathologist selected seven rele-
vant types of tissue which are identified and analyzed
during the biopsy routine of breast cancer pathology
(Table. 1).
To alleviate the burden of manual annotation and
save time and effort for the pathologist to produce
ground truth masks, firstly the annotation of the whole
images was performed by a non-expert with basic
knowledge of the breast cancer histology. During this
process, super-pixels were created using the multi-
resolution segmentation function provided by the im-
age analysis environment Definiens Developer XD
software, and often, there was manual intervention
to modify the shape of the super-pixels in order to
obtain an annotation as accurate as possible. Then,
each super-pixel was manually labeled with the cor-
responding type of tissue. Afterwards, an expert
pathologist validated and corrected the wrongly clas-
sified tissues to finally produce the ground truth multi-
class masks (Figure. 1). We obtained 11 whole-
slide images which have been validated by an expert
pathologist. It should be noted that 6 hours are re-
quired to annotate an entire breast cancer slide with
7+Background classes and about 2 hours for valida-
tion, which underlines the tedious and time-costly na-
ture of this task.
Invasive carsinoma Carsinoma In situ Begnin
epithelum Simple stroma Complex stroma
Adipose tissue Background
Figure 1: (A) is an example of whole-slide pathological im-
age (I1) from the dataset and (B) is its respective manual
annotation provided by an expert pathologist.
3 A FRAMEWORK FOR TISSUE
SEGMENTATION
3.1 Overview of the Framework
The breast cancer segmentation approach we devel-
oped adopts an end-to-end convolutional neural net-
work framework (Figure. 2). In this paper, we have
implemented a machine learning workflow for multi-
class segmentation applied on new WSI images which
can be divided into several steps:
1. Pre-processing: all images are normalized to re-
duce the color variability within the dataset.
2. Learning: patches are randomly extracted from
each image of the training dataset and injected
into the network adapted for multi-class semantic
segmentation.
3. Prediction and reconstruction: After a close ex-
amination of the networks behaviour, we observed
that the accuracy at the border area is not pre-
cise compared to the central area of the patches.
To overcome this problem, we decided that the
test image is downsampled by sliding windows
with a fixed stride. Then, we reassemble all over-
lapped predicted patches by applying a pixel-wise
BIOIMAGING 2019 - 6th International Conference on Bioimaging
122

argmax over all the classes probabilities to obtain
the whole predicted mask.
4. Evaluation: in order to understand and optimize
each step of the framework, we evaluated the out-
come of the framework using segmentation met-
rics.
In section 4, we re-evaluate each step and their associ-
ated parameters in order to characterize this complex
medical task.
3.2 Network Architectures
Inspired from the work of (Long et al., 2015), many
recent studies have shown the effectiveness of fully
convolutional neural networks FCN for this task.
As one of the most popular pixel-level classification
method, the DeepLab models make use of the fully
connected conditional random fields CRF as a post-
treatment step in their work-flow to refine the seg-
mentation result. Deeplab model overcomes the poor
localization property of deep networks by combin-
ing the responses at the final FCN layer with a CRF.
Introducing skip connections has been shown to im-
prove spatial recovery in the decoding features pro-
cess, and assists with gradient flow to decoder path.
The segmentation network SegNet architecture uses
these maxpooling connections to gradually recover
the feature details and size thanks to its symmetrical
architecture. The well-known U-shaped network U-
Net features several steps of downsampling convolu-
tions, followed by upsampling deconvolution layers.
Unlike SegNet, whole feature maps from each down-
sampling layer are passed across the intermediate lay-
ers and concatenated with corresponding upsampling
layers.
3.3 Expriments Setup
Evaluation Metrics. We evaluate the performance
of the evaluated models by measuring the overlap be-
tween automated and manual segmentation. We use
the two following segmentation metrics: the Dice co-
efficient (DC), also called the overlap F1-score, and
the Jaccard index (JI). Global metrics are not always
adequate evaluation measures when class occurrences
are unbalanced, which is the case in most of the medi-
cal applications, since they are biased by the dominant
class(es). To avoid this, the metrics above are usually
evaluated per-class and their result is averaged over
the number of labeled classes.
Training and Implementation Details. All exper-
iments were performed using Keras with tensorflow
backend. We used same-padding in convolutional
layers in all evaluated architectures so output chan-
nels have the same dimensions as the input. We
also used rectified linear units (ReLUs) as activation
function. To reduce the number of parameters and
speed up training, instead of the last fully connected
layer we used a convolutional layer, with the number
of feature maps equal to the number of predicted
classes for the loss function based on the cross
entropy.
In every evaluation, we considered up to 9 im-
ages for the training with a 20% separate validation
split. We used the remaining 2 images to evaluate the
models. We kept these sets of images all along this
study so we could compare our models. Each model
was optimized by Adam (Kingma et al., 2014) for
a pre-determined number of iterations fixed arbitrar-
ily to 10, a batch size of 5 and exponential decaying
learning rate initialized at 1e5. Both classifiers were
trained from scratch.
4 PARAMETERS SETTINGS
For each step of the workflow, we evaluate the pa-
rameters and answer the challenging questions we en-
counter when we started to deal with the new data (see
Figure 2). For our experiments, our review of the lit-
erature convinced us to explore and evaluate two of
the cited above CNN models : U-Net and SegNet.
4.1 Variability of H&E Stained Images
Is a Normalization Step Necessary? Previous
work (Vahadane et al., 2016; Macenko et al.; Sethi
et al.) has shown that the standardization of colors
brings a clear improvement in the results of image
segmentation and proposed color normalization algo-
rithms that standardize image appearance in order to
minimize variability and undesirable artifacts within
the image. As a pre-processing step, we applied two
of the most used normalizations on pathological data:
Macenko normalization, and Vahadane normaliza-
tion. We chose these approaches because initial em-
pirical results showed Macenko-normalized images
obtained high discrimination between the two sub-
types of cancer classes whereas Vahadane-normalized
images showed high differentiation between the ep-
ithelium and non-epithelium classes. One stained im-
age in our dataset was chosen by an expert according
to the quality of its coloring to be a target image and
we normalized the other images into its color appear-
ance. After evaluation of the prediction, we observed
Deep Analysis of CNN Settings for New Cancer Whole-slide Histological Images Segmentation: The Case of Small Training Sets
123
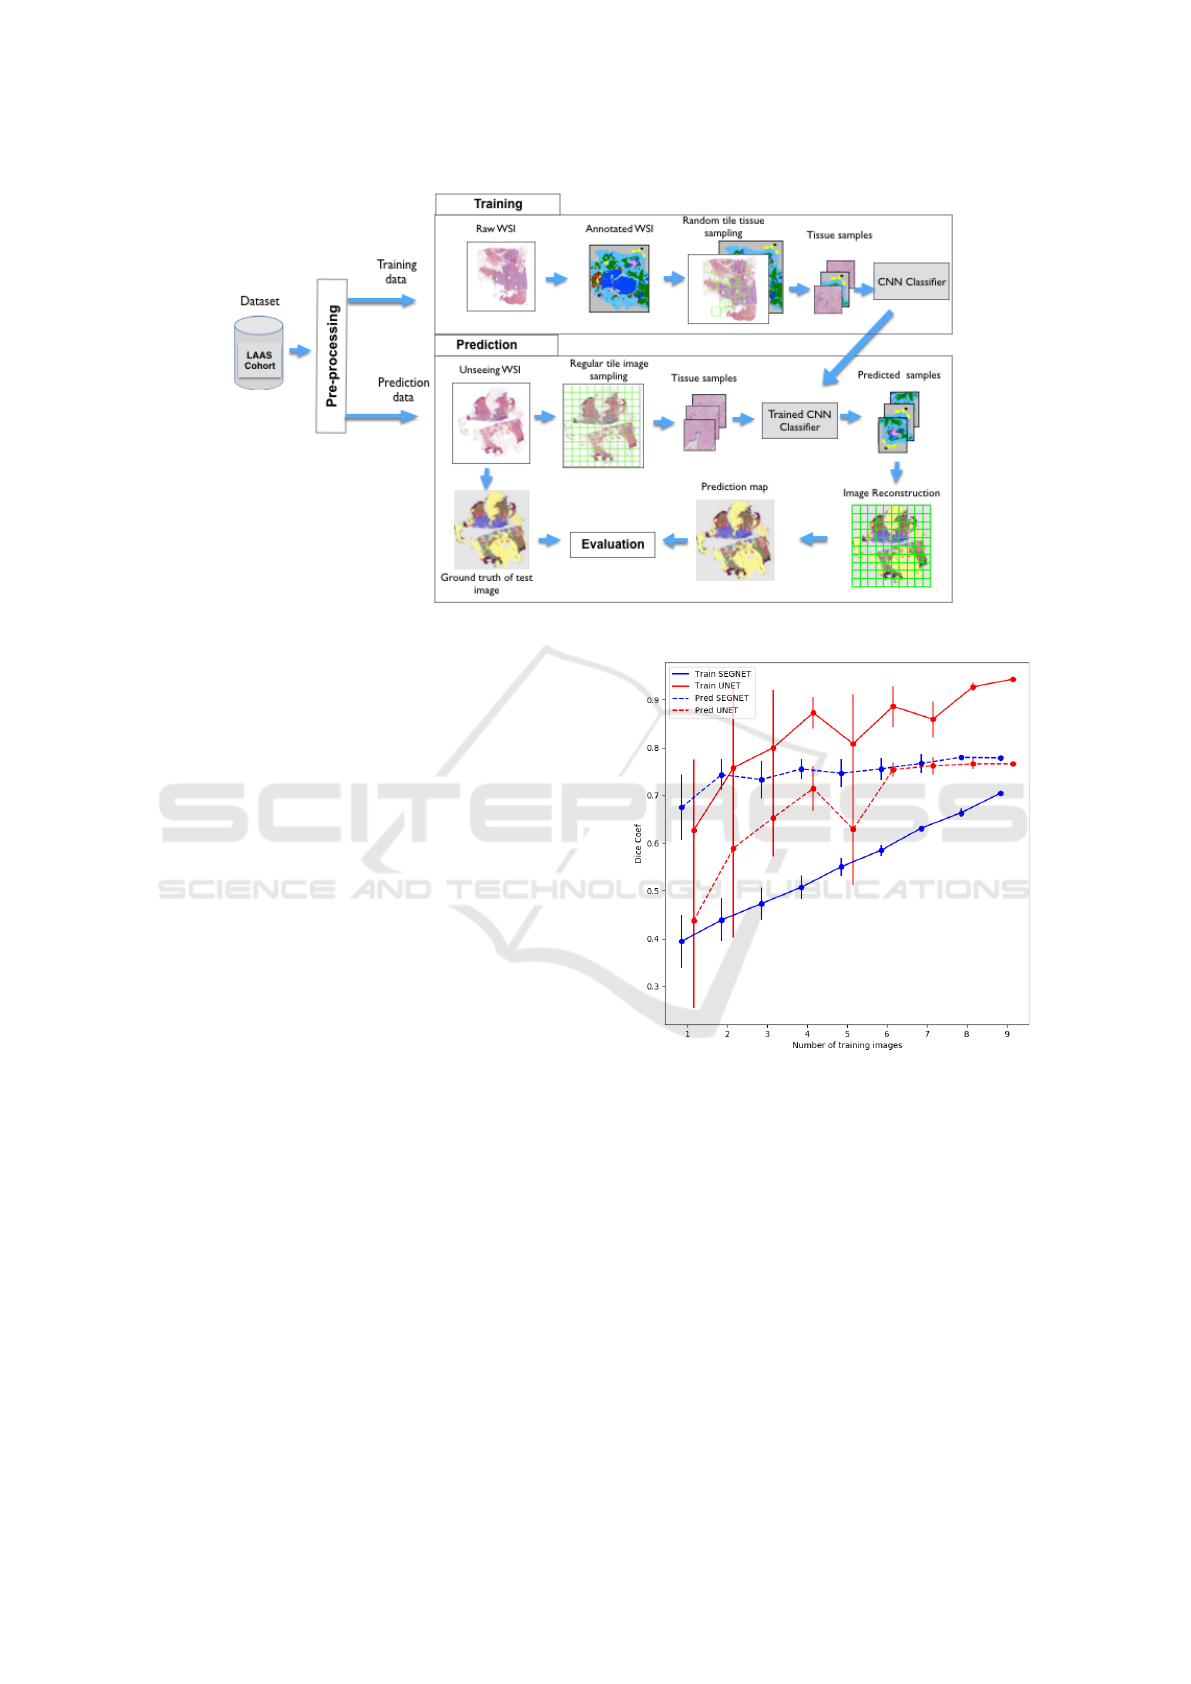
Figure 2: Workflow of the training and test phases of CNN classifiers for breast cancer image segmentation.
that both normalizations slightly improve the results,
specifically the epithelium regions (Table 2).
Does a Large Spectrum of Colors Contribute or
Mislead the Learning Process? Because of the
contrast that appears more strongly in the grayscale,
we wanted to evaluate how well the H&E grayscale
images can improve the performance of our model.
Because gray levels can facilitate the differentiation
of epithelium tissue structures from non-epithelium
structures . However, based on our experiments (Ta-
ble 2), we found that our framework improves the
identification of tissues more on raw RGB normalized
images than on grayscale images. The reason could
be that grayscale images miss some relevant informa-
tion that might be helpful for discriminating between
different tissues with similar nuclei distribution, for
example invasive and in situ classes.
What is the Minimum of Necessary H&E Images
to Represent the Diversity of the Characterized
Tissues? In this section, we answer the following
question: what the minimum amount of data to solve
a semantic segmentation problem by training CNN
from scratch is ? This crucial question was not ex-
plored in the recent deep learning based medical im-
age studies and in particular in image pathology pub-
lications. To address this question, we evaluated both,
SegNet and U-Net, by varying the number of train-
ing images and randomly picking images from our
dataset for each run. During the training phase, we
observed two different behaviors: a consistent DC
improvement for SegNet, as the number of training
images increases whereas U-Net seems to converge
Figure 3: Comparison of different number of images on
SegNet and U-Net model during the training phase and the
prediction evaluation.
faster (see Figure. 3). On the opposite, during the pre-
diction evaluation on WSIs, SegNet converges very
fast to the almost optimal result, whereas U-Net needs
at least 6 images to get there. The main conclusion of
this observation which can be applied to any dataset
for probably various domains, reveals the importance
of the chosen model according to the number of in-
puts which is consistent with results of similar work
(Ronneberger et al.). In this study we decided to keep
SegNet as the optimal model as the baseline for other
experiments considering that it gives better results af-
ter a training phase on 9 images.
BIOIMAGING 2019 - 6th International Conference on Bioimaging
124
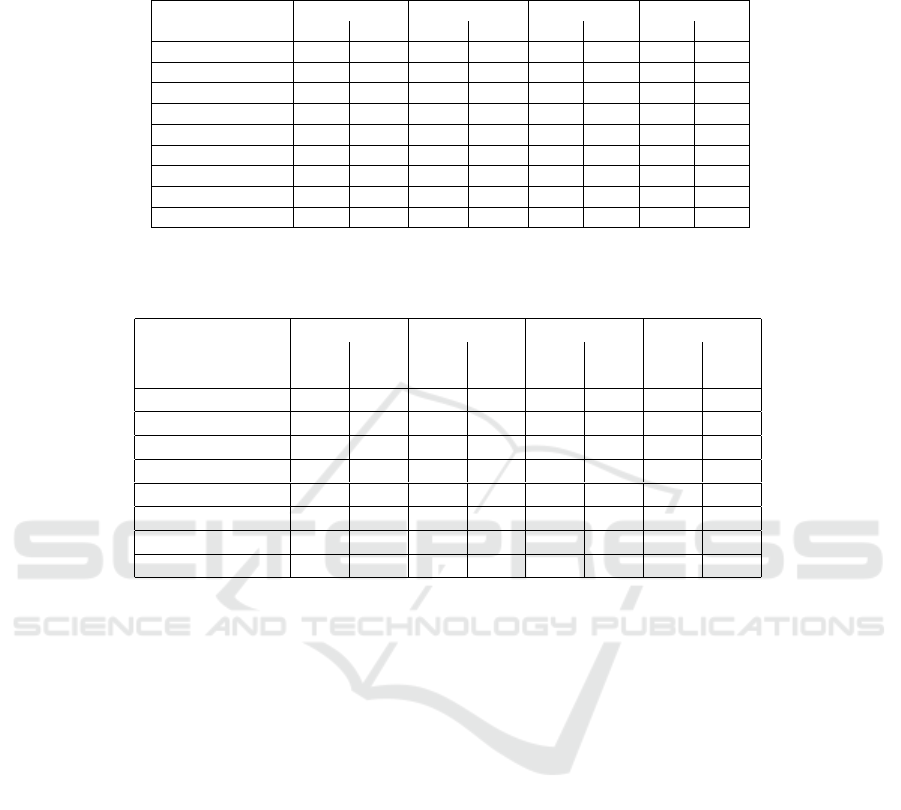
Table 2: Quantitative comparison of 3 normalization methods applied on two test H&E images: Original (not normalized),
Grayscale, Macenko and Vahadane normaizations. This table represents the pixel-wise evaluation per class and global in
terms of DC and JI.
Tissues
Original Greyscale Macenko Vahadane
JI DC JI DC JI DC JI DC
IC 0.28 0.43 0.26 0.41 0.37 0.55 0.35 0.51
DCIS 0.12 0.10 0.0 0.0 0.0 0.12 0.07 0.1
Begnin epi 0.21 0.34 0.05 0.07 0.20 0.32 0.22 0.33
Stroma 0.76 0.86 0.71 0.83 0.79 0.88 0.79 0.88
Complex stroma 0.33 0.5 0.28 0.43 0.29 0.45 0.32 0.48
Adipose 0.74 0.85 0.74 0.85 0.75 0.86 0.76 0.86
Artifacts 0.25 0.39 0.19 0.33 0.30 0.45 0.28 0.43
Background 0.95 0.97 0.95 0.97 0.96 0.97 0.96 0.97
Global 0.74 0.85 0.73 0.84 0.77 0.87 0.78 0.88
Table 3: Dice Coefficicent(DC) evaluation per tissue for 2 test images (I1 & I2) with 9 training images using four different
segmentation neural networks.
Tissues
U-Net SegNet FCN DeepLab
I1 I2 I1 I2 I1 I2 I1 I2
DC DC DC DC DC DC DC DC
IC 0.72 0.39 0.57 0.43 0.66 0.33 0.65 0.39
DCIS 0.02 0.0 0.13 0.0 0.07 0.0 0.01 0.07
Begnin epi 0.51 0.11 0.53 0.16 0.50 0.10 0.54 0.19
Simple stroma 0.84 0.90 0.85 0.90 0.83 0.89 0.85 0.90
Complex stroma 0.41 0.58 0.40 0.53 0.32 0.57 0.37 0.55
Adipose 0.88 0.81 0.88 0.85 0.87 0.82 0.87 0.82
Artifacts 0.41 0.30 0.42 0.51 0.13 0.24 0.40 0.48
Global 0.86 0.86 0.87 0.88 0.86 0.86 0.86 0.87
4.2 Optimal Tilling for Large Images
How Much Data Augmentation Improves the
Learning Process? In a segmentation learning task,
data augmentation consists of applying various im-
age transformations simultaneously on the raw im-
ages and the validated images. In order to preserve
breast tissue characteristics we avoided transforma-
tions that cause texture deformation (like shearing,
mirroring). H&E images are obviously invariant by
rotation, and thus we first considered the rotation
transformation. In this paper, we applied a slightly
different method in this study which consists in simul-
taneously extract and rotate the original sample at ran-
dom angles. This method allows rotation-invariance
and prevents over-fitting of the model. We evaluated
the impact of this rotation augmentation method and
we did not observe any improvement during the train-
ing (DC=0.706 with rotation and DC=0.703 without).
However, when evaluating the 2 test WSIs, the im-
provement using the data augmentation based on ro-
tation is very important (DC=0.876 with rotation and
DC=0.433 without). Secondly, we applied elastic de-
formations (Simard et al., 2003) to the original ex-
tracted training samples. We chose this particular
type of deformation because it seemed to be the most
adequate to represent the natural variation of texture
among the tissues. Due to the large number of patches
(N
p
=5000) extracted from the raw images, we ob-
served that elastic deformation did not improve the
learning process either during the training phase or
the prediction evaluation. This study confirms the
importance of an appropriate data augmentation ap-
proach, and considering the large dimension of our
WSIs, the overlap of patches extracted from each im-
age combine with rotation is sufficient for data aug-
mentation.
What the Minimum Amount of Labeled Data is?
We evaluated two correlated parameters which are
the size S
p
and the number N
p
of randomly extracted
patches per WSI. Regarding the size of patches, we
looked at a large range from 96 to 384 pixels, using
R as a ratio where S
p
= 96 ∗ R with R ∈ {1, 2, 3, 4}.
Figure. 4 shows the train and prediction DC of our
2 chosen networks. Obviously, both models demon-
strate different behavior when S
p
and N
p
vary. Seg-
Net shows a constant increase of training curve be-
cause its architecture includes batch normalization.
But, starting fromN
p
= 2500, the DC remains con-
Deep Analysis of CNN Settings for New Cancer Whole-slide Histological Images Segmentation: The Case of Small Training Sets
125
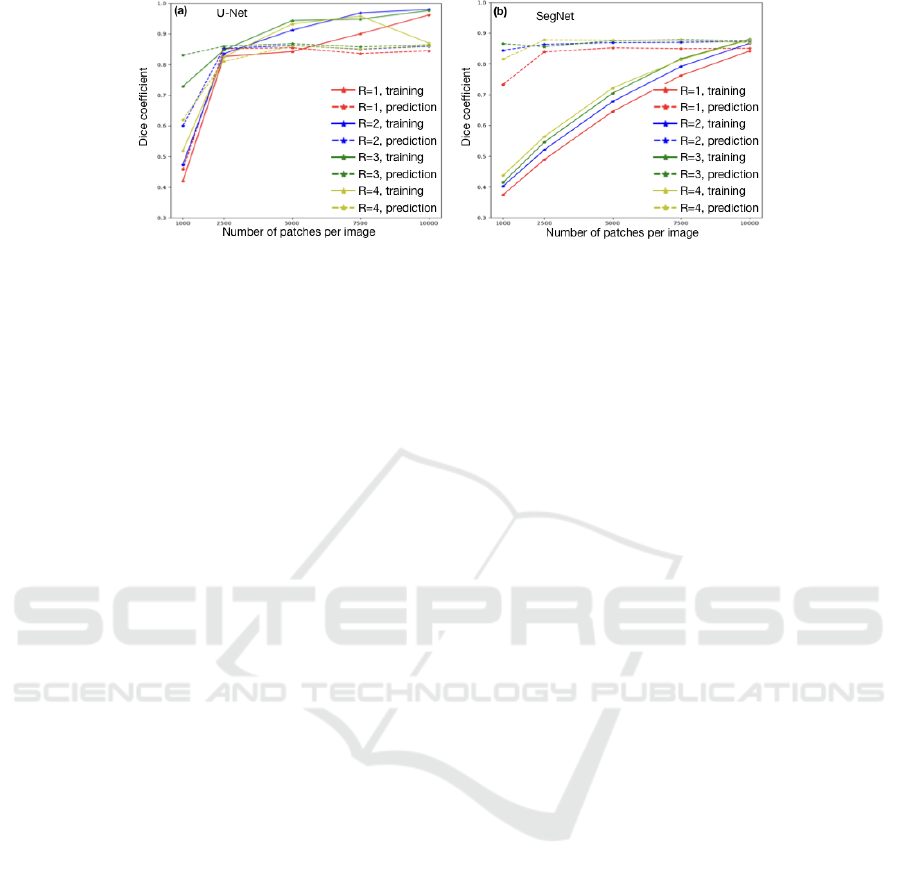
Figure 4: The train accuracy over number of training samples per image and sample size of two classifiers: (a) U-Net and (b)
SegNet.
stant. A larger random samples could lead to a lot
of redundancy due to overlapping patches. Secondly,
there is a trade-off between localization accuracy and
the use of context. Larger patches require more max-
pooling layers that reduce the localization accuracy,
while small patches allow the network to see more
details but only little context.
5 RESULTS
Among the 11 WSIs in our data set, we choose two
representative WSIs for test (Figure. 1) to evaluate
the final prediction performance of our framework.
Table 3 shows global as well as class-wise perfor-
mance on the test images of the four networks pre-
dictions for the 8 classes as presented in Section 3.
Even if the global score of the entire images do not
vary much, SegNet slightly outperforms the other net-
works. Thus, giving the diversity and the number
of tissue categories, it is more interesting to analyze
the classes-wise metrics (Table 3) to capture the dif-
ference between the evaluated models. The class-
wise accuracy clearly shows that larger classes have
reasonable accuracy and smaller classes have lower
accuracy. Epithelium classes and, in particular, the
two carcinoma subtypes are more challenging for the
models to segment than the non-epithelium classes,
many of which occupy a small part of the whole im-
age and appear infrequently as shown in Figure. 4. It
is important to emphasize that U-Net displays better
performance on invasive carcinoma IC where SegNet
was surpassed by 15%, FCN by 8% and DeepLab by
9% respectively in terms of DC score.
Visual Results. Figure 5 shows the visual results of
our framework with optimal setting using the four
models. Even if we examined two test images with
roughly equal DC and JI scores, we obtained differ-
ent segmentation qualities.
6 CONCLUSIONS & DISCUSSION
We proposed an end-to-end framework for a medical
multi-classes segmentation task. We first introduced a
dataset of 11 H&E stained breast cancer images cap-
tured at intermediate resolution (20x magnification).
We annotated WSIs into 7 tissues plus background
categories that an expert pathologist determined im-
portant for the medical task. We proposed a deep
analysis of network settings for image segmentation
in order to determine the optimal configuration that
can be used in similar task. The final results was
evaluated using pixel-wise metrics. Results of U-Net,
SegNet, FCN and DeepLab got comparable scores
with DC of 0.86, 0.87, 0.86 and 0.86 respectively.
The current study retains several limitations that we
want to address in future work: Epithelium classes
and artifacts remains a challenge to be detected due
to the huge tissue variability among the WSIs. This
may be improved with larger datasets and class distri-
bution aware labeling training techniques. A reason
for poor performance of carcinoma classes prediction
could lie in the encoder-decoder architecture. More
network architectures that capture the epithelium de-
tails may improve the segmentation performance. A
new metric is necessary to reflect the medical infor-
mation since the classical metrics capture the detec-
tion quality without taking into account the impor-
tance of some classes over the others.
REFERENCES
Aresta, G., Ara
´
ujo, T., and Kwok (2018). Bach: Grand
challenge on breast cancer histology images.
Badrinarayanan, V. and Kendall (2017). Segnet: A deep
convolutional encoder-decoder architecture for image
segmentation. IEEE transactions on pattern analysis
and machine intelligence.
Beck, A. H., Sangoi, A. R., and Leung (2011). Systematic
BIOIMAGING 2019 - 6th International Conference on Bioimaging
126
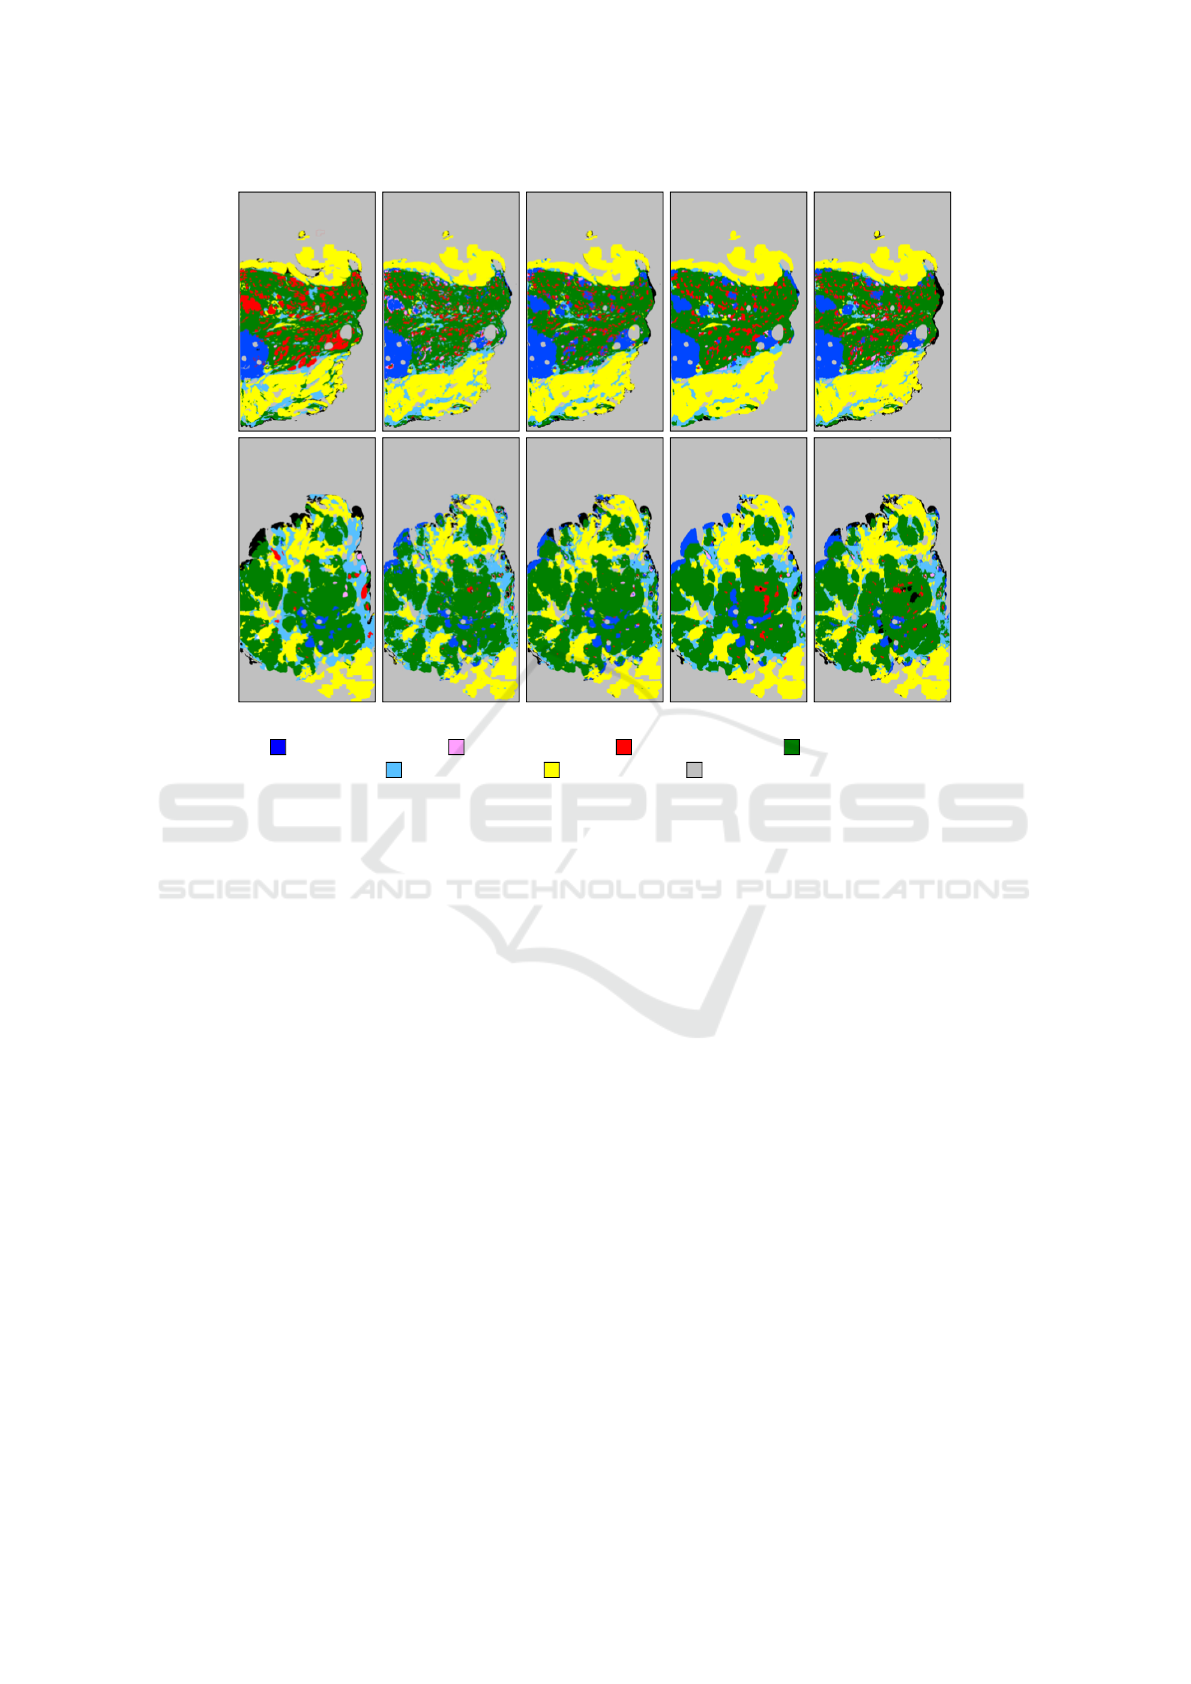
Ground truth U-Net SegNet FCN DeepLab
Invasive carsinoma Carsinoma In situ Begnin epithelum Simple stroma
Complex stroma Adipose tissue Background
Figure 5: From left to right, two test ground truth masks, U-Net, SegNet, FCN and DeepLab multi-classes segmentation
results using optimal parameters.
analysis of breast cancer morphology uncovers stro-
mal features associated with survival. Science trans-
lational medicine.
Chen, H., Qi, X., Yu, L., and Heng, P.-A. (2016a). Dcan:
Deep contour-aware networks for accurate gland seg-
mentation. In Proceedings of the IEEE conference
on Computer Vision and Pattern Recognition, pages
2487–2496.
Chen, L.-C., Papandreou, G., Kokkinos, I., Murphy, K., and
Yuille, A. L. (2016b). Deeplab: Semantic image seg-
mentation with deep convolutional nets, atrous convo-
lution, and fully connected crfs.
Cruz-Roa, A., Gilmore, H., and et al, B. Accurate and re-
producible invasive breast cancer detection in whole-
slide images: A deep learning approach for quantify-
ing tumor extent. Scientific reports.
Hou, L., Samaras, D., Kurc, T. M., Gao, Y., Davis, J. E., and
Saltz, J. H. (2016). Patch-based convolutional neural
network for whole slide tissue image classification. In
Proceedings of the IEEE Conference on Computer Vi-
sion and Pattern Recognition.
Janowczyk, A. and Madabhushi, A. (2016). Deep learn-
ing for digital pathology image analysis: A compre-
hensive tutorial with selected use cases. Journal of
Pathology Informatics.
Kingma, D. P., Ba, J., et al. (2014). Adam: A method for
stochastic optimization.
LeCun, Y., Bengio, Y., and Hinton, G. Deep learning. na-
ture.
Long, J., Shelhamer, E., and Darrell, T. (2015). Fully con-
volutional networks for semantic segmentation. In
Proceedings of the IEEE conference on computer vi-
sion and pattern recognition, pages 3431–3440.
Loukas, C, K. (2013). Breast cancer characterization based
on image classification of tissue sections visualized
under low magnification. Computational and math-
ematical methods in medicine.
Macenko, M., Niethammer, M., Marron, J. S., et al. A
method for normalizing histology slides for quantita-
tive analysis. In Biomedical Imaging: From Nano to
Macro, 2009. ISBI’09. IEEE International Symposium
on.
Ronneberger, O., Fischer, P., and Brox, T. U-net: Convo-
lutional networks for biomedical image segmentation.
In International Conference on Medical image com-
puting and computer-assisted intervention.
Sethi, A., Sha, L., Vahadane, et al. Empirical comparison
of color normalization methods for epithelial-stromal
classification in h and e images. Journal of pathology
informatics.
Simard, P. Y., Steinkraus, D., Platt, J. C., et al. (2003). Best
practices for convolutional neural networks applied to
visual document analysis.
Spanhol, F. A., Oliveira, L. S., Petitjean, C., and Heutte,
L. A dataset for breast cancer histopathological im-
Deep Analysis of CNN Settings for New Cancer Whole-slide Histological Images Segmentation: The Case of Small Training Sets
127

age classification. IEEE Transactions on Biomedical
Engineering.
Torre, L. A., Siegel, R. L., Ward, E. M., and Jemal, A.
(2016). Global cancer incidence and mortality rates
and trends—an update. Cancer Epidemiology and
Prevention Biomarkers.
Vahadane, A., Peng, T., Sethi, A., Albarqouni, et al. (2016).
Structure-preserving color normalization and sparse
stain separation for histological images. IEEE trans-
actions on medical imaging.
Wang, D., Khosla, A., Gargeya, R., Irshad, H., and Beck,
A. H. (2016). Deep learning for identifying metastatic
breast cancer. arXiv preprint arXiv:1606.05718.
BIOIMAGING 2019 - 6th International Conference on Bioimaging
128
