
Causal Inference in Nonverbal Dyadic Communication with Relevant
Interval Selection and Granger Causality
Lea M
¨
uller
1
, Maha Shadaydeh
1
, Martin Th
¨
ummel
1
, Thomas Kessler
2
, Dana Schneider
2
and Joachim Denzler
1,3
1
Computer Vision Group, Friedrich Schiller University of Jena, Ernst-Abbe-Platz 2, 07743 Jena, Germany
2
Department of Social Psychology, Friedrich Schiller University of Jena, Humboldtstrasse 26, 07743 Jena, Germany
3
Michael Stifel Center, Ernst-Abbe-Platz 2, 07743 Jena, Germany
Keywords:
Nonverbal Emotional Communication, Granger Causality, Maximally Coherent Intervals.
Abstract:
Human nonverbal emotional communication in dyadic dialogs is a process of mutual influence and adaptation.
Identifying the direction of influence, or cause-effect relation between participants, is a challenging task due
to two main obstacles. First, distinct emotions might not be clearly visible. Second, participants cause-
effect relation is transient and variant over time. In this paper, we address these difficulties by using facial
expressions that can be present even when strong distinct facial emotions are not visible. We also propose to
apply a relevant interval selection approach prior to causal inference to identify those transient intervals where
adaptation process occurs. To identify the direction of influence, we apply the concept of Granger causality to
the time series of facial expressions on the set of relevant intervals. We tested our approach on synthetic data
and then applied it to newly, experimentally obtained data. Here, we were able to show that a more sensitive
facial expression detection algorithm and a relevant interval detection approach is most promising to reveal
the cause-effect pattern for dyadic communication in various instructed interaction conditions.
1 INTRODUCTION
Human nonverbal communication in effective dialogs
is mutual, and thus, it should be a process of continual
two-sided adaptation and mutual influence. However,
some humans behave consistently over time either by
resisting adaptation and influence on purpose, or by
maintaining their own style because of absent social
communication skills (Burgoon et al., 2016; Schnei-
der et al., 2017). If adaptation occurs, it can be tran-
sient, subtle, multifold, and variant over time, which
makes the quantitative analysis of the adaption pro-
cess a challenging task. A possible approach to deal
with this problem would be to present the nonverbal
adaptation process in a form of time series of features
and then perform a cause-effect analysis on the obtai-
ned time series. Among the many known causality
inference methods, Granger causality (GC) (Granger,
1980) is the most widely used one. GC states that
causes both precede and help predict their effects. It
has been applied in a variety of scientific fields, such
as economics (Granger et al., 2000), climate infor-
matics (Zhang et al., 2011), and neuroscience (Ding
et al., 2006). With respect to nonverbal human beha-
vior, GC was for example used to model dominance
effects in social interactions (Kalimeri et al., 2011),
focusing on vocal and kinesic cues. Novel develop-
ments in computer vision and social signal processing
yielded accurate, open-source, real-time toolboxes to
easily extract facial expressions from images and vi-
deos. These easily accessible visual cues facilitate vi-
deo and image analysis, not only in terms of segmen-
tation and classification but can also be used to iden-
tify social cause-effect relationships. Surprisingly, the
capabilities of computer vision and social signal pro-
cessing have rarely been combined. In our work, we
will exploit computer vision capabilities for a quan-
titative verification of hypotheses on cause-effect re-
lations in real data by investigating time series of fa-
cial expressions via facial muscle activation or Action
Units (AUs) (Ekman, 2002). The real data was obtai-
ned from an experimental setup in which dyadic dia-
logs between participants were recorded with one par-
ticipant being instructed to behave in a particular way.
The novel contributions of our study can be sum-
marized as follows.
1. Exploiting computer vision methods, we provide
a comprehensive concept for analysing the di-
490
Müller, L., Shadaydeh, M., Thümmel, M., Kessler, T., Schneider, D. and Denzler, J.
Causal Inference in Nonverbal Dyadic Communication with Relevant Interval Selection and Granger Causality.
DOI: 10.5220/0007399304900497
In Proceedings of the 14th International Joint Conference on Computer Vision, Imaging and Computer Graphics Theory and Applications (VISIGRAPP 2019), pages 490-497
ISBN: 978-989-758-354-4
Copyright
c
2019 by SCITEPRESS – Science and Technology Publications, Lda. All rights reserved

rection of influence in dyadic dialogs starting with
raw video material.
2. Interaction implies mutual influence and causa-
lity. Causal inference concepts, such as GC, have
been rarely used to identify the direction of influ-
ence in nonverbal emotional communication. To
the best of our knowledge no other work has used
a Granger causality model to identify the direction
of influence regarding facial expressions in dyadic
dialogs.
3. Facial AUs go along with emotional experience.
However, in constructed situations distinct strong
emotions might not be visible at all and a single
Action Unit (AU) does not contain enough infor-
mation for inferring emotions. We present appli-
cable features when strong distinct facial emoti-
ons are seldom visible. By using AUs we derive
facial expressions in upper and lower face regions
from the six basic emotions (Ekman, 1992).
4. We propose a method for the selection of the re-
levant time intervals where GC should be app-
lied, and show based on synthetic as well as real
data, the superiority of the proposed method in de-
tecting cause-effect relations when compared to
applying GC on the full time series.
2 RELATED WORK
The topic of finding causal structures in nonverbal
communication data is addressed by Kalimeri et al.
(Kalimeri et al., 2012). In their paper, they used GC
for modeling the effects that dominant people might
induce on the nonverbal behavior (speech energy and
body motion) of other people. Besides audio cues,
motion vectors and residual coding bit rate features
from skin colored regions were extracted. In two sy-
stems, one for body movement and another one for
speaking activity, with four time series each, a small
GC based causal network was used to identify the par-
ticipants with high or low causal influence. Unlike
our approach, the authors did not use facial expressi-
ons and do not identify relevant intervals in a previous
step, but use the entire time series instead.
A popular approach for the latter strategy is to
find similar segments, for example emotions, arou-
sal or (dis)agreement, in videos. The literature holds
several approaches that pose complex classification
tasks. Kaliouby and Robinson (El Kaliouby and Ro-
binson, 2005) provided the first classification system
for agreement and disagreement as well as other men-
tal states based on nonverbal cues only. They used
head motion and facial action units together with a
dynamic Bayesian Network for classification. Also, a
survey on cues, databases, and tools related to the de-
tection of spontaneous agreement and disagreement
was done by Bousmalis et al. (Bousmalis et al.,
2013). Despite their ingenious methods, these ap-
proaches do not investigate cause-effect relations in
the social interaction situation. Sheerman-Chase et
al. (Sheerman-Chase et al., 2009) used visual cues
to distinguish between states such as thinking, un-
derstanding, agreeing, and questioning to recognize
agreement. Matsuyama et al. (Matsuyama et al.,
2016) developed a socially-aware robot assistant re-
sponding to visual and vocal cues. For visual featu-
res, the robot extracted facial cues (based on Open-
Face (Baltrusaitis et al., 2018)) such as landmarks,
head pose, gaze, and facial action units. Conversatio-
nal strategies that build, maintain, or destroy budding
relationships were classified. Moreover, rapport was
estimated by temporal association rule learning. The
researchers’ approach investigates building a social
relationship between a human and a robot; however
this study does not deal with a time variant direction
of cause-effect relation.
3 METHODOLOGY
3.1 Experimental Setup
receiver sender
camera 1camera 2
Figure 1: Experimental setup with camera positions sho-
wing sender and receiver sitting opposite to each other.
We created an experimental setup (Figure 1) in which
two participants sat opposite to each other while tal-
king about their personal weaknesses for about four
minutes at a time. In total, they were asked to do this
three times, either in circumstances of a respectful,
contemptuous, or objective situation. One participant
was in the assigned role of a Receiver (R), the other in
the assigned role of the Sender (S). As only S had the
active experimental interaction attitude task (i.e., to
behave either respectfully, objectively, or contemptu-
ously), we expected S to influence R in relevant facial
expressions. In all three experimental conditions each
participant kept their initially assigned role of acting
as a sender or receiver and the experimental conditi-
Causal Inference in Nonverbal Dyadic Communication with Relevant Interval Selection and Granger Causality
491

ons were conducted in a counterbalanced order. Furt-
her, R was asked to start the conversation with a per-
sonal weakness and both participants were asked to
talk about at least one weakness per condition. In or-
der to avoid flirtatious situations, that may overwrite
the instructed condition, interaction partners were al-
ways from the same sex. In total, 13 pairs of partici-
pants (4 males; 9 females) were analysed in terms of
their nonverbal behavior. All participants gave writ-
ten informed consent. The study was conducted in ac-
cordance with the Declaration of Helsinki and appro-
ved by the Ethics Committee of the Friedrich Schiller
University of Jena.
To capture nonverbal facial behavior, we positi-
oned two frontal perspective cameras (Figure 1), re-
cording at 25 frames per second. Except for the ex-
perimental condition label no other information (e.g.,
expression annotation per frame) were available for
image analysis. The entire dataset consists of 13 pairs,
three conditions each pair and about 4 minutes of vi-
deo per condition, thus about 300 minutes of video
material or 470.000 images.
The psychological research question was, whether
and how S and R influence each other under the diffe-
rent attitude situations. We expect for a counting mea-
sure more harmony expressions (i.e., happiness) when
both interaction partners are confronted with medium
to high levels of respect (i.e., quality-based respectful
and objective/neutral vs. contemptuous). We expect
the strongest activation of negative expressions (i.e.,
anger, contempt, fear, and sadness) in the disrespect-
ful condition (i.e., contemptuous vs. quality-based re-
spectful and objective/neutral). When it comes to the
factor ’type of interaction partner’, we expect, for all
non-verbal emotional facial actions, in terms of tem-
poral causality the active partner (i.e., the sender) to
cause the effects and ’infect’ the less active partner
(i.e., the receiver). In terms of the different facial ex-
pressions, we expect the strongest causality from S to
R for positive expressions (i.e., happiness), followed
by negative expressions (i.e., anger, contempt, fear,
sadness).
3.2 Facial Expression Extraction
According to Ekman and Rosenberg (Ekman and Ro-
senberg, 1997), facial expressions are the most im-
portant nonverbal signal when it comes to human in-
teraction. The Facial Action Coding System (FACS)
was developed by Ekman and Friesen (Ekman and
Friesen, 1978; Ekman, 2002). It specifies facial AUs,
based on facial muscle activation. Examples of AUs
are the inner brow raiser, the nose wrinkler, or the
lip corner puller. Any facial expression is a com-
bination of facial muscles being activated, and thus,
can be described by a combination of AUs. Hence,
the six basic emotions (anger, fear, sadness, disgust,
surprise, and happiness) can also be represented via
AUs. Langner (Langner et al., 2010) show that when
for example AU 6 (cheek raiser), 12 (lip corner pul-
ler), and 25 (lips part) are activated happiness is visi-
ble.
In general, emotions are visual nonverbal com-
munication cues transferable to time series. Regar-
ding our real experimental data, this approach is re-
asonable for positive emotions like happiness, which
is frequently visible throughout the dyadic interacti-
ons. Yet, it is not applicable for negative associated
emotions such as anger, disgust, fear, or sadness, as
these emotions were only slightly visible in the dya-
dic interactions which may be due to the constructed
experimental situation (Table 1).
Table 1: Percentage of frames where emotions were visible
throughout experiment.
Emotion Detection (in %)
Happiness 12.25
Surprise 0.94
Anger 0.13
Disgust 3.72
Fear 0.05
Sadness 1.40
Table 2: Expressions and corresponding AUs.
Expression Active Action Units
Happiness 6, 12, 25
Surprise upper 1, 2, 5
Surprise lower 26
Disgust lower 9, 10, 25
Fear upper 1, 2, 4, 5
Fear lower 20, 25
Sadness upper 1, 4
Sadness lower 15, 17
Anger upper 4, 5, 7
*Anger lower 17, 23, 24
*As AU24 is not detected by OpenFace we excluded anger
lower from further analysis.
The approach of using stand-alone AUs has two
disadvantages. First, we cannot deduce emotional ex-
pressions from single AUs. Second, lower AUs are
frequently activated while talking, and thus, are less
suitable for analysis when it comes to emotional rela-
tions in dyadic interactions.
Wegrzyn et al. (Wegrzyn et al., 2017) studied the
relevance of facial areas for emotion classification and
found differences in the importance of the eye and
mouth regions. Facial AUs can be divided into up-
VISAPP 2019 - 14th International Conference on Computer Vision Theory and Applications
492
per and lower AUs (Cohn et al., 2007). Upper AUs
belong to the upper half of the face and cover the eye
region, whereas AUs in the lower face half cover the
mouth region. Hence, we decided to split emotions
into upper and lower emotions, according to the affi-
liation of AUs to upper and lower face regions. For
example, instead of using sadness as a combination
of AU1, AU4, AU15 and AU17 we used sadness up-
per (AU1 and AU4) and sadness lower (AU15 and
AU17). We only kept happiness as a combination of
both, upper and lower AUs, as it was very frequently
detected. All other emotions were split according to
their AUs belonging to upper or lower facial half (Ta-
ble 2). This procedure ensured, that also subtle facial
expressions were detectable and identified as an emo-
tion.
Table 3: Percentage of emotions in upper and lower face
parts visible throughout experiment.
Emotion Detection (in %)
Anger lower 9.42
Anger upper 1.42
Disgust lower 3.72
Fear lower 4.35
Fear upper 1.12
Happy lower 16.12
Happy upper 26.55
Sadness lower 8.74
Sadness upper 7.25
Surprise lower 26.41
Surprise upper 2.22
In Table 3 the detection percentage of upper and
lower expressions is illustrated. After splitting, anger
lower, sadness lower, sadness upper, and surprise lo-
wer emotions were detected in over 7 % of the video
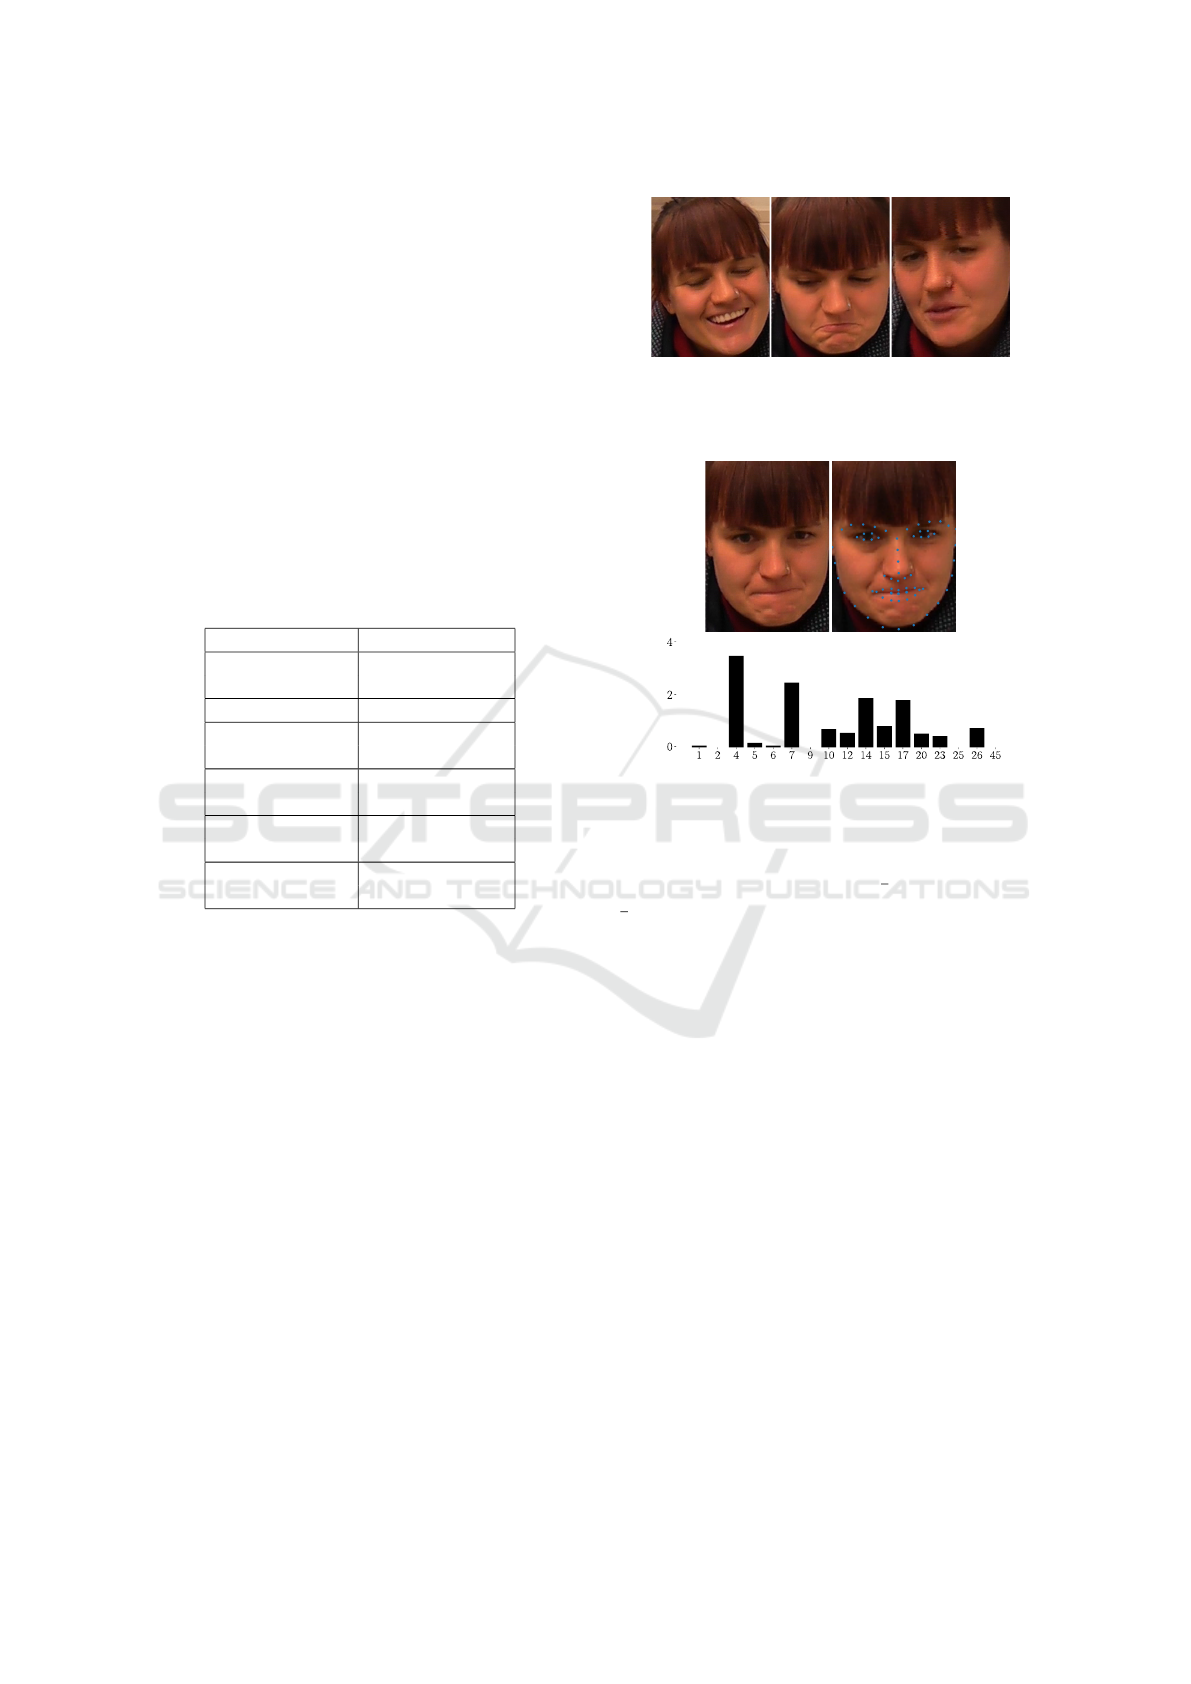
material on average. Figure 2 illustrates which upper
and lower expressions are detected based on the AU
activation for happiness, sadness upper, and sadness
lower.
For feature extraction, we used OpenFace (Baltru-
saitis et al., 2018; Baltru
ˇ
saitis et al., 2015) which is
a state of the art, open-source tool for landmark de-
tection; it estimates AUs based on landmark positi-
ons. OpenFace is capable of extracting 17 different
AUs (1, 2, 4, 5, 6, 7, 9, 10, 12, 14, 15, 17, 20, 23, 25,
26, 45) with an intensity scaled from 0 to 5. Figure 3
illustrates the detection of landmarks and AUs for an
example image.
3.3 Granger Causality
Let x
t
= (x
1
, x
2
. . . x
z
)
t
and y
t
= (y
1
, x
2
. . . y
z
)
t
be real-
valued z-dimensional (column) vectors of AUs at time
Figure 2: From left to right participant with AU 6 and 12
(happiness), AU 15 and 17 (sadness lower), and AU 1 and
4 (sadness upper) being activated.
Action Unit
Activation
Figure 3: Facial expression with landmarks and AUs de-
tected by OpenFace. Strong activation of AU4 (brow lowe-
rer), 7 (lid tightener), 14 (dimpler), and 17 (chin raiser).
point t, t = 1 . . . T , and let ¯x
t
=
1
z
∑
z
i=1
(x
i
)
t
and ¯y
t
=
1
z
∑
z
i=1
(y
i
)
t
be the average of x
t
and y
t
at time point
t. This results in two time series X
t
= ¯x
1
, . . . ¯x
T
and
Y
t
= ¯y
1
, . . . ¯y
T
consisting of averaged values of AUs.
The prediction of values of X and Y at time t is based
on previous values from X
k
and Y
k
, k < t
X
t
=
m
∑
j=1
a
j
X
t− j
+
m
∑
j=1
b
j
Y
t− j
+ ε
t
(1)
Y
t
=
m
∑
j=1
c
j
X
t− j
+
m
∑
j=1
d
j
Y
t− j
+ ϑ
t
(2)
with ε
t
and ϑ
t
being two independent noise processes.
For each expression of each participant in each con-
dition we estimated the best model order m using the
Bayesian Information Criterion (BIC). For statistical
significance, an F-Test with a level of significance of
p = 0.05 was used. When testing for GC three dif-
ferent cases regarding the direction of influence can
occur (Schulze, 2004):
1. If a
k
= 0 for k = 1 . . . m and ∃b
k
6= 0 for 1 ≤ k ≤ m
then Y Granger causes X.
2. If d
k
= 0 for k = 1. . . m and ∃c
k
6= 0 for 1 ≤ k ≤ m
then X Granger causes Y.
Causal Inference in Nonverbal Dyadic Communication with Relevant Interval Selection and Granger Causality
493

3. If for both ∃b
k
6= 0 for 1 ≤ k ≤ m and ∃c
k
6= 0 for
1 ≤ k ≤ m holds a bidirectional (feedback) rela-
tion exists.
If none of the above cases holds, X and Y are not
Granger causing each other. In our real data, we ex-
pected that, if present, pairs that do not Granger cause
each other are rare.
3.4 Relevant Interval Selection
Considering the experimental setup, we had to expect
multiple temporal scenes, further referred to as subin-
tervals, in which the participants influenced each ot-
her. The time spans where causality is visible, might
range from half a second to half a minute, occur se-
veral times, and can be interrupted by irrelevant sce-
nes (e.g., one participant talking while the other par-
ticipant is listening) that differ in the length of time.
As outlined above, the direction of influence in a sub-
interval can either be bidirectional, or unidirectional
driven by either S or R. This implies that three un-
wanted effects can occur, if the full time span is ana-
lysed: first, temporal relations are not found at all;
second, bidirectional relations mask temporal unidi-
rectional relations and; third, an unidirectional rela-
tion from X to Y masks temporal bidirectional influ-
ence or unidirectional influence from Y to X. Li et al.
(Li et al., 2017) give an example where temporal GC
is not being detected, when the full time span is used
for model fitting.
Our central idea is to apply GC only to time se-
ries obtained by concatenating highly coherent (e.g.,
in terms of Pearson correlation) subintervals of raw
time series. Instead of using a brute force algorithm,
we suggest using a bottom-up approach for finding
the longest set of maximal, non-overlapping, correla-
ted intervals in time series as proposed by Atluri et al.
(Atluri et al., 2014). The authors applied their appro-
ach to fMRI data where they achieved good results for
clustering coherent working brain regions.
Let X
t
and Y
t
be two time series of length N. An
interval is called correlated interval for a threshold β,
when all its subintervals up to a lower interval length
α are correlated as well. An interval I
(a,b)
from a to
b is called maximal, when I
(a,b)
is a correlated inter-
val, but I
(a−1,b)
and I
(a,b+1)
are not. And two inter-
vals I
(a,b)
and I
(c,d)
are called non-overlapping, when
I
(a,b)
∩ I
(c,d)
=
/
0. From all intervals fulfilling these
conditions the longest set (total length of intervals) is
computed.
In a multivariate case (e.g., multiple AUs defining
an expression), we propose to compute the longest set
for each pair of corresponding variables and then use
the intersection of intervals over all variables of the
system, as selected relevant intervals. For further ana-
lysis, for each variable of the system the selected rele-
vant intervals can be concatenated, resulting in multi-
ple time series each composed of relevant information
only. In the following we refer to the set of selected
intervals between two time series X and Y as AW
XY
.
3.5 Modeling Cause-effect Relations
The two major challenges in the analysis of the cause-
effect relations in dyadic dialogs, that make the appli-
cation of conventional methods difficult were:
1. Due to the constructed situations, strong distinct
emotions, computed by using traditional AU com-
binations, were rarely visible.
2. Time variant and situation-dependent communi-
cation, resulting in a high variety and volatility of
time spans in which nonverbal cause-effect beha-
vior between interacting partners is visible.
To tackle these difficulties, we use the combination
of specific facial expressions and the relevant interval
selection approch. The final selection of relevant in-
tervals and the following analysis of causality for two
systems of facial action units x
1
. . . x
T
and y
1
. . . y
T
consists of the following steps:
1. Calculate selected relevant intervals
AW
x
1t
y
1t
, AW
x
2t
y
2t
, . . . , AW
x
zt
y
zt
pairwise between
corresponding system parameters.
2. Calculate the intersection AW
xy
of all sets of se-
lected intervals AW
x
1t
y
1t
∩ AW
x
2t
y
2t
∩ ·· · ∩ AW
x
zt
y
zt
.
3. Concatenate selected intervals for each variable of
x
t
and y
t
4. Compute GC on concatenation.
Before applying the relevant interval selection appro-
ach to our nonverbal communication data, we identi-
fied upper and lower facial expressions that changed
significantly between the three experimental conditi-
ons. For that we calculated each participant’s average
face, which is the average AU activation over the three
conditions and used it as a lower threshold for the acti-
vation of an expression. That means, that we consi-
dered an expression as visible, when all of its associ-
ated AUs were greater than 0.5 standard deviations of
the conspecific AUs in the average face. The number
of activations per expression was counted per person
and experimental condition, and normalized by video
length and maximum count of the expression of each
person. A Wilcoxon signed-rank test revealed, that
the participants showed significantly more happiness
in the respectful condition than in the contempt con-
dition (p = .034, s = 92.0). Further, we found both,
more sadness lower (p = .034, s = 92.0 and p = .020,
VISAPP 2019 - 14th International Conference on Computer Vision Theory and Applications
494

s = 84.0) and sadness upper (p = .023, s = 86.0 and
p = .023, s = 86.0) expressions in the contempt and
the respectful condition compared to the objective
condition, when using a Benjamini-Hochberg p-value
correction (Benjamini and Hochberg, 1995) with a
false discovery rate of Q = .3 and individual p-values
of α = .5.
As a next step, we applied the relevant interval
selection approach, for computing selected intervals,
pairwise to all of the identified AUs, with a minimum
interval length of 75 and a threshold of 0.8 for Pearson
correlation. Based on known average human reaction
time (ca. 200 ms or 6 frames (Jain et al., 2015)), we
shifted one time series by 0, 4, 8, and 12 frames both,
back and forth in time, and computed relevant inter-
vals. The grid selected for shifting does cover quicker
and slower reactions of participants, while being com-
putationally performant. Afterwards, we computed
the longest set of the list of relevant intervals obtai-
ned from the different shifts. Before computing GC,
we median filtered the selected intervals with a filter
length of 51 (2 seconds) and extended the intervals
by 12 frames on each side. Finally, we calculated the
average GC on the concatenation of the intervals in
the set of selected intervals of the smoothed (Gaus-
sian blur with σ
2
= 1, window size 20) standardized
time series. The results were counted according to the
possible outcomes of the GC test in 3.3, as either uni-
directional caused by S, unidirectional caused by R,
bidirectional, or no causality.
4 EXPERIMENTAL RESULTS
AND DISCUSSION
Evaluation on Synthetic Data. The following con-
structed example illustrates, how our idea contribu-
tes to a better detection of coherent subintervals in
time series. Initially, we generated two time series
of length N = 6000, so that X
t
, Y
t
∼ N (0, 1), and
X
t
, Y
t
are independent. We then smoothed (Gaus-
sian blur with σ
2
= 1, window size 10) X and Y.
After that, multiple intervals of random length l
s
,
l
s
∼ U(50, 200) were synchronized and Y shifted by
four samples back in time. A synchronized interval is
followed by an unsynchronized interval of length l
u
,
l
u
∼ U(100, 600). In the last step, we added Gaussian
noise ε to Y, ε ∼ N (0, 0.02).
We expected the following approaches to detect
all synchronized intervals, and identify the cause-
effect relation on each interval in the manner that Y
Granger causing X, and no intervals for X Granger
causing Y, at different levels of significance α. We
compare the following two approaches:
1. Fixed size sliding window approach: For the fixed
size sliding window approach we used window
size γ = 50 and step size ν = 2. Since multi-
ple tests are performed, a Bonferroni corrected p-
value p
f
=
αν
2(n−γ)
was used for detecting GC.
2. Relevant interval selection approach: We set the
minimum windows size to 50, the correlation
threshold to 0.9, and used a two-sided time shift of
4. The Bonferroni corrected p-value p
aw
=
α
2
|
AW
XY
|
was selected according to the number of intervals
|
AW
XY
|
detected by the relevant interval selection
approach.
For Y Granger causing X, we evaluated precision and
recall with the synchronized intervals as ground truth.
For X Granger causing Y, the ground truth is the full
time series, and thus, only recall needs to be evalu-
ated. Figure 4 shows the evaluation for Y Granger
causing X. Both approaches show a very good per-
formance in detecting all relevant intervals (recall).
Yet, the relevant interval selection approach detects
less irrelevant intervals (precision) among all levels
of significance. Figure 5 shows that both, relevant in-
terval selection and fixed size sliding window appro-
ach, show a very high recall for X Granger causing
Y among all levels of significance, but the relevant
interval selection approach is slightly superior.
Evaluation on Nonverbal Communication Data. In
Figure 6, our relevant interval selection approach is
compared to the full time span approach. The fi-
gure shows the percentage of pairs for which the GC
test, with p = 0.05, showed a specific direction of
influence, under the three experimental conditions,
for each of the identified expressions (sadness lower,
sadness upper, happiness). Especially for sadness lo-
wer and sadness upper expressions, the full time span
approach does not find causality between S and R for
over 50% of the pairs. With our relevant interval se-
lection approach, less pairs show no causality, but
instead uni- or bidirectional causation. Especially for
happiness, we were able to detect that the direction of
influence was more often driven by S or bidirectional,
and rarely driven by R. The full time span approach
does not expose this information at all.
Discussion. When it comes to the amount measure,
the Wilcoxon-Signed-Rank test revealed that parti-
cipants showed significantly more happiness in the
respectful condition compared to the contemptuous
condition, what is conform to our initial hypotheses.
We further expected more negative expressions in the
contempt condition when compared to the objective
and respectful condition. The test further revealed
significantly more sadness upper and sadness lower
in the contemptuous condition compared to the ob-
jective condition. We also found more sadness upper
Causal Inference in Nonverbal Dyadic Communication with Relevant Interval Selection and Granger Causality
495

Figure 6: Relevant interval selection approach compared to full time span approach for different facial expressions under the
three experimental conditions for distinguishing the direction of influence.
Level of significance
Precision / Recall
Precision
Recall
Fixed sliding window approach
Relevant interval selection approach
Figure 4: Precision and recall for relevant interval selection
and fixed size sliding window approaches for Y Granger
causing X.
Recall
Level of significance
Fixed sliding window approach
Relevant interval selection approach
Figure 5: Recall for relevant interval selection and fixed size
sliding window approaches for X Granger causing Y.
and sadness lower in the respectful condition compa-
red to the objective condition. With respect to the cau-
sality measure we expected positive expressions to be
more relevant than negative expressions. Our results
are conform to this hypothesis, as especially happi-
ness shows either uni- or bidirectional causality. No-
causality is rarely found, especially when compared
to sadness upper and sadness lower. In the respectful
condition, happiness was more often caused by S. In
the contemptuous condition R caused the expression
happiness more often than S, especially when compa-
red to the objective and respectful condition. This was
to be expected, as S is not supposed to show positive
expressions in the contemptuous condition. Negative
expressions are less clearly caused by either of the
participants.
5 CONCLUSIONS
In this paper, we employed GC together with a re-
levant interval selection approach for identifying the
direction of influence in nonverbal dyadic communi-
cation. To this end, we presented an algorithm for
the detection of emotional facial features, capable of
capturing emotions even when strong distinct emoti-
ons are not visible. To improve causality inference,
we proposed an intelligent interval selection appro-
ach for filtering relevant information in dyadic dialog.
Subsequently, we were able to apply our GC model to
the set of selected relevant intervals and compute the
direction of influence. We applied our approach to
real data obtained from an experimental setup. The
obtained results revealed that the use of the relevant
interval detection approach combined with the pro-
posed facial expression detection algorithm signifi-
cantly improved the detection of the cause-effect pat-
tern for dyadic communication in various instructed
interaction conditions. Overall, we identify our con-
tribution as an important step towards interdiscipli-
nary, with computer vision potentials, psychological
observations, and theoretical knowledge of causality
VISAPP 2019 - 14th International Conference on Computer Vision Theory and Applications
496

methods being combined and extended to gain inte-
resting insights into emotional social interaction.
REFERENCES
Atluri, G., Steinbach, M., Lim, K., MacDonald, A., and Ku-
mar, V. (2014). Discovering the longest set of distinct
maximal correlated intervals in time series data.
Baltru
ˇ
saitis, T., Mahmoud, M., and Robinson, P. (2015).
Cross-dataset learning and person-specific normalisa-
tion for automatic action unit detection. In Automa-
tic Face and Gesture Recognition (FG), 2015 11th
IEEE International Conference and Workshops on,
volume 6, pages 1–6. IEEE.
Baltrusaitis, T., Zadeh, A., Lim, Y. C., and Morency, L.-P.
(2018). Openface 2.0: Facial behavior analysis tool-
kit. In Automatic Face & Gesture Recognition (FG
2018), 2018 13th IEEE International Conference on,
pages 59–66. IEEE.
Benjamini, Y. and Hochberg, Y. (1995). Controlling the
false discovery rate: a practical and powerful appro-
ach to multiple testing. Journal of the royal statistical
society. Series B (Methodological), pages 289–300.
Bousmalis, K., Mehu, M., and Pantic, M. (2013). Towards
the automatic detection of spontaneous agreement and
disagreement based on nonverbal behaviour: A survey
of related cues, databases, and tools. Image and Vision
Computing, 31(2):203–221.
Burgoon, J. K., Guerrero, L. K., and Floyd, K. (2016). Non-
verbal communication. Routledge.
Cohn, J. F., Ambadar, Z., and Ekman, P. (2007). Observer-
based measurement of facial expression with the fa-
cial action coding system. The handbook of emotion
elicitation and assessment, pages 203–221.
Ding, M., Chen, Y., and Bressler, S. L. (2006). Granger cau-
sality: basic theory and application to neuroscience.
Handbook of time series analysis: recent theoretical
developments and applications, pages 437–460.
Ekman, P. (1992). An argument for basic emotions. Cogni-
tion & emotion, 6(3-4):169–200.
Ekman, P. (2002). Facial action coding system (facs). A
human face.
Ekman, P. and Friesen, W. (1978). Facial action coding
system: A technique for the measurement of facial
action. Manual for the Facial Action Coding System.
Ekman, P. and Rosenberg, E. L. (1997). What the face
reveals: Basic and applied studies of spontaneous
expression using the Facial Action Coding System
(FACS). Oxford University Press, USA.
El Kaliouby, R. and Robinson, P. (2005). Real-time infe-
rence of complex mental states from facial expressi-
ons and head gestures. In Real-time vision for human-
computer interaction, pages 181–200. Springer.
Granger, C. (1980). Testing for causality: A personal vie-
wpoint. Journal of Economic Dynamics and Control,
2:329 – 352.
Granger, C. W., Huangb, B.-N., and Yang, C.-W. (2000). A
bivariate causality between stock prices and exchange
rates: evidence from recent asianflu. The Quarterly
Review of Economics and Finance, 40(3):337–354.
Jain, A., Bansal, R., Kumar, A., and Singh, K. (2015). A
comparative study of visual and auditory reaction ti-
mes on the basis of gender and physical activity levels
of medical first year students. International Journal
of Applied and Basic Medical Research, 5(2):124.
Kalimeri, K., Lepri, B., Aran, O., Jayagopi, D. B., Gatica-
Perez, D., and Pianesi, F. (2012). Modeling domi-
nance effects on nonverbal behaviors using granger
causality. In Proceedings of the 14th ACM internatio-
nal conference on Multimodal interaction, pages 23–
26. ACM.
Kalimeri, K., Lepri, B., Kim, T., Pianesi, F., and Pentland,
A. S. (2011). Automatic modeling of dominance ef-
fects using granger causality. In International Works-
hop on Human Behavior Understanding, pages 124–
133. Springer.
Langner, O., Dotsch, R., Bijlstra, G., Wigboldus, D. H.,
Hawk, S. T., and Van Knippenberg, A. (2010). Pre-
sentation and validation of the radboud faces database.
Cognition and emotion, 24(8):1377–1388.
Li, Z., Zheng, G., Agarwal, A., Xue, L., and Lauvaux, T.
(2017). Discovery of causal time intervals. In Procee-
dings of the 2017 SIAM International Conference on
Data Mining, pages 804–812. SIAM.
Matsuyama, Y., Bhardwaj, A., Zhao, R., Romeo, O., Akoju,
S., and Cassell, J. (2016). Socially-aware animated
intelligent personal assistant agent. In Proceedings of
the 17th Annual Meeting of the Special Interest Group
on Discourse and Dialogue, pages 224–227.
Schneider, D., Glaser, M., and Senju, A. (2017). Au-
tism spectrum disorder. In V. Zeigler-Hill, T.K. Shac-
kelford (Eds.), Encyclopedia of Personality and Indi-
vidual Differences. Springer International Publishing
AG.
Schulze, P. M. (2004). Granger-kausalit
¨
atspr
¨
ufung: Eine
anwendungsorientierte darstellung. Technical report,
Arbeitspapier/Institut f
¨
ur Statistik und
¨
Okonometrie,
STATOEK.
Sheerman-Chase, T., Ong, E.-J., and Bowden, R. (2009).
Feature selection of facial displays for detection of
non verbal communication in natural conversation. In
Computer Vision Workshops (ICCV Workshops), 2009
IEEE 12th International Conference on, pages 1985–
1992. IEEE.
Wegrzyn, M., Vogt, M., Kireclioglu, B., Schneider, J., and
Kissler, J. (2017). Mapping the emotional face. how
individual face parts contribute to successful emotion
recognition. PloS one, 12(5):e0177239.
Zhang, D. D., Lee, H. F., Wang, C., Li, B., Pei, Q., Zhang,
J., and An, Y. (2011). The causality analysis of climate
change and large-scale human crisis. Proceedings of
the National Academy of Sciences, page 201104268.
Causal Inference in Nonverbal Dyadic Communication with Relevant Interval Selection and Granger Causality
497
