
Identifying and Resolving Genome Misassembly Issues Important for
Biomarker Discovery in the Protozoan Parasite, Cryptosporidium
Arthur Morris
1
, Justin Pachebat
1
, Guy Robinson
2
, Rachel Chalmers
2
and Martin Swain
1
1
IBERS, Aberystwyth University, Aberystwyth, U.K.
2
Cryptosporidium Reference Unit, Public Health Wales, Swansea, U.K.
Keywords:
Genomics, Cryptosporidium, Assembly, Biomarker Discovery, Gini, Clinical Microbiology, Pathogen
Genomics.
Abstract:
Cryptosporidium is a protozoan parasite that causes a diarrhoeal disease in humans, and which may be spread
by swimming pools or infected municipal water supplies. It can be a serious health risk for individuals with
weakened immune systems. Genomics has the potential to help control this pathogen, but until recently, it has
not been possible to perform whole genome sequencing directly from human stool samples. This is no longer
the case, and there are now at least a dozen high quality genomes available via resources like CryptoDB and
NCBI, with other isolates being sequenced. The analysis of these genomes will improve current approaches
for tracking sources of contamination and routes of transmission by allowing the identification of biomarkers,
such as multiple-locus variable tandem repeat regions (VNTRs). However, problems remain due to highly
uneven sequence coverage, which causes serious errors and artefacts in the genome assemblies produced by a
number of popular assemblers. Here we discuss these assembly issues, and describe our strategy to generate
genome assemblies of sufficient quality to enable the discovery of new VNTR biomarkers.
1 INTRODUCTION
Cryptosporidium is an Apicomplexan parasite caus-
ing gastrointestinal disease (Cryptosporidiosis) in hu-
mans and animals. In the developing world, Cryp-
tosporidium is one of the main causes of childhood
morbidity. A recent large-scale study has evalu-
ated the aetiology, burden and clinical syndromes
of moderate-to severe diarrhoea across seven sites
in sub-Saharan Africa and South Asia. It identified
Cryptosporidium as contributing to approximately
202,000 deaths per year in children less than 24
months old (Sow et al., 2016). In the UK, C. parvum
and C. hominis cause most cases of Cryptosporidio-
sis. While self-limiting after prolonged duration of
symptoms (2-3 weeks) in immunocompetent hosts,
severely immunocompromised patients suffer severe,
sometimes life threatening disease. C.parvum has a
small, very compact genome, with the IowaII (Abra-
hamsen et al., 2004) reference exhibiting a 9.1Mb
genome, bearing 3,865 genes, of which 89.1% are in-
tronless.
The sequencing and assembly of whole or partial
genomes has become an essential tool in modern sci-
ence, facilitating research in every area of biology.
A primary concern for Cryptosporidium is extract-
ing from clinical samples sufficient amounts of high
quality, low contaminant DNA for sequencing. With-
out this, sequencing may result in low coverage se-
quence, variable sequencing depth and poor quality
genome assemblies. In the area of Cryptosporidio-
sis the impact of genomics has been limited by the
need to propagate the parasite in animals to gener-
ate enough oocysts from which to extract DNA of
sufficient quantity and purity for analysis (Abraham-
sen et al., 2004). In 2015 this problem was over-
come through an approach that now allows genomic
Cryptosporidium DNA suitable for whole genome se-
quencing to be prepared directly from human stool
samples (Hadfield et al., 2015). Hadfield et al. (2015)
applied their method to the whole genome sequencing
of eight C. parvum and C. hominis isolates. Presently,
the Cryptosporidium genomics resource, CryptoDB
(Puiu et al., 2004), currently gives access to 13 com-
plete genomes, with a total of 10 available from the
NCBI.
Currently clinical diagnosis of Cryptosporidium
relies on conventional genotyping tests. The availabil-
ity of whole Cryptosporidium genome sequences pro-
vides much higher resolution information for geno-
90
Morris, A., Pachebat, J., Robinson, G., Chalmers, R. and Swain, M.
Identifying and Resolving Genome Misassembly Issues Important for Biomarker Discovery in the Protozoan Parasite, Cryptosporidium.
DOI: 10.5220/0007397200900100
In Proceedings of the 12th International Joint Conference on Biomedical Engineering Systems and Technologies (BIOSTEC 2019), pages 90-100
ISBN: 978-989-758-353-7
Copyright
c
2019 by SCITEPRESS – Science and Technology Publications, Lda. All rights reserved

typing. In addition, the genomes can be used to study
a wide array of aspects of pathogen biology, such as
identity, taxonomy in relation to other pathogens, sen-
sitivity or resistance to drugs, development of novel
therapeutic agents, virulence, and epidemiology. Our
interest is to build on current genotyping tests by de-
veloping a standardised multi-locus typing scheme.
This will allow sources of contamination and routes
of transmission to be characterized and compared in a
cost- and time-efficient manner (Perez-Cordon et al.,
2016; Chalmers et al., 2017). Here variable-number
of tandem-repeats (VNTR) are used, with recent in-
vestigations concluding that additional loci need to
be identified and validated (Chalmers et al., 2017).
Our work is building on that of Perez-Cordon et al.
(2016), who used Tandem Repeats Finder (Benson,
1999) to identify polymorphic VNTR’s around the
genome of C. parvum, and analysed them for vari-
ation across the eight genomes sequenced by Had-
field et al. (2015). We aim to use whole genome
sequencing of additional isolates and species to help
achieve this goal, but this work is hapered by the
quality of available genome sequences (Perez-Cordon
et al., 2016).
This paper is structured as follows. First, we ex-
plain the quality issues associated with genome se-
quences extracted from clinical stool samples. Then
we describe our methods, including the data sets used,
a novel metric we use to measure the distribution of
read depth in a set of sequenced reads, and the process
of assembly with the identification of misassemblies.
In the results and discussion sections, we summarise
properties of the sequenced reads, show how they can
lead to misassemblies, and give evidence of the types
of misassembly we encounter. We also describe how
our novel metric can explain some of these assembly
errors. Finally, we conclude with a brief outline the
strategy we use to generate genome assemblies of suf-
ficient quality to use for the discovery of novel VN-
TRs.
2 THE PROBLEM
Although it is possible to derive high quality Cryp-
tosporidium DNA by culturing the parasite in donor
animals (Abrahamsen et al., 2004), this is expensive
and time consuming, and is not appropriate for clin-
ical samples, where maintaining sequence identity is
essential. Sequencing Cryptosporidium from clinical
samples suffers from three major problems:
• The yield of oocysts from clinical samples is low.
• The oocysts are extracted directly from faeces, ne-
cessitating extensive cleaning and purification be-
fore DNA extraction.
• The DNA yield per oocyst is low.
These three problems commonly result in se-
quenced data sets with very uneven depth of coverage,
which makes assembly and analysis difficult. Un-
even sequencing depth has been identified in datasets
obtained from published and unpublished paired end
read libraries generated by different groups, and
which were prepared using the standard Nextera XT
DNA sample preparation kit. Uneven sequencing
depth may lead to genome misassembly, and we have
identified this an issue with a number of popular de
novo assemblers. Poor quality genome assemblies
can find their way into public repositories of genome
sequence and this can confound the development of
novel prevention strategies, therapeutics, and diag-
nostic approaches.
3 METHOD
Our initial choice of assembly software was to use
SPAdes (Bankevich et al., 2012), following the Had-
field et al. (2015) paper. However, after aligning the
assembled genomes to the reference genome, and vi-
sualising genome features such as genes and VNTRs,
a number of issues became apparent (see Figure 4)
such as the transfer of large sequence fragments be-
tween chromosomes. We assumed this was a compu-
tational artefact, rather than a true biological signal,
and therefore we have investigated the assembly pro-
cess in the following manner.
3.1 Dataset
We used the dataset presented by Hadfield et al. (Had-
field et al., 2015), consisting of 7 UK isolates of
Cryptosporidium parvum and 3 UK isolates of Cryp-
tosporidium hominis: UKP2 to UKP8 & UKH3 to
UKH5. An updated C. parvum IowaII reference as-
sembly was utilised, which included all 8 chromo-
somes resolved, rather than the 18 fragment IowaII
assembly (Abrahamsen et al., 2004) that was used
by Hadfield et al. This dataset was used because
they currently represent the largest collection of pub-
lished Cryptosporidium draft genomes from clinical
isolates.
For the purpose of identifying a correlation be-
tween genes transferred to chimeric regions and Gini,
unpublished isolates consisting of 29 UK C. parvum
and 19 UK C. hominis isolates where also used.
Identifying and Resolving Genome Misassembly Issues Important for Biomarker Discovery in the Protozoan Parasite, Cryptosporidium
91
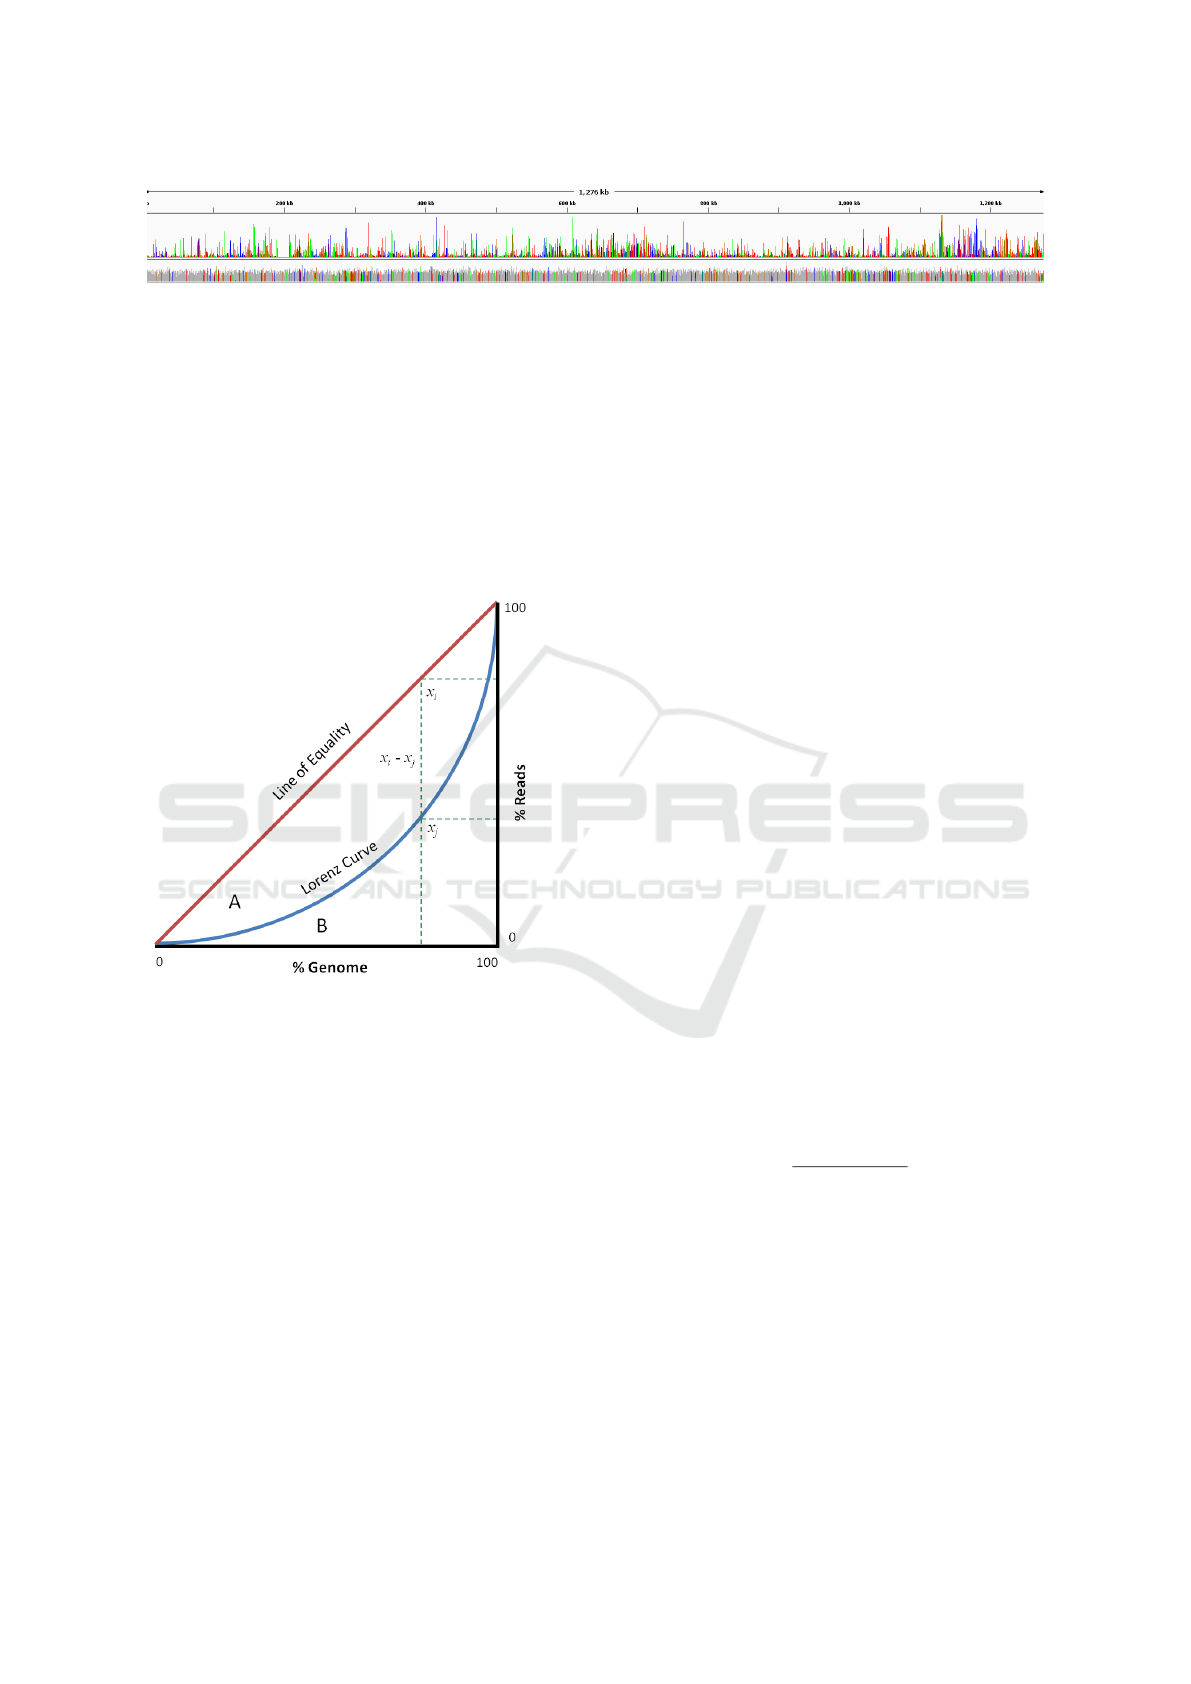
Figure 1: Coverage across chromosome 7 of the C.parvum UKP3 (top track) and IowaII reference (bottom track) genomes to
illustrate the extreme coverage inequality of the UKP3 isolate genome (UKP3 Gini = 0.5489, IowaII Gini = 0.112). Image
produced using IGV. Note that the IowaII DNA sequences were derived from an animal model, and have low or ”normal”
read depth variation, whereas UKP3 is more typical of DNA sequences extracted from clinical samples.
3.2 Sequenced Read Analysis
The reads were mapped to a reference genome (C.
parvum IowaII for C. parvum and C. hominis TU502
(Xu et al., 2004) for C. hominis) using Bowtie2
v2.3.3.1. (Langmead et al., 2009) Coverage analy-
sis was then performed using Samtools v1.5 (Li and
Durbin, 2009).
Figure 2: Graphical representation of the Gini coefficient.
In this graph, the Gini coefficient can be calculated as
A/(A + B), which represented area under the Lorenz curve
(blue) inversely proportional to the line of equality (red).
The green dotted lines denote the percentage of reads which
cover 80% of a genome used to generate the Lorenz curve
(poor coverage depth equality) as compared to a perfect dis-
tribution of reads.
Read depth was calculated using the ’depth’ tool
within the samtools package. The Gini coefficient is a
measure used to identify inequality in the distribution
of a quantifiable metric. It is commonly used in eco-
nomics to measure income inequality within a pop-
ulation, where it is represented by a value between
0 and 1, with 0 representing perfectly even distribu-
tion, and higher values representing higher inequality
of distribution. Here we have applied this coefficient
to measure inequality of depth of coverage across a
genome. For each of the 10 Hadfield genomes, we
calculated the Gini coefficient of read depth. The Gini
coefficient is defined using the following equation:
G = A/(A + B)
where A is the area under the line of equality, and
B the area under the Lorenz curve, on the graph of
distribution inequality (see Figure 2). The green dot-
ted lines (marked at 80% on the x axis) in Figure 2
gives an example of how, in the dataset used to gener-
ate the Lorenz curve, 80% of the genome is covered
by only 40% of reads (the value at the position of col-
lision of the green dotted line on the y axis), whereas
in a perfect distribution it would be covered by 80%
of reads.
The algorithm for calculating a genome’s Gini co-
efficient of read depth coverage involves first calcu-
lating the mean depth of coverage of 1Kb windows
over the genome. These windows are ordered accord-
ing to their depth of coverage values, and these values
rescaled between 0 and 100. This ordered set of read
depth values is used to generate the Lorenz curve, L,
where the value at every position i on the curve rep-
resents the sum of all values at positions ≤ i. A line
of equality, E, was generated to represent perfectly
even distribution of reads across a genome. The dif-
ference between the values at each position on E and
L is then calculated and the summed inverse propor-
tional difference (The Gini coefficient) of these values
calculated. This was performed using the following
equation:
G =
n
∑
i=1
n
∑
j=1
|x
i
− x
j
|
2n
n
∑
i=1
x
i
where n refers to the number of windows (read
depth values) across the genome, x
i
is a depth of cov-
erage value at position i on the line of equality E, and
x
j
is the value at position j on the Lorenz curve L.
The Gini coefficient for each genome represents
the unevenness of read depth across the genome se-
quence (an example of uneven coverage across chro-
mosome 7 of UKP3 as compared to Iowa II can be
seen in Figure 1).
BIOINFORMATICS 2019 - 10th International Conference on Bioinformatics Models, Methods and Algorithms
92
3.3 De novo Assembly
First de novo assembly was undertaken in the same
manner as those reported by Hadfield et al. (2015).
SPAdes v3.7.1 (Bankevich et al., 2012) de novo as-
sembler was used to construct scaffolds from paired
end read files. Kmer sizes of 23, 33, 55, 65, 77 & 89
were used in the assembly, with 1 iteration used for er-
ror correction, repeat resolution was enabled and the
coverage cut off set to ’off’. Various kmer sizes, cov-
erage cut-offs, repeat masking, and a reference guided
assembly approach were used in an attempt to im-
prove assembly quality.
A second de novo assembly was undertaken using
velvet v1.2.10 de novo assembler (Zerbino and Bir-
ney, 2008) on paired end read files using a maximum
kmer length of 31, coverage cut-off set to auto, cover-
age mask set to 2, and the ’-short’ parameter enabled.
A third assembly was undertaken using IDBA-UD
(Peng et al., 2012), to resolve low coverage regions
whilst attempting to prevent generation of chimeric
fragments during assembly and scaffolding.
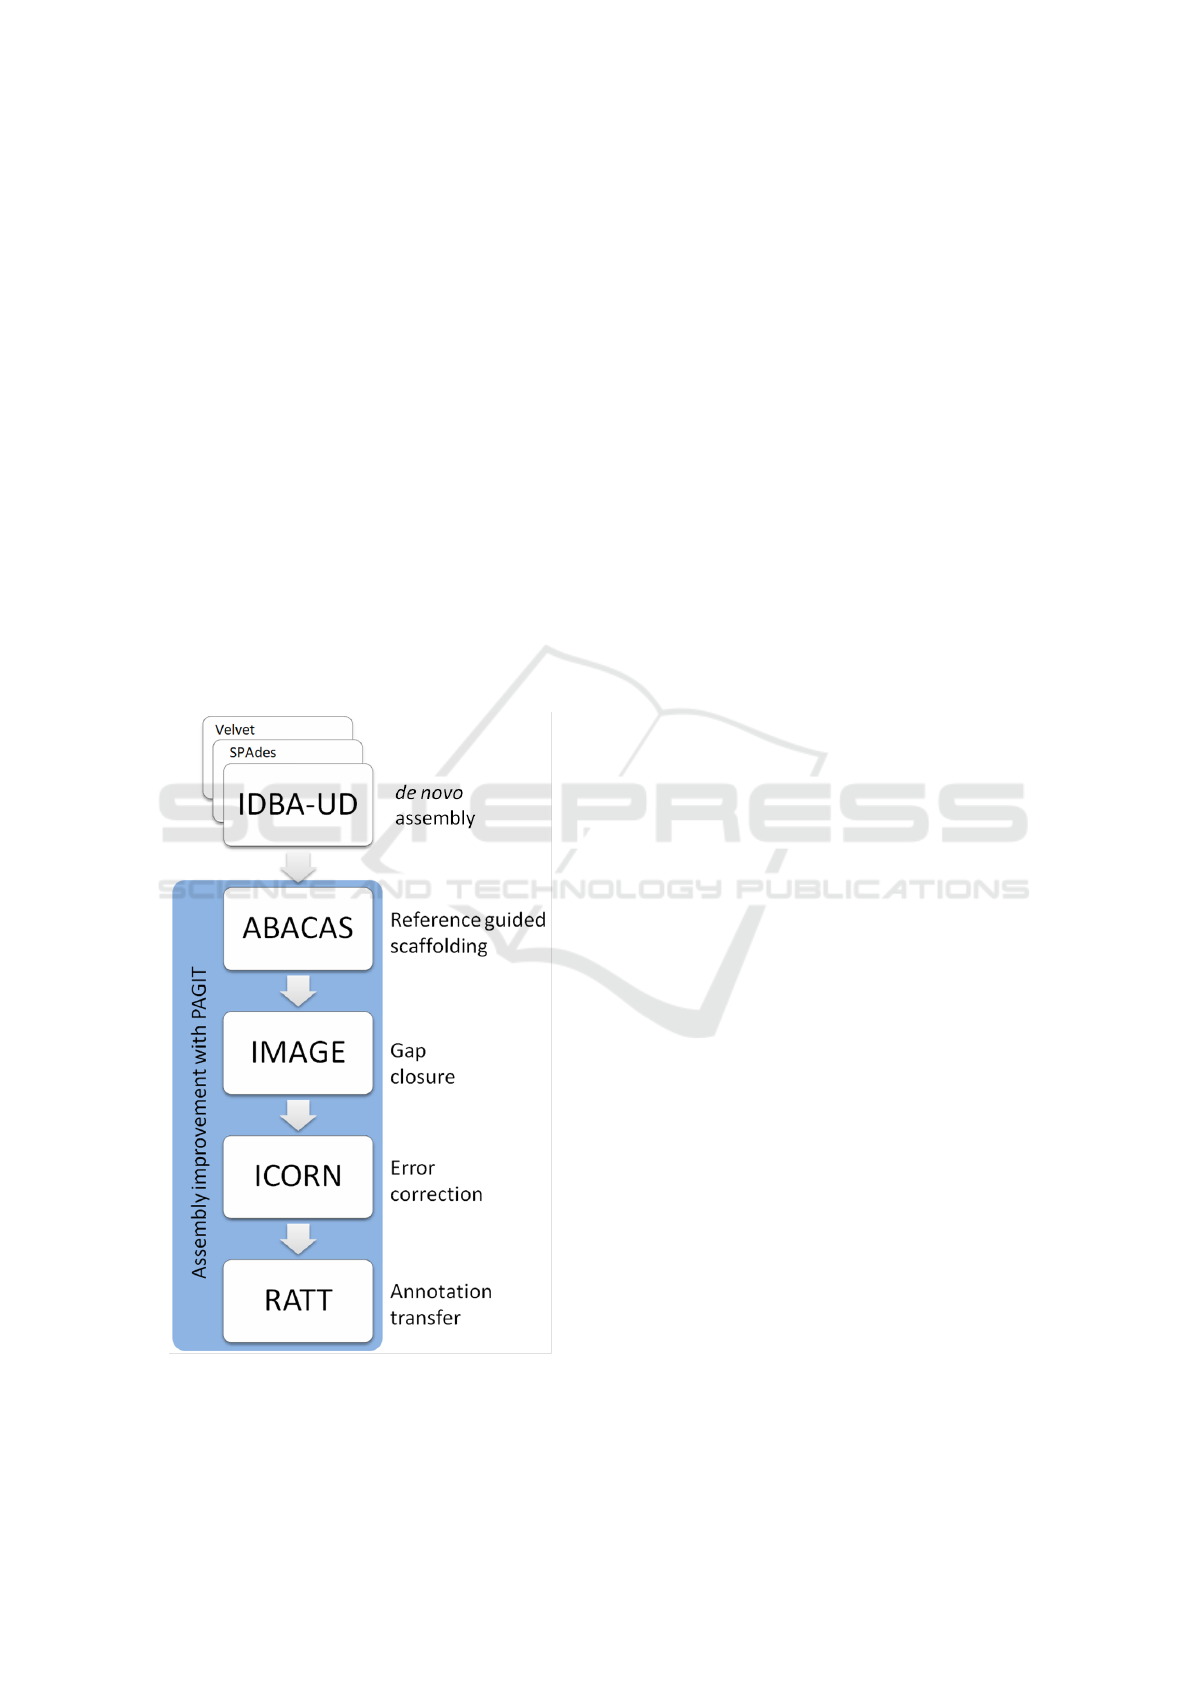
Figure 3: The workflow for assembly, adapted from that
used by Hadfield et al. for the assembly of genomes with
high coverage depth inequality.
3.4 Post Assembly Processing
The assemblies were improved using the Post Assem-
bly Genome Improvement toolkit (PAGIT) (Swain
et al., 2012): a pipeline consisting of four standalone
tools with the aim of improving the quality of genome
assemblies. The tools are, in suggested order of exe-
cution: ABACAS (Assefa et al., 2009), IMAGE (Tsai
et al., 2010), ICORN (Otto et al., 2010), & RATT
(Otto et al., 2011).
The workflow of this assembly pipeline can be
found in Figure 3.
3.4.1 ABACAS: Algorithm based Automatic
Contiguation of Assembled Sequences
ABACAS is a contig-ordering and orientation tool
which is driven by alignment of the draft genome
against a suitable reference. Suitability of the ref-
erence is defined by amino acid similarity of at
least 40%. Alignment is performed by NUCmer or
PROmer from the MUMmer package (Kurtz et al.,
2004): a tool designed for large scale genome align-
ment. Contigs from the draft assembly are positioned
according to alignment to the reference genome, with
spaces between the contigs being filled with ’N’s,
generating a scaffold of the draft assembly.
ABACAS was executed using the updated (All 8
chromosomes resolved) C.parvum IowaII (Abraham-
sen et al., 2004) reference genome with default pa-
rameters.
3.4.2 IMAGE: Iterative Mapping and Assembly
for Gap Extension
IMAGE uses Illumina paired end reads to extend con-
tigs by closing gaps within the scaffolds of the draft
genome assembly. IMAGE uses read pairs where one
read aligns to the end of a contig and the other read
overhangs beyond the end of the contig into the gap.
This gap can then be partially closed using the over-
hanging sequence and by extending the contig.
IMAGE was run in groups of three iterations at
kmer sizes of 91, 81, 71, 61, 51, 41, & 31, totalling
21 iterations. Scaffolding was then performed with
a minimum contig size of 500, joining contigs with
gaps of 300 N’s.
3.4.3 ICORN: Iterative Correction of Reference
Nucleotides
ICORN was developed to identify small errors in the
nucleotide sequence of the draft genome, such as
those which may occur due to low base quality scores.
It was designed to correct small erroneous indels, and
Identifying and Resolving Genome Misassembly Issues Important for Biomarker Discovery in the Protozoan Parasite, Cryptosporidium
93

is not suitable for, or capable of, correcting larger in-
dels or misassemblies.
ICORN was run using 8 iterations and a fragment
size of 300.
3.4.4 RATT: Rapid Annotation Transfer Tool
RATT is an annotation transfer too used to infer or-
thology/homology between a reference genome and a
draft assembly. This is achieved by utilising NUCmer
from the MUMmer package to identify shared syn-
teny between annotated features within the reference
genome, and sequence within the draft assembly. An-
notation files (EMBL format) are produced which
contain regions which are inferred to be common fea-
tures. The regions are filtered and transferred depen-
dant on whether the transfer is between strains (Strain,
similarity rate of 50-94%), species (Species, similar-
ity rate of 95-99%), or different assemblies (Assem-
bly, similarity rate of >=99%).
RATT was run using IowaII annotations in EMBL
format, downloaded from CryptoDB, as a reference.
The Strain parameter was used to transfer feature
annotations to the draft assembly.
3.5 Analysis of Draft Genomes
VNTR’s around the reference and draft genomes
were identified for the purpose of VNTR comparison
and polymorphism analysis. Tandem Repeats Finder
v4.09 (Benson, 1999) was used to identify VNTR’s
around the C. parvum IowaII reference genome using
a matching weight of 2, mismatch and indel penal-
ties of 5, match and indel probabilities of 80 and 10
respectively, minimum score of 50 and maximum pe-
riod size of 15. The number of VNTR’s per gene is
included as a heat map in Figure 4.
3.6 Identification of Misassembly
The draft genomes were analysed in two ways (1)
by transferring gene annotations from the reference
genome to the drafts using RATT, and (2) by align-
ing the contigs (from IDBA-UD) or scaffolds (from
SPAdes/Velvet) from the draft assemblies to the
IowaII reference genome. RATT was used to identify
the number of genes which were transferred between
genomes: it provided a convenient way of identify-
ing putative chimeric regions i.e. regions on a draft
chromosome that contained genes from 2 or more ref-
erence chromosomes. NUCmer was then used to in-
vestigate these putative chimeric regions by perform-
ing whole genome alignments. NUCmer (from the
MUMmer package (Kurtz et al., 2004)) was used with
a minimum length of match set to 100, preventing the
report of small regions of similarity, a maximum gap
of 90, and a minimum cluster length of 65.
3.7 Quality Assessment with Gini
The Gini coefficient for each isolate was calculated
and plotted against the number of genes transferred to
chimeric regions (detailed in section 3.6). The coeffi-
cient of determination (R
2
) was used to calculate the
amount of variance in the number of genes transferred
to chimeric regions explained by the Gini coefficient.
3.8 Data Visualisation
The C.parvum assemblies (UKP2-8) were visualised
alongside the C.parvum IowaII reference genome us-
ing the Circos package v0.69 (Krzywinski et al.,
2009). Mapped reads were visualised using Integra-
tive Genomics Viewer v2.4.16 (Thorvaldsd
´
ottir et al.,
2013).
4 RESULTS
Statistics from the sequencing of the Hadfield et al.
genomes can be found in Table 1. The Gini coefficient
values are high (>0.25) in five of the ten paired end
read libraries. See Figure 1 for an example of how the
Gini value corresponds to actual read depth variation
within UKP3 and IowaII. Apart from the variation in
read depth, the sets of sequences generally appear to
be of good quality, with high genome coverage, and
little sign of contamination.
Table 2 shows the results of assembly using
SPAdes. The results from assembly with Velvet were
comparable to that of SPAdes, and therefore are not
shown here. Table 3 shows the results of assembly us-
ing IDBA-UD. The results shown in these tables in-
dicate that SPAdes produced assemblies with longer
and fewer contigs than IDBA-UD, highlighting the
differences between the assembly approaches adopted
by the assemblers.
Both the assemblies were then run through the
PAGIT pipeline to make the improvements described
in the methods section, including gap closing and the
transfer of gene annotations. The results can be found
in Tables 2 and 3. The SPAdes assemblies required
fewer gaps to be closed by IMAGE. The mean per-
centage of genes transferred by RATT to the improved
SPAdes assemblies is >99%. The mean percentage of
genes transferred to chimeric regions is 10.6%.
BIOINFORMATICS 2019 - 10th International Conference on Bioinformatics Models, Methods and Algorithms
94

Table 1: Bowtie2 mapping statistics for C. parvum and C.
hominis reads generated by Hadfield et al.. The Gini coef-
ficient is included in this table as an indication of uneven
depth of coverage (IowaII=0.112). *C. parvum IowaII, †C.
hominis TU502.
Isolate Total
base
pairs
se-
quenced
(Mb)
Proportion
overall
read
align-
ment
Fraction
of ref.
cov-
ered
Average
cov.
of ref.
seq.
Gini
coef-
ficient
UKH3†305.02 0.903 0.98 34.71 0.1634
UKH4†1828.87 0.845 0.96 209.17 0.4935
UKH5†1765.46 0.809 0.96 201.92 0.2895
UKP2* 426.69 0.819 1.00 46.84 0.2121
UKP3* 1514.83 0.889 0.99 166.42 0.5489
UKP4* 1751.98 0.891 0.99 192.48 0.4693
UKP5* 244.53 0.846 0.99 26.86 0.2895
UKP6* 954.18 0.816 0.99 104.83 0.2106
UKP7* 708.61 0.891 0.99 77.85 0.5494
UKP8* 1587.38 0.837 0.98 174.39 0.5570
Table 2: The assembly statistics (SPAdes and post-PAGIT)
include the number of scaffolds (No.), scaffold N50 metric,
scaffold mean length (Av.), and the total size of the final
assembly. Gene annotations were transferred by RATT out
of a total of 3805 gene annotations in the reference assem-
bly. Genes erroneously transferred refers to genes trans-
ferred to regions which have been identified as chimeric
(and therefore misassemblies). Within C. hominis, the er-
roneous transfers are putative, due to differences between
C. parvum and C. hominis.
Isolate Total length
before PAGIT:
No. N50 Av.
(kb)
Assembly
size
post-
PAGIT
(kb)
Gaps
closed
by
IM-
AGE
Genes
trans-
ferred:
all (erro-
neously)
UKH3 168 149.9 54.0 9293 12 3792 (401)
UKH4 522 57.4 17.5 9594 95 3791 (467)
UKH5 463 54.6 19.6 9357 92 3787 (496)
UKP2 157 216.0 58.2 9254 23 3720 (356)
UKP3 270 109.8 33.7 9336 23 3688 (453)
UKP4 235 175.2 38.7 9226 22 3770 (349)
UKP5 447 70.7 20.3 9271 51 3800 (430)
UKP6 689 332.6 14.1 9826 13 3731 (96)
UKP7 521 62.6 17.3 9257 19 3797 (475)
UKP8 369 93.0 24.7 9473 26 3803 (518)
Table 3 shows the results of assembly using
IDBA-UD, and subsequent improvement and anno-
tation using PAGIT. These genomes benefited greatly
from gap closure by IMAGE over those produced by
SPAdes (see Tables 2 and 3), since gaps in intra-
genic repetitive regions were much more common,
potentially confounding VNTR analysis. The mean
percentage of genes transferred by RATT to the im-
proved IDBA-UD assemblies is 98%. The mean per-
centage of genes transferred to chimeric regions is
Table 3: Statistics for draft genomes assembled using
IDBA-UD as per Table 2.
Isolate IDBA-UD
assembly
statistics:
No. N50 Av.
(kb)
Assembly
size
post-
PAGIT
(kb)
Gaps
closed
by
IM-
AGE
Genes
trans-
ferred:
all (erro-
neously)
UKH3 419 52.9 21.5 9102 104 3757 (0)
UKH4 627 39.7 14.3 9212 229 3688 (44)
UKH5 619 38.7 14.5 9197 247 3699 (32)
UKP2 360 63.9 25.2 9143 241 3776 (0)
UKP3 563 47.8 16.0 9168 312 3767 (1)
UKP4 509 53.7 17.7 9154 292 3772 (0)
UKP5 1830 11.2 4.8 9273 1791 3552 (1)
UKP6 768 51.4 12.1 9135 105 3702 (2)
UKP7 829 32.0 10.7 9184 288 3775 (6)
UKP8 614 40.7 14.7 9177 293 3756 (0)
0.2%. In the IDBA-UD assemblies, the C. hominis
genomes performed slightly worse, with 0, 44, and
32 genes transferred to chimeric regions respectively
across UKH3, UKH4, and UKH5.
The dramatic decrease in the number of genes
transferred to chimeric regions indicates significantly
fewer misassemblies in improved genomes generated
by IDBA-UD than in those of SPAdes, marking a sig-
nificant improvement. This indicates the effectiveness
of using ABACAS to identify gaps within the IDBA-
UD assemblies, and IMAGE to close them, which
SPAdes would resolve during assembly.
NUCmer, from the MUMMER package was used
to identify misassembly, as detailed in section 3.5.
Figure 4 shows the extent of misassembly in the iso-
late genomes, denoted by coloured bars correspond-
ing to which chromosomes regions belong to accord-
ing to NUCmer. Extensive misassembly was iden-
tified in all of the genomes, to varying degrees. The
most consistently misassembled chromosome is chro-
mosome 7, with a consistent chromosome 8 mis-
assembly. The most misassembled isolates where
UKP3 and UKP8, with 8 misassemblies of larger than
10kb. These two isolates have very high Gini scores
(see Table 1), of 0.5489 and 0.5570 respectively.
Figure 5 illustrates a moderate correlation (R
2
=
0.41) between the Gini coefficient and number of mis-
placed genes within misassembled chromosomal re-
gions across 45 isolates of C. parvum and C. hominis.
Table 4 shows the number of VNTR regions that
were missing from the IBDA-UD assemblies before
and after gap closure with IMAGE. These results
show that a large amount of VNTR regions were re-
solved using IMAGE, indicating the importance of
post-assembly genome improvement in the genera-
tion of accurate and reliable genome assemblies.
Identifying and Resolving Genome Misassembly Issues Important for Biomarker Discovery in the Protozoan Parasite, Cryptosporidium
95

Table 4: The number of VNTR regions missing within the
IDBA-UD assemblies pre and post gap closing with IM-
AGE.
Isolate VNTR regions
missing before
IMAGE
VNTR regions
missing post-
IMAGE
UKP2 48 7
UKP3 56 12
UKP4 63 10
UKP5 209 33
UKP6 62 13
UKP7 62 8
UKP8 67 13
Figure 4 shows putatively misassembled regions
(translocations) within the C.parvum UKP2-8 (Had-
field et al., 2015) PAGIT-improved SPAdes assem-
blies. A heatmap showing the number of VNTR’s per
coding sequence (CDS) is included. Every genome
assembly within the dataset exhibits significant mis-
assembly across all chromosomes, particularly at the
terminal end.
5 DISCUSSION
Table 1 indicates high depth of coverage inequal-
ity throughout the genomes, represented by relatively
high Gini coefficient values in comparison to that ex-
hibited by Iowa II (0.112), which the mean depth and
breadth of coverage (fraction of the reference cov-
ered) will not indicate. This appears to be a com-
mon issue when sequencing Cryptosporidium from
human clinical samples. Paired end read libraries ac-
cessed from GenBank, sequenced by the Welcome
Trust Sanger Institute (Bioproject PRJEB3213), and
those published by Troell et al. (2016) (Biopro-
ject PRJNA308172), who was attempting to gener-
ate whole genome sequences from single cells using
whole genome amplification (Troell et al., 2016), also
suffered from very high Gini coefficients, indicating
that this problem is not restricted to a single research
team. Figure 5 indicates that there is some correla-
tion between the Gini coefficient and the amount of
misassembly within genomes assembled by SPAdes.
Although this correlation is weak (R
2
= 0.41).
Whole genome alignments were used to iden-
tify in silico translocation events (considered putative
misassemblies), as detailed in section 3.5. Figure 4 il-
lustrates that translocation occurred in a similar fash-
ion throughout each of the assemblies, with the same
areas being merged into similar chimeric genomes,
as can be seen in chromosome 7, where the initial
120kb region has merged into the end of chromosome
8 throughout all of the genomes. It is interesting to
note that only on UKP3 was a 70kb area from chro-
mosome 5 seen starting at 500kb on chromosome 7.
Similarly only in UKP8 was a unique 70kb translo-
cated region seen in chromosome 7 from chromosome
3. These two genomes bear high Gini coefficients,
as detailed in Table 1, which may contribute to this.
A peculiarity of these misassemblies is the observed
trend of chimeric chromosomes being a result of the
native chromosome being flanked upstream by 80kb
of the downstream extreme portion of the subsequent
chromosome. This is illustrated very clearly in Figure
4.
Taxonomic evaluation carried out by Hadfield et
al. utilising the gp60 marker show that there are five
gp60 subtypes within the C. parvum dataset. This
variation within the Hadfield C. parvum isolates is
supported by Perez-Cordon et al. (Perez-Cordon
et al., 2016) which shows clear variation across 28
VNTR loci, suggesting a number of genetic lineages.
The very low likelihood of similar translocation oc-
curring across different populations of C. parvum in-
dicates that these events are as a result of misassembly
by SPAdes, rather than a biological observations.
Examination of one such chimeric contig (the
chr8-chr7 chimeric region at 0-0.14Mb of UKP3 on
Figure 4) revealed that the region has very low depth
of coverage, with no single read spanning the chromo-
somal fragments. Moreover, the sequences from dif-
ferent chromosomes are joined using a simple ”AT”
repetitive region with only three reads spanning the
repeat region and no reads pairing across it (see Fig-
ure 6). This was observed in a number of other
chimeric interface regions. Due to the low complex-
ity, high repeat rich nature of the Cryptosporidium
genome, coupled with the difficulties associated with
DNA extraction and sequencing of this parasite, there
is insufficient evidence to suggest that this represents
true biological variation. Instead, it may be attributed
to a misassembly by the Spades software. This kind
of assembly error was also typical of the assemblies
produced by using Velvet de novo assembler.
Unlike SPAdes, the IDBA assembler leaves these
sequence fragments unjoined, with the result that sig-
nificantly less chimeric regions are seen in the IDBA
assemblies. This is because IDBA is designed for the
task of assembling genomes of highly uneven depth of
coverage. Although IDBA-UD did not create so many
chimeric contigs, the low complexity regions were of-
ten left unassembled, with the result that CDS regions
contained gaps. Unfortunately, these gaps often in-
cluded the VNTRs that we require for our multi-locus
subtyping scheme.
BIOINFORMATICS 2019 - 10th International Conference on Bioinformatics Models, Methods and Algorithms
96
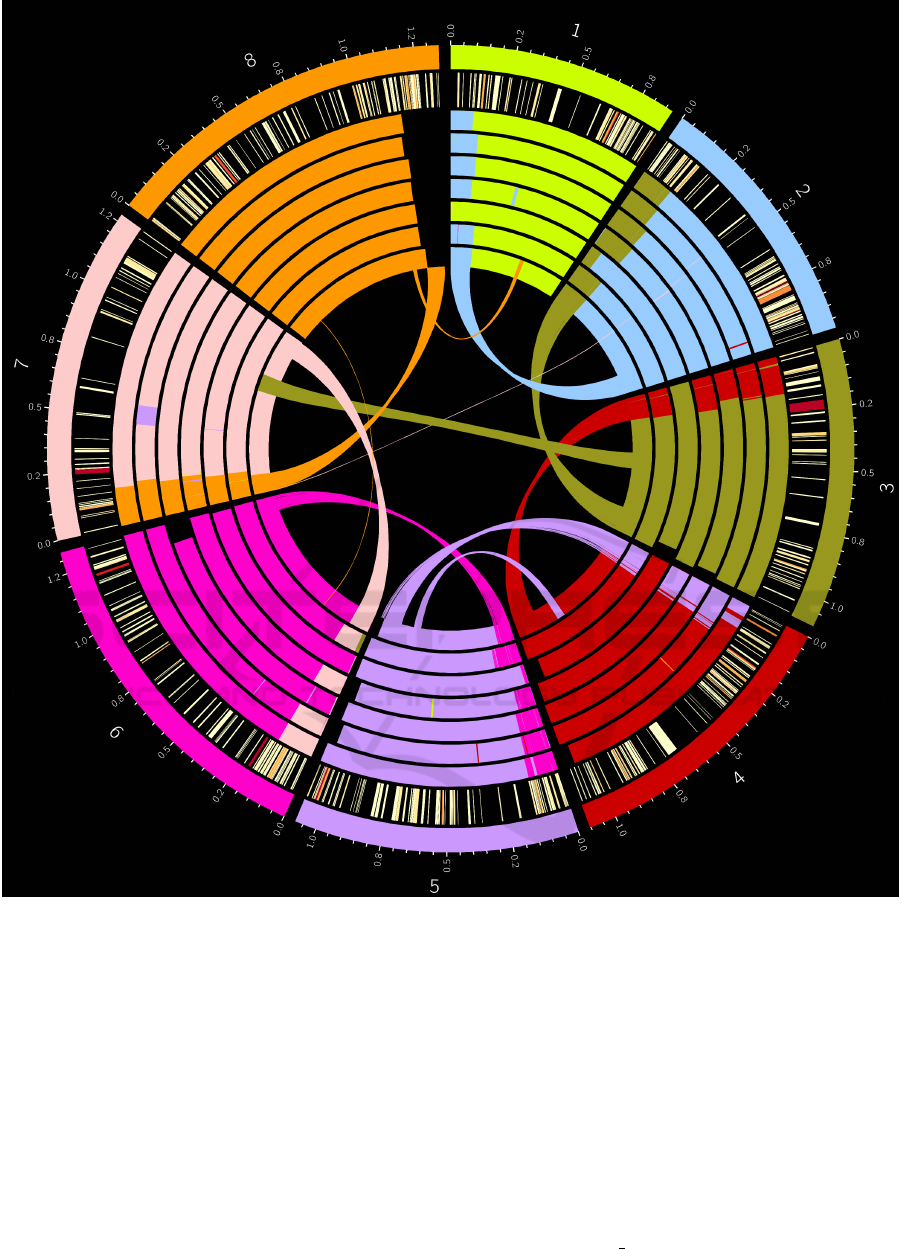
Figure 4: Misassembled regions on each SPAdes assembled Hadfield et al. C.parvum genome. Regions are colour coordinated
by which chromosome of the C.parvum IowaII reference genome (represented by the outer track) they map to. From outermost
to innermost, the inner tracks represent the genomes of each isolate from UKP2-8. The innermost track (UKP8) also includes
a linkage map showing precisely where the regions map to in the IowaII reference genome. The second from outer track
shows a heatmap of genes bearing Tandem Repeats (TRs), from light yellow denoting a single VNTR within the gene to dark
red indicating many TRs within the gene. TRs were identified using Tandem Repeats Finder (see section 3.5).
Both SPAdes and Velvet (data from Velvet not
shown) produced full, ungapped CDS regions (see
Table 2). Thus the IDBA assemblies were not suit-
able for VNTR analysis and further biomarker iden-
tification without significant improvement. PAGIT
was used to improve the genomes from all assemblers
(see section 3.4), and this improved the resolution of
low complexity regions within the IDBA-UD assem-
blies. Within PAGIT, ABACAS performs scaffolding
on the genome assemblies and introduces gaps across
the unassembled regions, the IMAGE tool then per-
forms gap closure on these regions, resulting in high
quality intragenic VNTR’s for biomarker analysis.
An example of a region resolved by IMAGE can
be seen in Figure 7, which shows a multiple align-
ment of the cgd5 350 gene from each of the Had-
Identifying and Resolving Genome Misassembly Issues Important for Biomarker Discovery in the Protozoan Parasite, Cryptosporidium
97
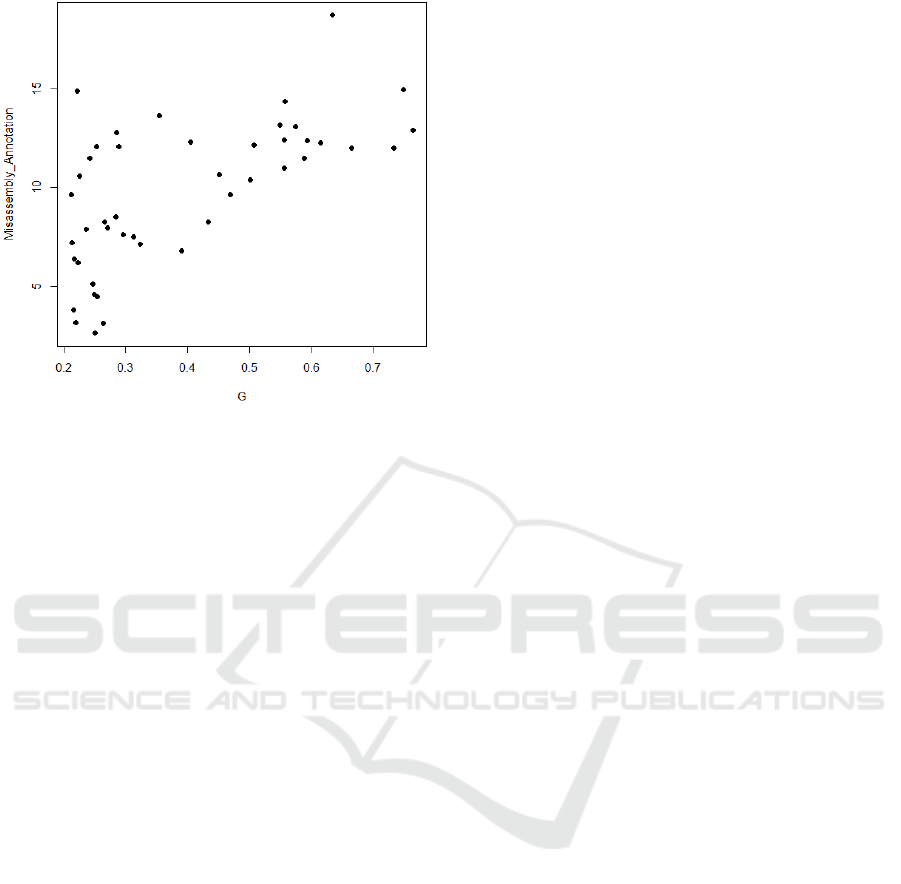
Figure 5: The percentage of genes transferred to chimeric
(misassembled) regions against Gini coefficient of coverage
for 45 isolates of C.parvum and C.hominis. R
2
= 0.41
field C. parvum assemblies. This region exhibits 4
distinct alleles, and can therefore be used to define
specific genotypes: an essential tool of clinical diag-
nostics. The number of gaps closed within the IDBA-
UD assemblies was significantly higher than within
the SPAdes assemblies. This difference in gaps closed
was expected, as IDBA-UD was designed for the pur-
pose of assembling genomes which suffer from poor
depth of coverage equality, and is therefore more con-
servative in extending reads across regions with shal-
low coverage.
The C.parvum assemblies produced by IDBA-
UD and PAGIT exhibited very few misassemblies
compared to the SPAdes assemblies. However,
the C.hominis genomes suffered from a greater
amount of putative misassemblies within the IDBA-
UD genomes, as measured by the number of genes
being transferred between chromosomes. Note that,
genes are transferred from the C.parvum IowaII ref-
erence genome, which is as different, albeit similar
species, and so some biological changes may be ex-
pected. Further analysis is required to fully elimi-
nate assembly error as a cause of these chromosomal
translocations. Table 4 shows that IMAGE is essen-
tial within this workflow for the resolution of repet-
itive regions which are not resolved during assembly
with IDBA-UD. The results show a five to six-fold de-
crease in the number of VNTR regions missing within
the assemblies.
6 CONCLUSION
In this paper we have performed a detailed analy-
sis of 10 Cryptosporidium genomes assembled with
3 popular assemblers. In summary, the results indi-
cate that assembly with IDBA-UD followed by im-
provement with PAGIT (with particular emphasis on
IMAGE) is an effective and reliable way of assem-
bling high quality draft genomes generated using the
protocol detailed by Hadfield et al. (2015). Due to
the protocol required to extract DNA from clinical
samples, these genome sequences often have highly
uneven sequencing depth even if the coverage across
the genome sequence is relatively high. To investi-
gate sequencing depth, we have developed a novel
approach that uses the Gini coefficient to determine
coverage inequality. We found the SPAdes and Vel-
vet assemblies to be problematic, leading to misas-
semblies across low coverage, low complexity re-
gions leading to the creation of chimeric chromo-
somes: up to 15% of all genes were being placed
within these chimeric chromosomes. Although the as-
semblies generated by IDBA-UD did not suffer from
the problem of chimeric sequences, they were prob-
lematic due to a different assembly approach, lead-
ing to a large number of gaps, particularly in repeti-
tive regions. This is a significant issue because these
gaps often contained the VNTR sequences that are
important to us for developing new clinical genotyp-
ing strategies. However, the IMAGE gap closing tool
from the genome improvement pipeline, PAGIT, was
able to resolve these missing low complexity regions.
Using this strategy, of assembly with IDBA followed
by gap closing with IMAGE, we will be able to per-
form more in depth VNTR analysis with the intention
of identifying biomarkers that will facilitate the de-
velopment of novel prevention strategies in the fight
against this important disease.
ACKNOWLEDGMENTS
We would like to thank Grigorio Perez-Cordon for his
helpful discussion and support in the early stages of
this work. This work was funded by the Knowledge
Economy Skills Scholarships (KESS 2), a pan-Wales
higher level skills initiative led by Bangor Univer-
sity on behalf of the HE sector in Wales. It is part
funded by the Welsh Government’s European Social
Fund (ESF) convergence programme for West Wales
and the Valleys.
BIOINFORMATICS 2019 - 10th International Conference on Bioinformatics Models, Methods and Algorithms
98
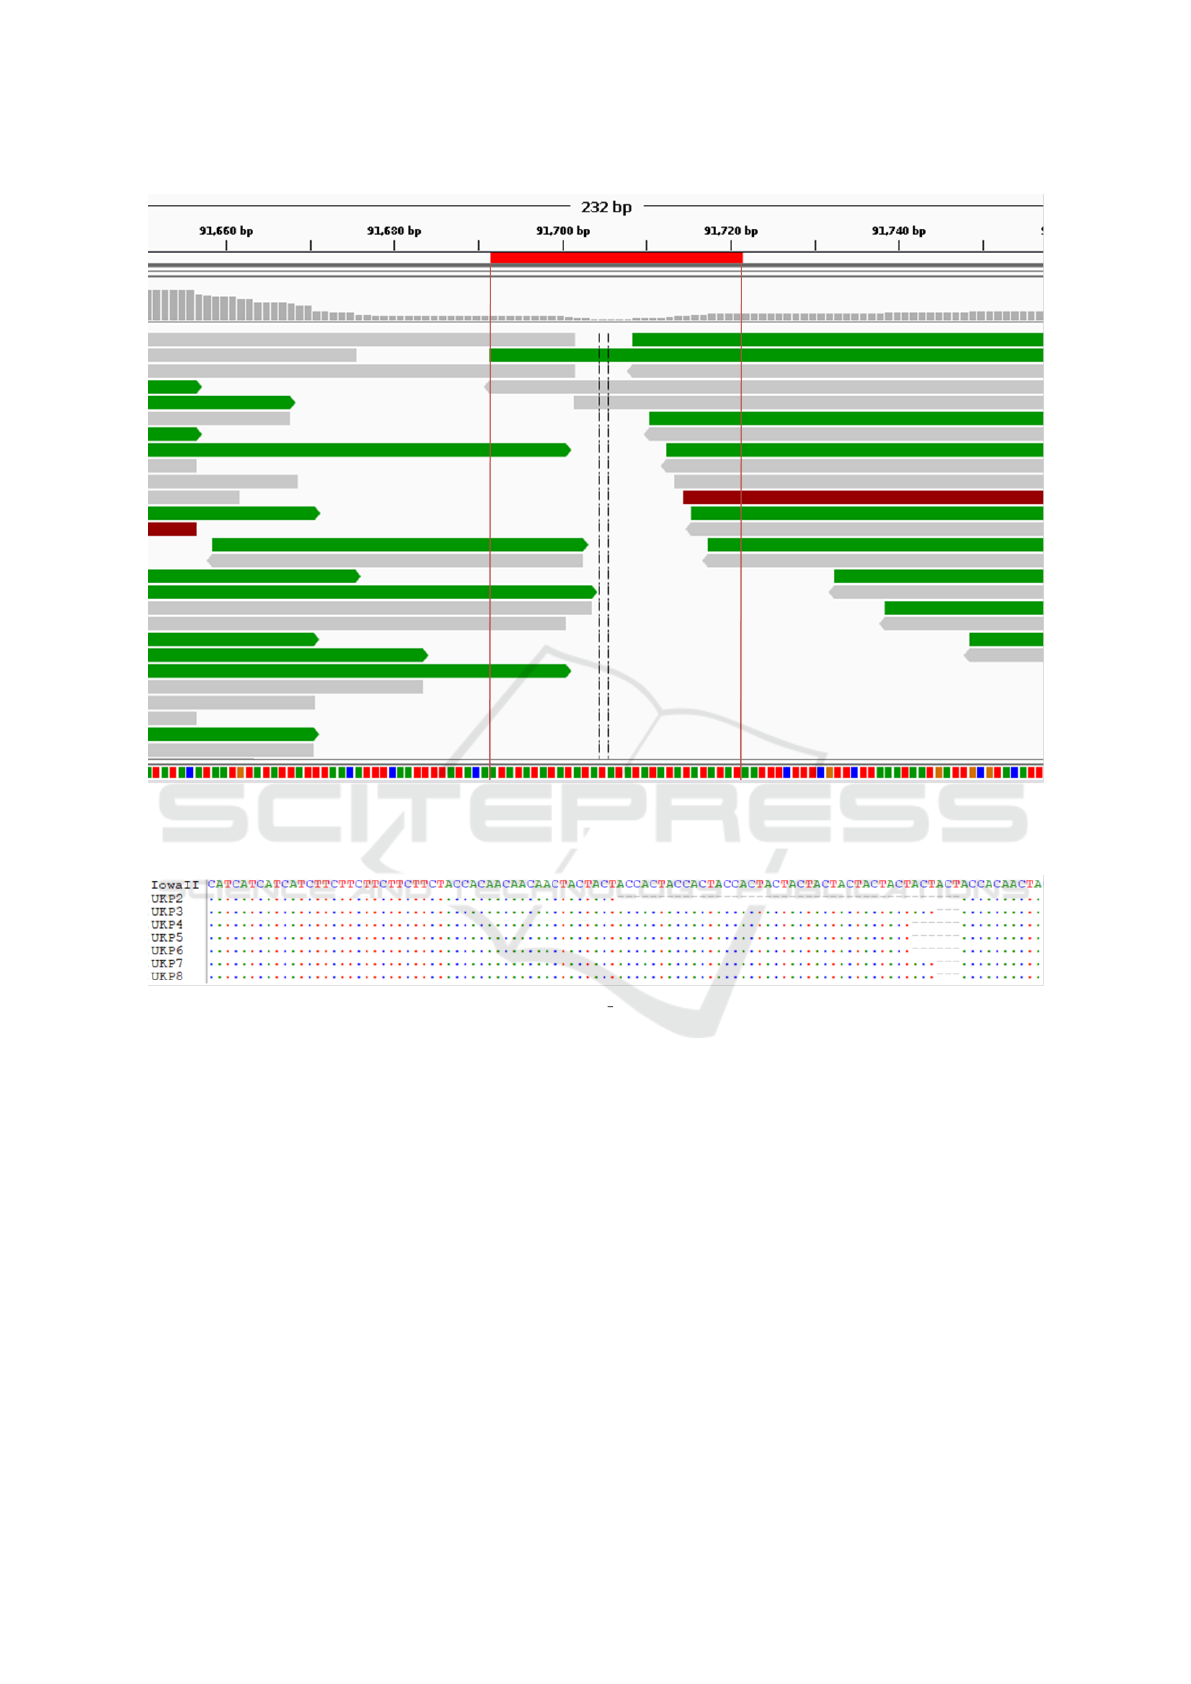
Figure 6: The misassembly interface between fragments from chromosomes 8 and 7 on the chimeric chromosome 7 of UKP3.
Single reads are shown, as is a colourised sequence track (A = Green, T = Red, C = Blue, G = Orange) at the bottom where
the repeat region implicated in the formation of this chimeric contig can be seen. Image produced using IGV.
Figure 7: A multiple alignment of a VNTR region within cgd5 350 in the C. parvum dataset utilised in this paper that was
resolved within IDBA-UD assemblies using IMAGE. Four alleles are seen within this alignment, defined by variation in the
number of ’ACC’ and ’ACT’ codons present within the region. Differences such as this within a VNTR region can be used to
define distinct genotypes, used for diagnostic evaluation.
REFERENCES
Abrahamsen, M. S., Lancto, C. A., Deng, M., Liu, C.,
Bankier, A. T., Dear, P. H., Konfortov, B. A., Spriggs,
H. F., Iyer, L., Anantharaman, V., Aravind, L., Kapur,
V., Templeton, T. J., Enomoto, S., Abrahante, J. E.,
Zhu, G., Widmer, G., Tzipori, S., Buck, G. a., and
Xu, P. (2004). Complete Genome Sequence of the
Apicomplexan, Cryptosporidium parvum. Science,
304(5669):441–445.
Assefa, S., Keane, T. M., Otto, T. D., Newbold, C., and Ber-
riman, M. (2009). ABACAS: Algorithm-based auto-
matic contiguation of assembled sequences. Bioinfor-
matics, 25(15):1968–1969.
Bankevich, A., Nurk, S., Antipov, D., Gurevich, A. A.,
Dvorkin, M., Kulikov, A. S., Lesin, V. M., Nikolenko,
S. I., Pham, S., Prjibelski, A. D., Pyshkin, A. V.,
Sirotkin, A. V., Vyahhi, N., Tesler, G., Alekseyev,
M. a., and Pevzner, P. a. (2012). SPAdes: A New
Genome Assembly Algorithm and Its Applications to
Single-Cell Sequencing. Journal of Computational
Biology, 19(5):455–477.
Benson, G. (1999). Tandem Repeats Finder: a program
to analyse DNA sequences. Nucleic Acids Res.,
27(2):573–578.
Chalmers, R. M., Robinson, G., Hotchkiss, E., Alexander,
C., May, S., Gilray, J., Connelly, L., and Hadfield, S. J.
(2017). Suitability of loci for multiple-locus variable-
number of tandem-repeats analysis of Cryptosporid-
ium parvum for inter-laboratory surveillance and out-
break investigations. Parasitology, 144(1):37–47.
Identifying and Resolving Genome Misassembly Issues Important for Biomarker Discovery in the Protozoan Parasite, Cryptosporidium
99

Hadfield, S. J., Pachebat, J. A., Swain, M. T., Robinson,
G., Cameron, S. J., Alexander, J., Hegarty, M. J., El-
win, K., and Chalmers, R. M. (2015). Generation of
whole genome sequences of new Cryptosporidium ho-
minis and Cryptosporidium parvum isolates directly
from stool samples. BMC genomics, 16:650.
Krzywinski, M., Schein, J., Birol, n., Connors, J., Gas-
coyne, R., Horsman, D., Jones, S. J., and Marra, M. A.
(2009). Circos. Genome Research, 19(9):1639–1645.
Kurtz, S., Phillippy, A., Delcher, A. L., Smoot, M.,
Shumway, M., Antonescu, C., and Salzberg, S. L.
(2004). Versatile and open software for comparing
large genomes. Genome biology, 5(2):R12.
Langmead, B., Trapnell, C., Pop, M., and Salzberg, S.
(2009). Ultrafast and memory-efficient alignment of
short DNA sequences to the human genome. Genome
biology, 10(3):R25.
Li, H. and Durbin, R. (2009). Fast and accurate short read
alignment with Burrows-Wheeler transform. Bioin-
formatics, 25(14):1754–1760.
Otto, T. D., Dillon, G. P., Degrave, W. S., and Berriman,
M. (2011). RATT: Rapid Annotation Transfer Tool.
Nucleic Acids Research, 39(9):1–7.
Otto, T. D., Sanders, M., Berriman, M., and Newbold, C.
(2010). Iterative correction of reference Nucleotides
(iCORN) using second generation sequencing tech-
nology. Bioinformatics, 26(14):1704–1707.
Peng, Y., Leung, H. C. M., Yiu, S. M., and Chin, F. Y. L.
(2012). IDBA-UD: A de novo assembler for single-
cell and metagenomic sequencing data with highly un-
even depth. Bioinformatics, 28(11):1420–1428.
Perez-Cordon, G., Robinson, G., Nader, J., and Chalmers,
R. M. (2016). Discovery of new variable number tan-
dem repeat loci in multiple Cryptosporidium parvum
genomes for the surveillance and investigation of out-
breaks of cryptosporidiosis. Experimental Parasitol-
ogy, 169(August):119–128.
Puiu, D., Enomoto, S., Buck, G. A., Abrahamsen, M. S.,
and Kissinger, J. C. (2004). CryptoDB: the Cryp-
tosporidium genome resource. Nucleic Acids Re-
search, 32(90001):329D–331.
Sow, S. O., Muhsen, K., Nasrin, D., Blackwelder, W. C.,
Wu, Y., Farag, T. H., Panchalingam, S., Sur, D.,
Zaidi, A. K., Faruque, A. S., Saha, D., Adegbola, R.,
Alonso, P. L., Breiman, R. F., Bassat, Q., Tamboura,
B., Sanogo, D., Onwuchekwa, U., Manna, B., Ra-
mamurthy, T., Kanungo, S., Ahmed, S., Qureshi, S.,
Quadri, F., Hossain, A., Das, S. K., Antonio, M., Hos-
sain, M. J., Mandomando, I., Nhampossa, T., Ac
´
acio,
S., Omore, R., Oundo, J. O., Ochieng, J. B., Mintz,
E. D., O’Reilly, C. E., Berkeley, L. Y., Livio, S., Ten-
nant, S. M., Sommerfelt, H., Nataro, J. P., Ziv-Baran,
T., Robins-Browne, R. M., Mishcherkin, V., Zhang,
J., Liu, J., Houpt, E. R., Kotloff, K. L., and Levine,
M. M. (2016). The Burden of Cryptosporidium Diar-
rheal Disease among Children < 24 Months of Age
in Moderate/High Mortality Regions of Sub-Saharan
Africa and South Asia, Utilizing Data from the Global
Enteric Multicenter Study (GEMS). PLoS Neglected
Tropical Diseases, 10(5):1–20.
Swain, M. T., Tsai, I. J., Assefa, S. a., Newbold, C., Berri-
man, M., and Otto, T. D. (2012). A post-assembly
genome-improvement toolkit (PAGIT) to obtain an-
notated genomes from contigs. Nature protocols,
7(7):1260–84.
Thorvaldsd
´
ottir, H., Robinson, J. T., and Mesirov, J. P.
(2013). Integrative Genomics Viewer (IGV): High-
performance genomics data visualization and explo-
ration. Briefings in Bioinformatics, 14(2):178–192.
Troell, K., Hallstr
¨
om, B., Divne, A. M., Alsmark, C.,
Arrighi, R., Huss, M., Beser, J., and Bertilsson, S.
(2016). Cryptosporidium as a testbed for single
cell genome characterization of unicellular eukary-
otes. BMC Genomics, 17(1):1–12.
Tsai, I. J., Otto, T. D., and Berriman, M. (2010). Improving
draft assemblies by iterative mapping and assembly of
short reads to eliminate gaps. Genome Biology, 11(4).
Xu, P., Widmer, G., Wang, Y., Ozald, L., Alves, J., Serrano,
M. G., Puiu, D., Manque, P., Akiyoshi, D., Mackey,
A., Pearson, W., Dear, P. H., Bankier, A. T., Peterson,
D., Abrahamsen, M. S., Kapur, V., Tzipori, S., and
Buck, G. A. (2004). The Genome of Cryptosporidium
hominis. Letters to Nature, 431(October).
Zerbino, D. R. and Birney, E. (2008). Velvet: Algo-
rithms for de novo short read assembly using de Bruijn
graphs. Genome Research, 18(5):821–829.
BIOINFORMATICS 2019 - 10th International Conference on Bioinformatics Models, Methods and Algorithms
100
