
Transfer and Extraction of the Style of Handwritten Letters using Deep
Learning
Omar Mohammed
1,2
, G
´
erard Bailly
1
and Damien Pellier
2
1
Univ. Grenoble Alpes, CNRS, Grenoble INP, GIPSA-lab, 38000 Grenoble, France
2
Univ. Grenoble Alpes, CNRS, LIG, 38000 Grenoble, France
Keywords:
Generative Models, Deep Learning, Online Handwriting, Style Extraction.
Abstract:
How can we learn, transfer and extract handwriting styles using deep neural networks? This paper explores
these questions using a deep conditioned autoencoder on the IRON-OFF handwriting data-set. We perform
three experiments that systematically explore the quality of our style extraction procedure. First, We compare
our model to handwriting benchmarks using multidimensional performance metrics. Second, we explore the
quality of style transfer, i.e. how the model performs on new, unseen writers. In both experiments, we improve
the metrics of state of the art methods by a large margin. Lastly, we analyze the latent space of our model, and
we show that it separates consistently writing styles.
1 INTRODUCTION
One aspect of a successful human-machine interface
(e.g. human-robot interaction, chatbots, speech, hand-
writing, etc.) is the ability to have a personalized inter-
action. This affects the overall human experience, and
allow for a more fluent interaction. At the moment,
there is a lot of work that uses machine learning in
order to model for such interactions. However, most of
these models do not address the issue of personalized
behavior: they try to average over the different exam-
ples from different people in the training set. Identify-
ing the human styles during the training and inference
time opens the possibility of biasing the model’s out-
put to take into account human preferences. In this
paper, we focus on the problem of extracting styles in
the context of handwriting.
Defining and extracting handwriting styles is a
challenging problem, since there is no formal defini-
tion for these styles (i.e. it is an ill-posed problem). A
style is both social – depends on writer’s training, espe-
cially at middle school – and idiosyncratic – depends
on the writer’s shaping (letter roundness, sharpness,
size, slope, etc.) and force distribution across time. To
add to the problem, till recently, there were no metrics
to assess the quality of handwriting generation.
Therefore, there are two questions: how can we
disentangle tasks and styles? and what is the style
used to achieve a given task?. In handwriting, the task
space is well defined (i.e. which letter to write), thus,
allowing us to focus on the second question, extracting
styles for achieving this task.
In this paper, we address the problem of style ex-
traction by using a conditioned-temporal deep autoen-
coder model. The conditioning is performed on the
letter identity (i.e., the task). The reason we use an
autoencoder is that there is no explicit way to evaluate
the quality of the handwriting styles other than using
them to generate handwriting, and evaluate this gener-
ation. In previous work (Mohammed et al., 2018), we
introduced benchmarks and evaluation metrics in order
to assess the quality of generating handwritten letters.
In comparison to this work, we achieve higher perfor-
mance, while extracting a meaningful latent space.
We also hypothesize that the latent space of styles
is generic, i.e. that it will generalize over unseen writ-
ers, thus achieving a “transfer of style”. To test this
hypothesis, we assess our model on 30 new writers.
We compare the tracings generated by this model to a
benchmark model already proposed for online hand-
writing generation.
In addition, we explore the latent space of our
model for each letter separately. This revealed that
there is a limited number of ’unique’ categorical styles
per letter. We report our analysis for some of the let-
ters, since a full analysis is out of the scope for this
paper.
The contributions of this paper are the following:
•
We test and compare our deep conditioned autoen-
coder with the state of the art benchmarks. We
Mohammed, O., Bailly, G. and Pellier, D.
Transfer and Extraction of the Style of Handwritten Letters using Deep Learning.
DOI: 10.5220/0007388606770684
In Proceedings of the 11th International Conference on Agents and Artificial Intelligence (ICAART 2019), pages 677-684
ISBN: 978-989-758-350-6
Copyright
c
2019 by SCITEPRESS – Science and Technology Publications, Lda. All rights reserved
677

show that this model greatly improves the genera-
tion performance over a state of the art benchmark
model.
•
We experiment on performing style transfer on
new writers using this model achieves, and we
show that it achieves much better results than the
benchmark model.
•
Finally, and maybe most interestingly, we further
analyze the extracted the latent space from our
model to show that there is a limited number of
styles for each letter and that the style manifold is
not a continuous space.
2 RELATED WORK
2.1 Generative Models
Recent advances in deep learning (Goodfellow et al.,
2016) architectures and optimization methods led to re-
markable results in the area of generative models. For
static data, like images, the mainstream research builds
on the advances in Variational Autoencoders (Kingma
and Welling, 2013) and Generative Adversarial Net-
works (Goodfellow et al., 2014).
For generating sequences, the problem is more dif-
ficult: the model generates one frame at a time, and
the final result must be coherent over long sequences.
Recent recurrent neural networks architectures, like
Long-Short Term Memory (LSTM) (Hochreiter and
Schmidhuber, 1997) and Gated Recurrent Units (GRU)
(Chung et al., 2014), achieve unprecedented perfor-
mance in handling long sequences.
These architectures has been used in many applica-
tions, like learning language models (Sutskever et al.,
2014), image captioning (Vinyals et al., 2015), mu-
sic generation (Briot and Pachet, 2017) and speech
synthesis (Oord et al., 2016).
We use these powerful tools to extract meaning-
ful latent spaces for styles. Our work is strongly in-
spired by the seminal work performed by (Ha and Eck,
2017). They investigated the problem of sketch draw-
ing (Google, 2017) using a Variational Autoencoder.
The latent space that emerged from training encoded
meaningful semantic information about these draw-
ings. We use here a similar architecture, without the
variational part, showing a similar behaviour.
2.2 Data Representation
For handwriting, a continuous coordinate representa-
tion (e.g. continuous X, Y) seems the natural option.
However, generating continuous data is not straight-
forward. Traditionally, in neural networks, when we
want to output a continuous value, a simple linear or
Tanh activation function is used in the output layer of
the neural network.
However, Bishop (Bishop, 1994) studied the lim-
itations of these functions and showed that they can
not model rich distributions. In particular, when the
input can have multiple outputs (one-to-many), these
functions will average over all the outputs. He pro-
posed the use of Gaussian Mixture Model (GMM) as
the final activation function of a neural network. The
alliance of neural networks and GMMs is called Mix-
ture Density Network (MDN). The training consists in
optimizing the GMM parameters (mean, standard devi-
ation, covariance). The inference is done by sampling
from the GMM distribution.
To simplify the process, and focus our study on
investigating of styles, we extract two features for the
tracings: directions and speed (explained in section
3), and we quantize these features. Thus, we model
each point in the letter tracings as two categorical
distributions, and use two SoftMax functions (one for
each feature) as the outputs of the network, which is
much simpler than MDN. This was inspired by the
studies done in (Oord et al., 2016), where they report
impressive results on originally continuous data, using
suitable quantization policy. Categorical distributions
are more flexible and generic than continuous ones.
2.3 Evaluation Metrics
The objective evaluation of a generative model perfor-
mance is a challenging task, since there is no consen-
sus for objective evaluation metrics. In many cases,
a subjective evaluation is performed to overcome this
problem. For handwriting of Chinese letters, (Chang
et al., 2018) proposed two metrics: Content accuracy
and Style discrepancy. In the first metric, a classifier
is trained to determine the type of the letter on the
reference letters, then it is used to evaluate the gener-
ated letters. However, it is not clear how to reliably
use the classifier trained on one distribution (reference
letters) to evaluate new distribution (the generated let-
ters). The second metric is not applicable to our case,
since it assumes the use of Convolution Neural Net-
work (CNN) on the image of the letter, while we use
the pen sequence of drawing the letter (i.e., temporal
data) with RNNs.
We use the same metrics like in (Mohammed et al.,
2018) to evaluate the quality of handwriting generation:
the BLEU score (Papineni et al., 2002) – a metric
widely used in text translation and image captioning –
and the End of Sequence (EoS) analysis (both metrics
are explained in section 5).
ICAART 2019 - 11th International Conference on Agents and Artificial Intelligence
678
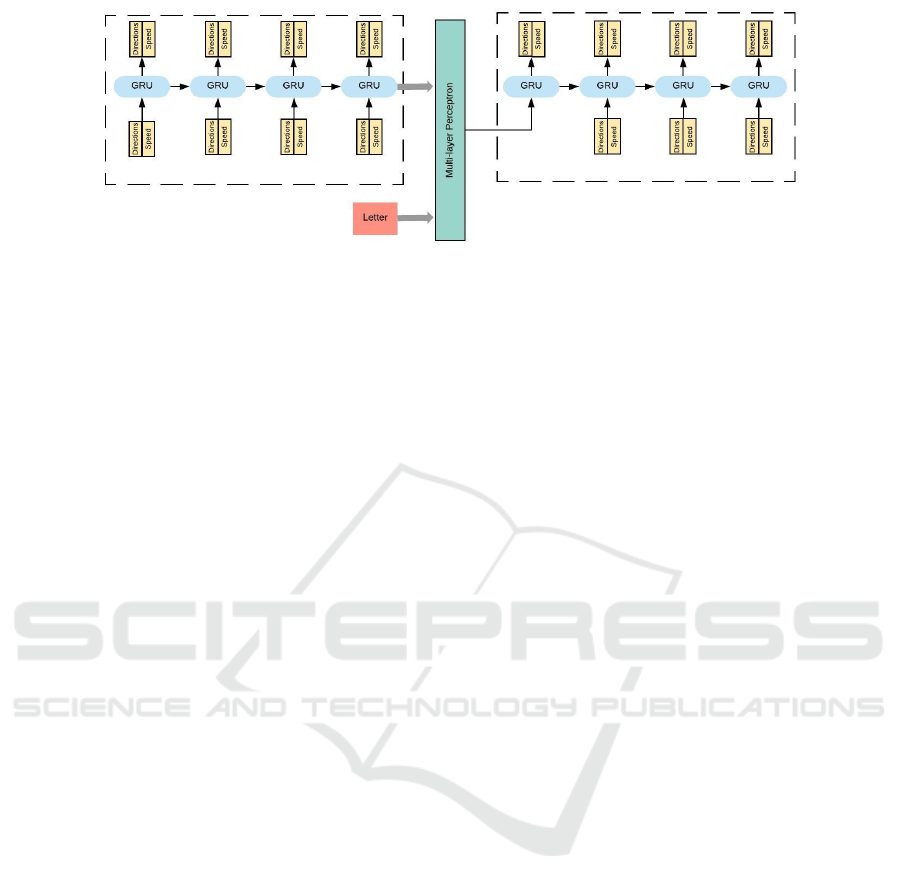
Figure 1: Schematic diagram of the model we used. Both the encoder and the decoder have 2 layers, with size of 128. A
dropout of 0.2 is used for the decoder. Learning rate selected is 0.001. During the training time, the input to the model is
always the ground truth. During the inference time however, the input to the decoder (generator) part at each time step is its
own predication in the previous time step.
3 DATASET
In this study, we use the IRON-OFF Cursive Hand-
writing Dataset (Viard-Gaudin et al., 1999), which
contains isolated handwritten letters. To summarize
this dataset:
• 412 writers who have written isolated letters.
•
10,685 isolated lower case letters, 10,679 isolated
upper case letters, 4,086 isolated digits and 410
euro signs.
•
gender, handiness (left or right handed), age and
nationality of the writers.
•
letter image and timed pen tracings, comprising
continuous X, Y and pen pressure, and also dis-
crete pen state.
We focused on the uppercase letters only, and we
did not use the pen state or the pen pressure. The idea
was to limit the number of possible style factors, so
that we can better study them. 90% of the data is used
for training, and 10% for validation.
One challenging issue with this dataset is that we
have only one example for each writer-letter combina-
tion. This makes the task more difficult, because it is
hard to extract a writer style using very few items (the
26 letters/writer in this case).
We represent each letter tracing by two features:
directions and speed of the pen between each two
consecutive points. Each feature is quantized into 16
levels and represented as a one-hot encoded vector.
Freeman coding (Freeman, 1961) is used to encode
the direction feature.
4 MODEL ARCHITECTURE
The model architecture is shown in figure 1. The trace
of the letter is first fed to the encoder module. The
final hidden state of that module summarizes the letter.
In order to allow this module to focus on learning
the style embedding, we complement this last hidden
state with the one-hot encoding of the letter identity,
and combine them as the input bias of the generator.
Thus, we decouple the task space – the letter – from
the style space: the encoder is freed from the need to
learn the letter identity, and can focus on capturing
additional information that enables the generator to
better approximate the ground truth tracings.
In the decoder, we follow the framework proposed
by (Vinyals et al., 2015) in order to bias the model: we
create an extra time step at the beginning, which has
the information we want to bias the model with. In this
case, this time step is the projection of the encoder last
hidden state and the letter identity. This has a much
lower dimension than encoder hidden state, which
further encourage the model to only learn necessary
style information, as suggested by (Skerry-Ryan et al.,
2018).
4.1 Hyper-parameter Tuning
We ran random hyper-parameter search for a wide
range of parameters (learning rate, size and the num-
ber of layers for the encoder and the decoder, dropout
percentage, etc). GRU layers (Chung et al., 2014) are
used in our work (we did not experiment with other
architectures, like LSTM). We used Adam optimizer
(Kingma and Ba, 2014). In order to allow for faster
exploration of different hyper-parameters, we used the
following early stopping: if no significant improve-
ment is observed after 20 epochs on the validation
data, the training is stopped.
4.2 Training
The encoder and the decoder parts aim at modeling the
Transfer and Extraction of the Style of Handwritten Letters using Deep Learning
679

next time frame in the sequence,
x
t+1
, given
the previous time frames, or in other words,
P(x
t+1
|x
1
,x
2
,...,x
t
)
, where
x
t
is the tracing point at
time
t
. To achieve this, we used teacher forcing: the
model is given with the ground truth input of points
x1,x2,...,x
T −1
and is asked to output the sequence
x2,x3,...,x
T
, where
T
is the length of the input se-
quence
The model is trained to minimize the negative log
likelihood loss of the correct point at each time step.
For each feature (speed and freeman codes), it is cal-
culated as in equation 1. The final loss is the average
loss of the two features, as in equation 2.
Loss = −log
T
∏
t=1
p(x
t
|x
1
,x
2
,...,x
t−1
)
= −
T
∑
t=1
log p(x
t
|x
1
,x
2
,...,x
t−1
)
(1)
TotalLoss = (Loss
speed
+ Loss
f reeman
)/2.0 (2)
During the training, the output of the model at each
time step is :
x
g
t+1
= argmax
x
p(x|x
t
,h
t
) (3)
where
x
g
t+1
is the generated/predicted next time frame
by the model,
x
t
is the ground truth input at the current
time frame
t
, and
h
t
is the hidden state of the GRU
at the current time frame. To sample from the model,
we used the Temperature Sampling strategy from the
Softmax output.
5 EVALUATION METRICS
Evaluation is a challenging problem when using gener-
ative models. We want metrics to capture the distance
between the generated and the ground truth distribu-
tions. Similar to the work done in (Mohammed et al.,
2018), we use the same two evaluation metrics in our
model:
• BLEU score
(Papineni et al., 2002) It is a well-
known metric to evaluate text generation applica-
tions, like image captioning (Vinyals et al., 2015)
and machine translation (Sutskever et al., 2014).
Since we discretized the letter drawings, this nicely
fits to our work. The general intuition is the fol-
lowing: if we take a segment from the generated
letter, did this segment happen in the ground truth
letter? We keep doing this for segments of increas-
ing length (the length of the segment here is the
number of grams used in the BLEU score). For
our work, we report the results on segments from 1
to 3 time steps. Each part of the letter has two par-
allel segments: freeman codes and speed, thus, we
report the BLEU score for both of them. The equa-
tion to compute the BLEU score for each feature
is the following:
BLEU
N
=
∑
C∈G
∑
N∈C
Count
Clipped
(N)
∑
C∈G
∑
N∈C
Count(N)
(4)
Score
N
= min (0, 1 −
L
R
L
G
)
N
∏
n=1
BLEU
n
(5)
where:
G
is all the generated sequences,
N
is
the total number of N-grams we want to consider.
Count
Clipped
is the clipped N-grams count (if the
number of N-grams in the generate sequence is
larger than the reference sequence, the count is
limited to the number in the reference sequence
only),
L
R
is the length of the reference sequence,
L
G
is the length of the generated sequence. The
term
min(0,1 −
L
R
L
G
)
is added in order to penalize
short generated sequences (shorter than the refer-
ence sequence), which would deceptively achieve
high scores.
• End of Sequence (EoS)
The letter length is an-
other aspect of the style. The distribution of
length in the generated examples should follow
the ground truth examples. In order to perform
this analysis, we compute Pearson Correlation
Coefficient between the lengths of the generated
sequences and whose of the ground truth data.
6 EXPERIMENTS AND RESULTS
In these experiments, we compare our model with
the baseline used in (Mohammed et al., 2018). In
that baseline, the model is biased by the letter and
writer identities only. Our model, as explained earlier,
is biased by the letter identity and the style features
extracted from the letter tracings.
6.1 Letter Generation with Style
Preservation
The objective here to compare the quality of the gen-
erated letters to the state-of-the-art benchmarks. As
mentioned earlier, we compare the model’s output us-
ing the BLEU score and the EoS distribution. The
BLEU score results can be seen in table 1, and the
results for EoS analysis results are in table 3. We can
see that the BLEU-3 (i.e., using 3, 2 and segments)
score results of our model achieves
32.3
% accuracy in
speed feature and 38.7% accuracy in freeman feature,
ICAART 2019 - 11th International Conference on Agents and Artificial Intelligence
680
compared to
25.1
% and
28.3
% accuracy using the
benchmark model on both features respectively.
The same goes for the EoS analysis. In compar-
ing the Person Coefficient, our model achieves
0.99
score compared to
0.55
for the benchmark model (the
highest score is 1.0). This is a support that our model
capture the style of handwriting better than the bench-
mark.
Examples for the generated letters can be found in
figure 11.
6.2 Style Transfer across Writers
One of the hypotheses we want to test is whether there
is a limited number of styles that can generalize over
new writers. To achieve this, the learned representation
for styles should extract generic information about the
styles. In order to test this hypothesis, we expose our
model to 30 writers that have not been seen before.
We compare our model’s performance on these writers
with the benchmark model.
The BLEU scores can be seen in table 2. Our
model achieves on BLEU-3 score
32.2
% and
42.1
%
accuracy on the Speed and Freeman code features,
compared to
25.3
% and
27.7
% on the benchmark
model for the same features respectively. The EoS
analysis can be seen in table 4. Our model achieves
a coefficient value of
0.93
, compared to
0.50
for the
benchmark. Thus, the new model clearly outperform
the current benchmarks on the transfer task, on both
BLEU score and EoS analysis.
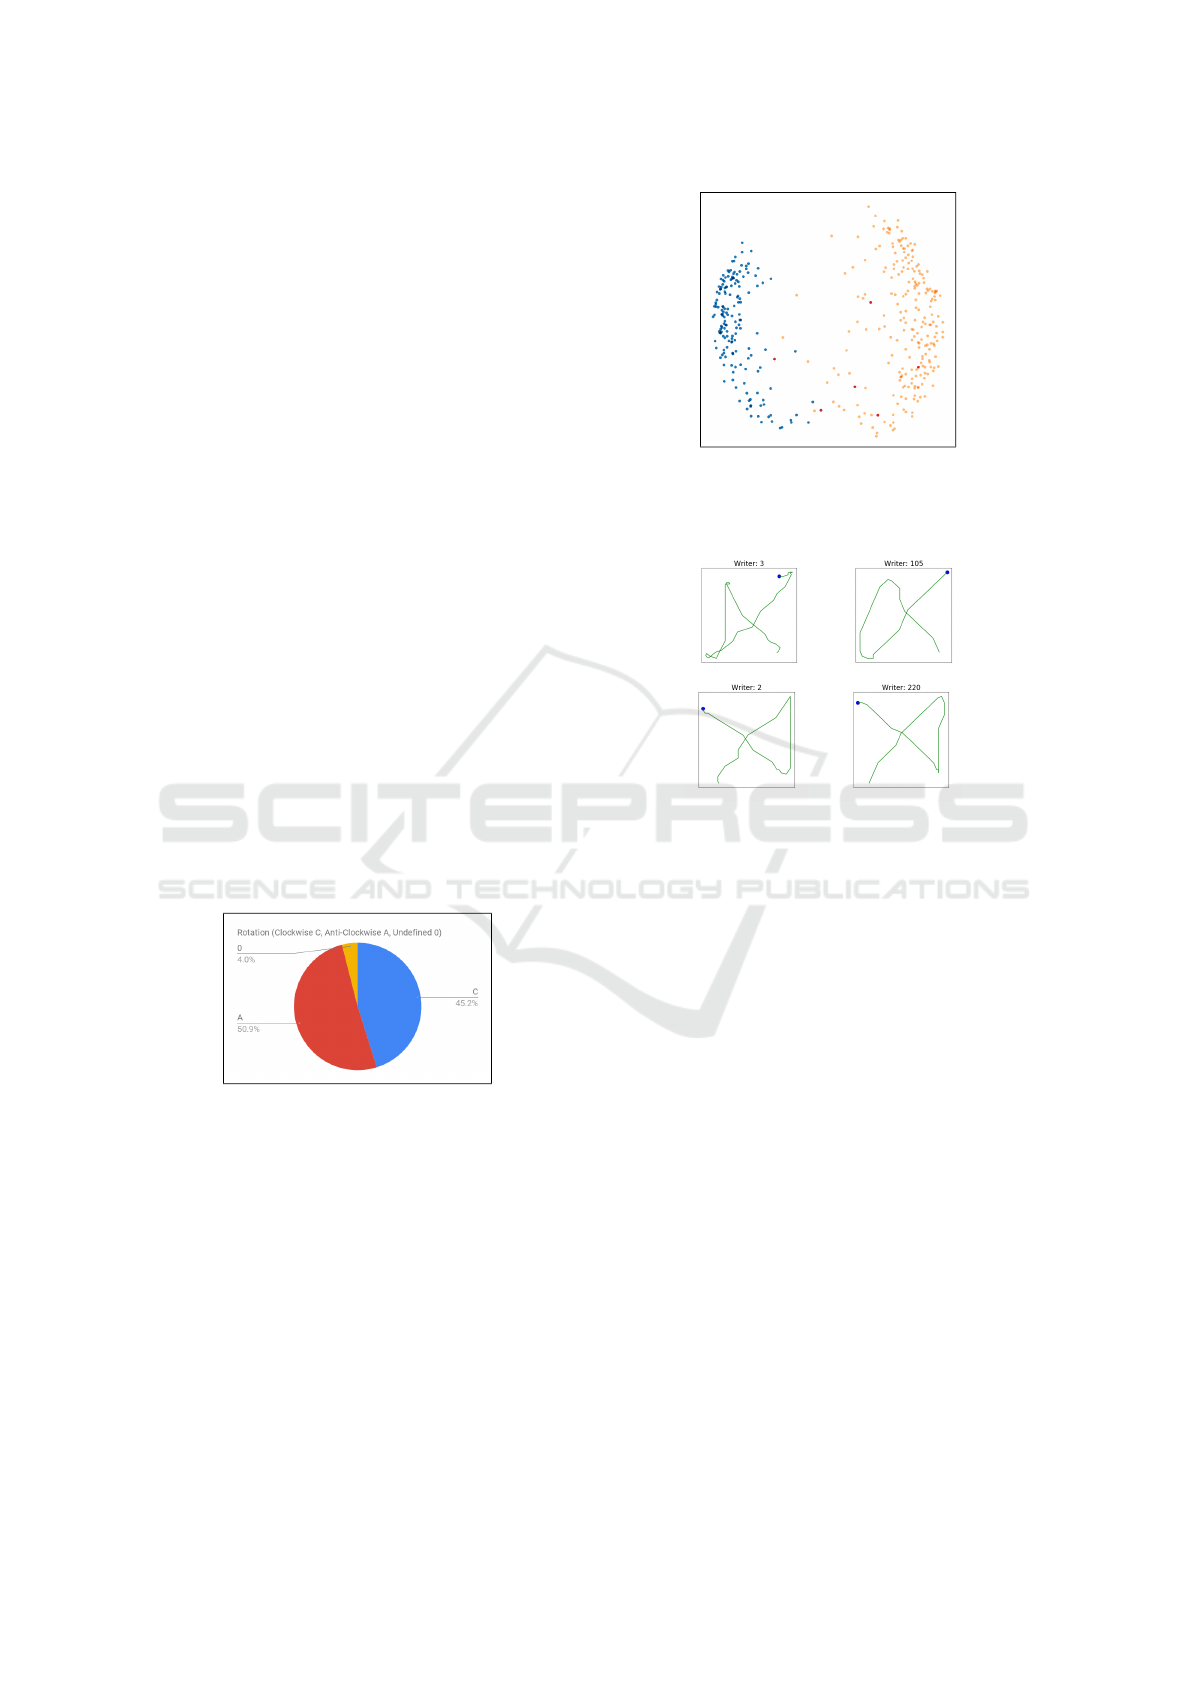
Figure 2: Results of the manual annotation for the rotation
of letter X drawings over the whole dataset. Almost half the
writers draw X clockwise, the other half counterclockwise.
The remaining writers often perform the drawing using two
strokes: one clockwise, the other counterclockwise.
6.3 Styles per Letters
One of the nice consequences of using our model is
that we can have a closer look at the styles. We explore
the latent space for multiple letters, and see that we
can uncover interesting writing styles per letter. A full
scale analysis is beyond the scope of this paper. We
project the latent space using Principal Components
Analysis (PCA) (Jolliffe, 2011) and t-SNE (Maaten
and Hinton, 2008).
Figure 3: Projection for latent space for letter X using PCA.
The colors show the ground truth of the X rotation: blue
is counter clockwise, orange is clockwise, and the few red
points are undefined.
Figure 4: Examples for writing of letter X. Starting point is
marked with the blue mark. Each raw is randomly sampled
from each cluster in the bottleneck. The clusters shows
that almost half the writers draw the letter clockwise (first
row, first cluster), and the other half draw it anti-clockwise
(second row, second cluster).
Firstly, we take a look at letter X. Beforehand, we
identified a style feature in letter X: some writers draw
X clockwise while others draw it anti-clockwise. We
manually annotated the whole dataset for this feature;
the result can be seen in figure 2. Almost half of the
writers draw the letter X clockwise, and the other half
draw it anti-clockwise. If our assumption is correct,
our model should be able to capture this feature. We
project the latent of the model using PCA on all the
letter X, which can be seen in figure 3. The model
latent space clusters almost perfectly the two rotation
sets. Examples for letters from both clusters are in
figure 4.
Encouraged by the results on letter X, we explored
more letters. For letter C, we can see the latent space
project in figure 5. It can be seen that there are at least
two main clusters. Examples from the cluster circled
by a red ellipse are in figure 6, first row. It features the
Edwardian handwriting style. The rest of the writers
(in the big cluster) have a very similar style (this is
expected, since the drawing of the letter C is quite
simple).
Transfer and Extraction of the Style of Handwritten Letters using Deep Learning
681
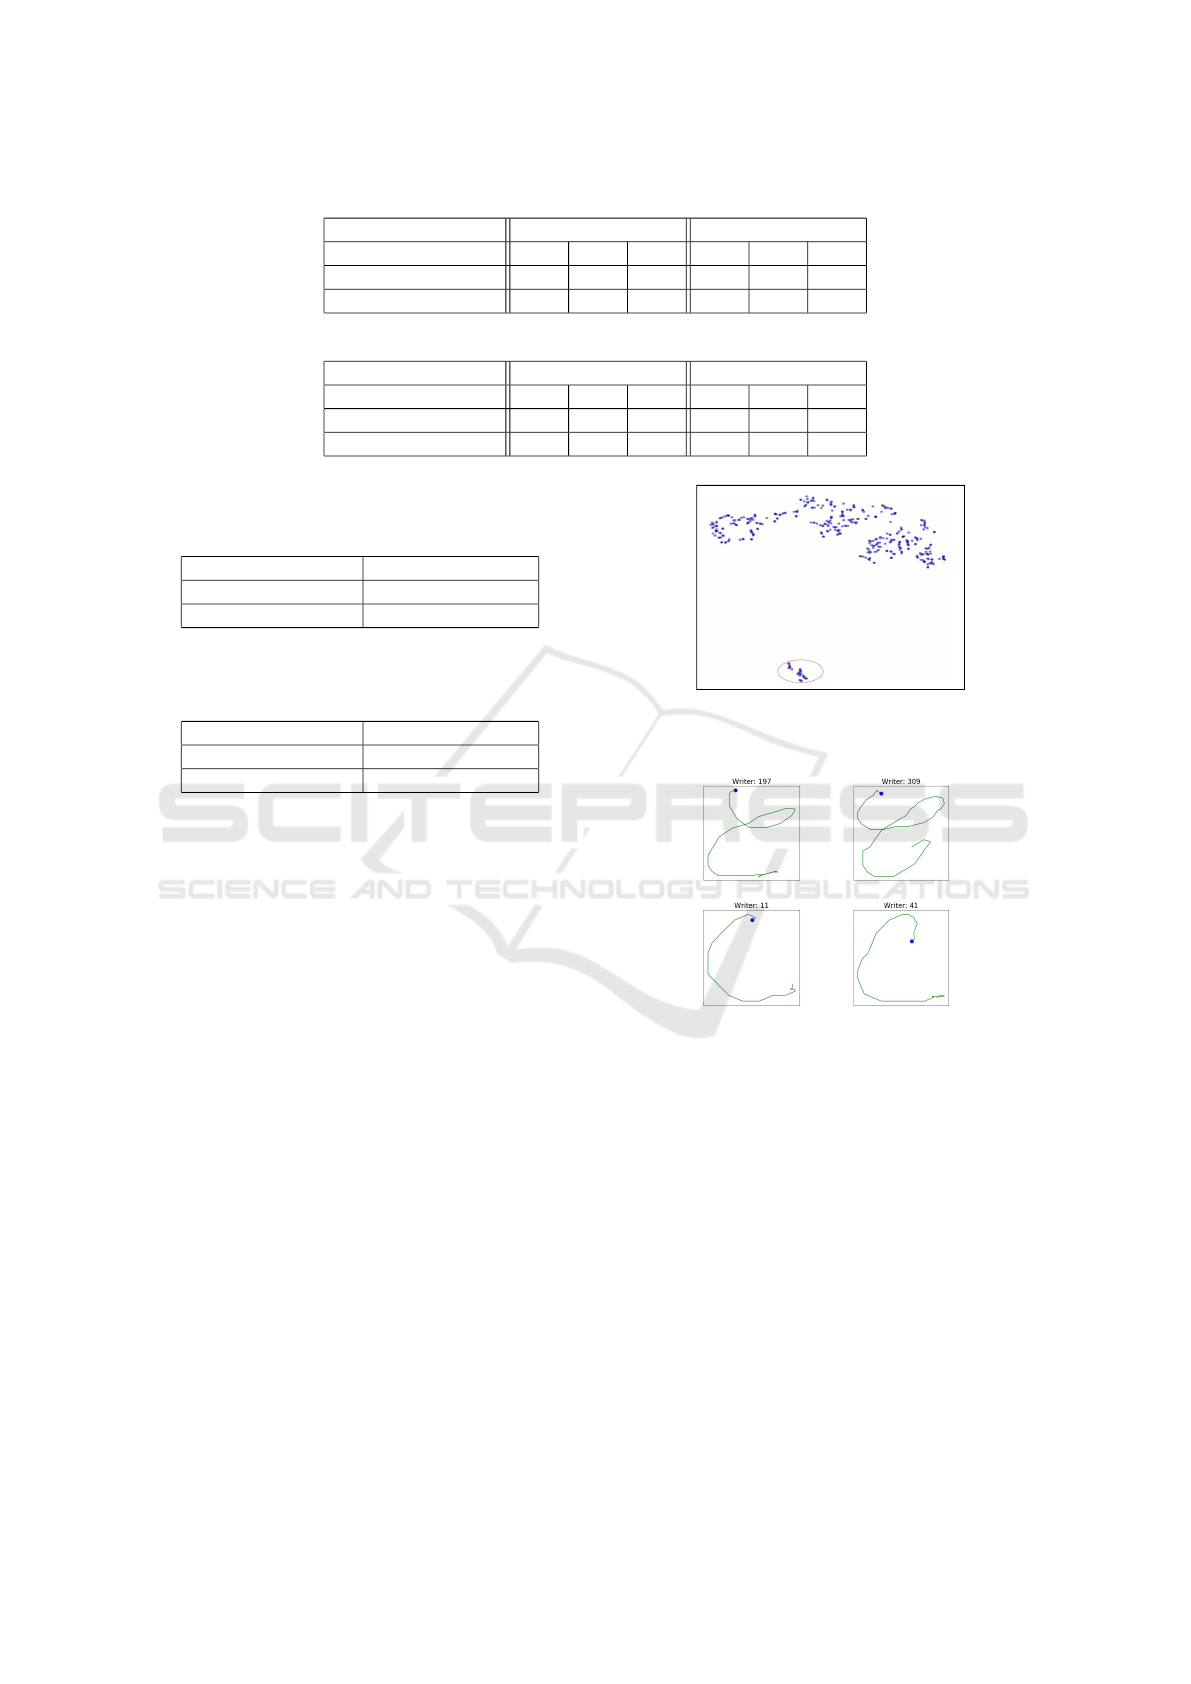
Table 1: BLEU scores for different models for known writers.
Aspect/Feature Speed Freeman
Model / B-score B-1 B-2 B-3 B-1 B-2 B-3
Letter + Writer bias 51.5 41.4 25.1 56.7 39.4 28.3
Style Extractor 71.0 51.7 32.3 65.6 51.5 38.7
Table 2: BLEU scores for different models for style extraction for 30 new writers (style transfer).
Aspect/Feature Speed Freeman
Model / B-score B-1 B-2 B-3 B-1 B-2 B-3
Letter + Writer bias 55.4 39.6 25.3 50.2 38.6 27.7
Style Extractor 72.4 52.4 32.2 70.4 55.6 42.1
Table 3: Pearson correlation coefficients for the End-Of-
Sequence (EoS) distributions for the different models on the
normal generation scenario.
Models Pearson coefficient
Letter + Writer bias 0.55
Style Extractor 0.99
Table 4: Pearson correlation coefficients for the End-Of-
Sequence (EoS) distributions for the different models on 30
new writers (style transfer).
Models Pearson coefficient
Letter + Writer bias 0.50
Style Extractor 0.93
For letter A, our model latent space create two
main clusters, figure 7. We give examples from those
two groups in figure 8, where we can see clear dif-
ferences in the styles. Some people start drawing the
letter from down-left whole others start from the top-
left, move down and then continue the letter drawing
as previously. This is similar to results reported in
(Sraphin Thibon et al., ress), which analyzed the hand-
writing of uppercase letters.
Another example is for letter S bottleneck, figure
9. There are three resulting clusters which we inves-
tigated. The cluster circled in red is clearly different
from the other two clusters (not indicated). Examples
can be seen in figure 10. This cluster is again for
writers with Edwardian handwriting style. We did not
find a clear difference between the other two clusters
though, but this is an expected outcome of using t-SNE
(since it does not have the clear objective of clustering
styles).
7 CONCLUSIONS AND FUTURE
WORK
In this paper, we explored handwriting styles, using a
deep neural network paradigm. We have approached
the problem systematically. First, we compared our
Figure 5: Projection for latent space for letter C using t-
SNE. The cluster surrounded by the red circle has a clear
interpretation, where writers have a cursive style.
Figure 6: Examples for writing of letter C from the selected
cluster (first row) versus the rest of the letter drawings (sec-
ond row). Starting point is marked with the blue mark. The
drawings from the selected cluster show people with Edwar-
dian style of handwriting.
generation results to the benchmark reported in the
state-of-the-art on this problem, and we show that
our model outperforms the benchmark. Second, we
explore the ability to perform style transfer, by test-
ing the model’s performance on 30 new writers. We
hypothesize that there is a limited number of style com-
ponents that describe handwriting, and a good style
extraction model should generalize well to new writ-
ers. Last, we analyze the latent space of our model for
multiple letters, and show that the model separate the
different styles in different clusters. We are interested
in further investigating the concept of style transfer.
In this work, we fixed the task (the uppercase letters),
ICAART 2019 - 11th International Conference on Agents and Artificial Intelligence
682
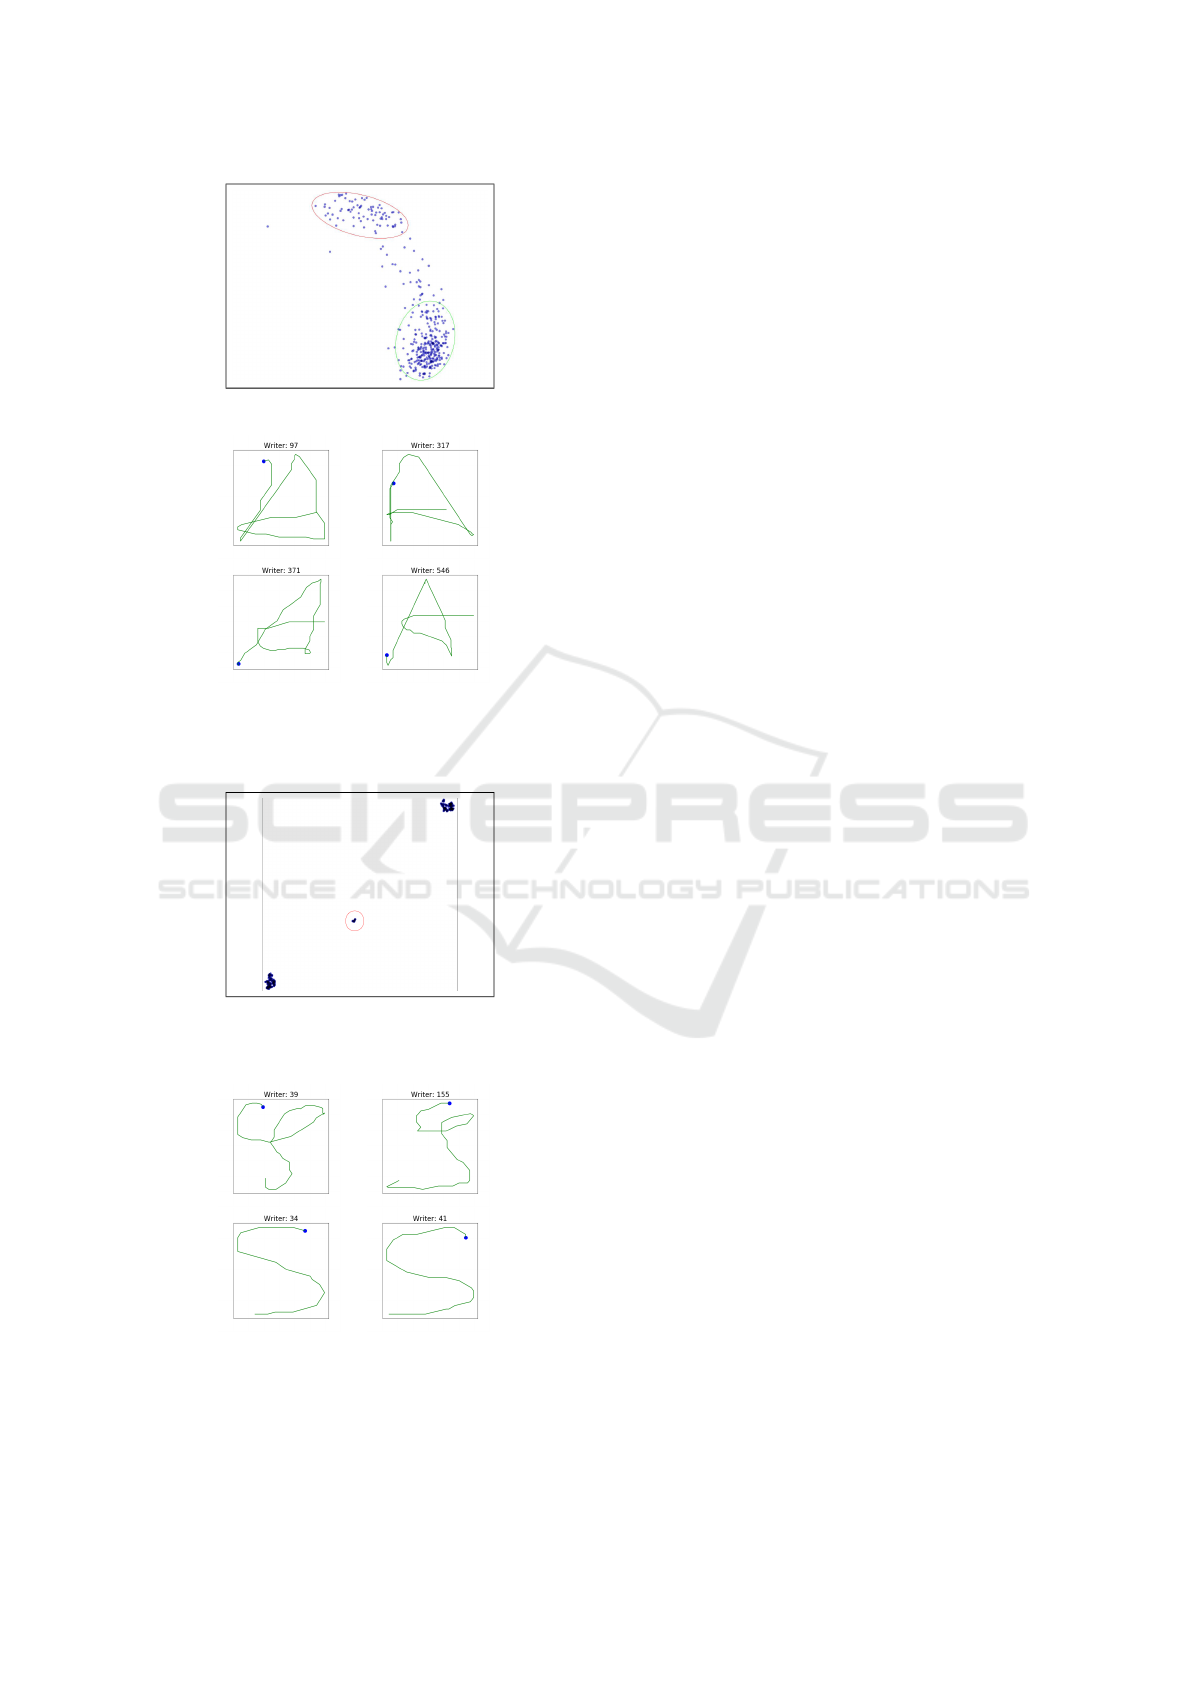
Figure 7: Projection for latent space for letter A using PCA.
Figure 8: Examples for writing of letter A from the selected
clusters. Starting point is marked with the blue mark. Each
row is from one cluster. The first row show people who
start drawing the letter from the top, going down, and then
continue the drawing of the letter. The second row show
people who start drawing from down directly.
Figure 9: Same as figure 5 but for letter S. We identify the
circled cluster as the Edwardian style. The other two clusters
(not indicated) did not show clear differences.
Figure 10: Examples for writing of letter S from the selected
cluster (first row) versus the other two clusters (second row).
Starting point is marked with the blue mark. The drawings
from the selected cluster is always Edwardian style.
and performed transfer of style across writers. Our
plan is to investigate style transfer while changing the
task (e.g., learn style on uppercase letters, and transfer
them to the lowercase writers).
Based on the results of the latent space analysis, it
is interesting to investigate a latent space structure and
objective function that can disentangle the style man-
ifold. So far, we used multiple projection techniques
in order to explore the style information in the latent
space. The objective in this case is to encourage the
styles to emerge on its own in the latent space.
ACKNOWLEDGEMENTS
This work is supported by PERSYVAL (ANR-11-
LABX-0025) via the project-action RHUM.
REFERENCES
Bishop, C. M. (1994). Mixture density networks. Aston
University.
Briot, J.-P. and Pachet, F. (2017). Music generation by
deep learning-challenges and directions. arXiv preprint
arXiv:1712.04371.
Chang, B., Zhang, Q., Pan, S., and Meng, L. (2018). Gen-
erating handwritten chinese characters using cyclegan.
CoRR, abs/1801.08624.
Chung, J., Gulcehre, C., Cho, K., and Bengio, Y. (2014). Em-
pirical evaluation of gated recurrent neural networks on
sequence modeling. arXiv preprint arXiv:1412.3555.
Freeman, H. (1961). On the encoding of arbitrary geomet-
ric configurations. IRE Transactions on Electronic
Computers, 2:260–268.
Goodfellow, I., Bengio, Y., and Courville, A. (2016).
Deep Learning. MIT Press.
http://www.
deeplearningbook.org.
Goodfellow, I., Pouget-Abadie, J., Mirza, M., Xu, B., Warde-
Farley, D., Ozair, S., Courville, A., and Bengio, Y.
(2014). Generative adversarial nets. In Advances in
neural information processing systems, pages 2672–
2680.
Google (2017). The quick, draw! dataset.
Ha, D. and Eck, D. (2017). A neural representation of sketch
drawings. CoRR, abs/1704.03477.
Hochreiter, S. and Schmidhuber, J. (1997). Long short-term
memory. Neural computation, 9(8):1735–1780.
Jolliffe, I. (2011). Principal component analysis. In In-
ternational encyclopedia of statistical science, pages
1094–1096. Springer.
Kingma, D. P. and Ba, J. (2014). Adam: A
method for stochastic optimization. arXiv preprint
arXiv:1412.6980.
Kingma, D. P. and Welling, M. (2013). Auto-encoding
variational bayes. arXiv preprint arXiv:1312.6114.
Transfer and Extraction of the Style of Handwritten Letters using Deep Learning
683
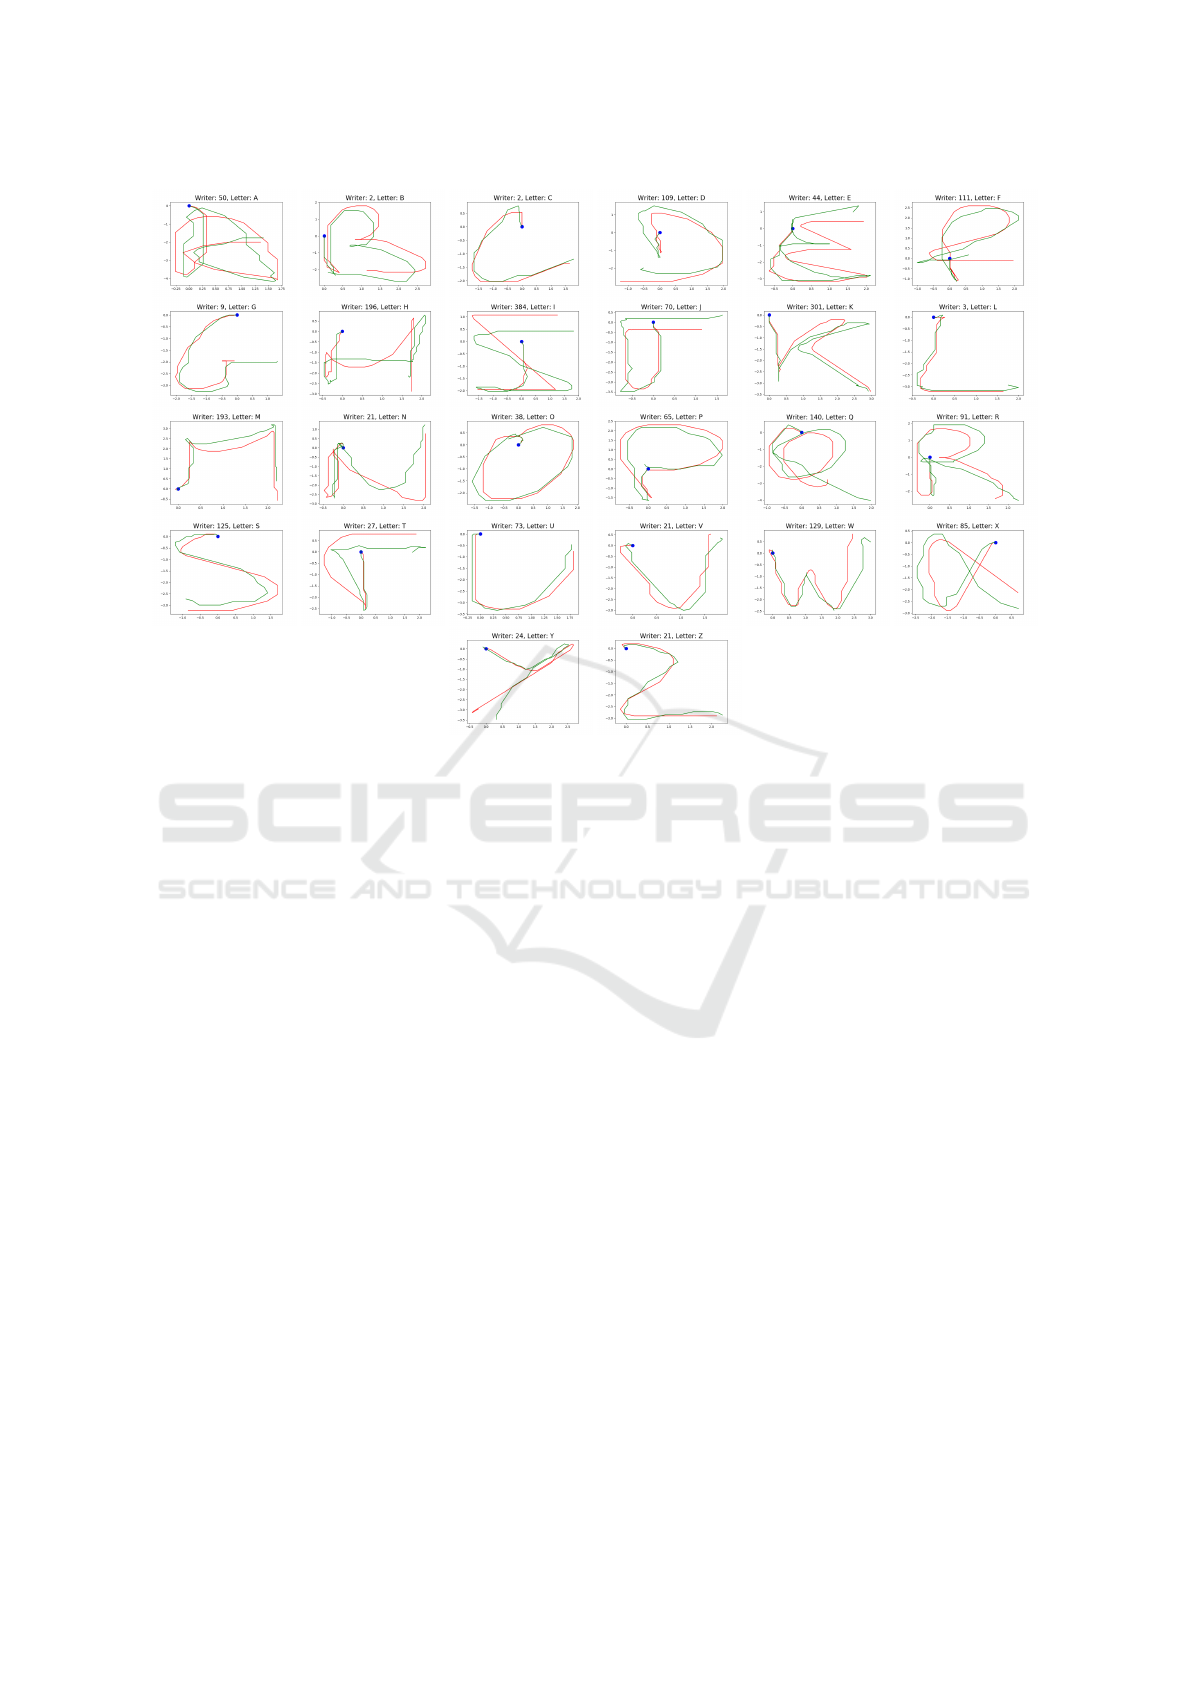
Figure 11: Examples of generated letters. The blue mark is the starting point. The traces in green is the ground truth, and the
red is the generated ones by our model.
Maaten, L. v. d. and Hinton, G. (2008). Visualizing data
using t-sne. Journal of machine learning research,
9(Nov):2579–2605.
Mohammed, O., Bailly, G., and Pellier, D. (2018). Handwrit-
ing styles: benchmarks and evaluation metrics. In Fifth
International Conference on Social Networks Analysis,
Management and Security (SNAMS), Valencia, Spain.
IEEE.
Oord, A. v. d., Dieleman, S., Zen, H., Simonyan, K., Vinyals,
O., Graves, A., Kalchbrenner, N., Senior, A., and
Kavukcuoglu, K. (2016). Wavenet: A generative model
for raw audio. arXiv preprint arXiv:1609.03499.
Papineni, K., Roukos, S., Ward, T., and Zhu, W.-J. (2002).
Bleu: a method for automatic evaluation of machine
translation. In Proceedings of the 40th annual meeting
on association for computational linguistics, pages
311–318. Association for Computational Linguistics.
Skerry-Ryan, R. J., Battenberg, E., Xiao, Y., Wang, Y., Stan-
ton, D., Shor, J., Weiss, R. J., Clark, R., and Saurous,
R. A. (2018). Towards end-to-end prosody transfer
for expressive speech synthesis with tacotron. CoRR,
abs/1803.09047.
Sraphin Thibon, L., Gerber, S., and Kandel, S. (in-press).
Analyzing variability in upper-case letter production in
adults. C. Perret and T. Olive (eds.). Studies in Writing.
NL: Brill Editions.
Sutskever, I., Vinyals, O., and Le, Q. V. (2014). Sequence to
sequence learning with neural networks. In Proceed-
ings of the 27th International Conference on Neural
Information Processing Systems - Volume 2, NIPS’14,
pages 3104–3112, Cambridge, MA, USA. MIT Press.
Viard-Gaudin, C., Lallican, P. M., Knerr, S., and Binter,
P. (1999). The ireste on/off (ironoff) dual handwrit-
ing database. In Document Analysis and Recognition,
1999. ICDAR ’99. Proceedings of the Fifth Interna-
tional Conference on, pages 455–458.
Vinyals, O., Toshev, A., Bengio, S., and Erhan, D. (2015).
Show and tell: A neural image caption generator. In
Computer Vision and Pattern Recognition (CVPR),
2015 IEEE Conference on, pages 3156–3164. IEEE.
ICAART 2019 - 11th International Conference on Agents and Artificial Intelligence
684
