
Reading Circular Analogue Gauges using Digital Image Processing
Jakob S. Lauridsen
1
, Julius A. G. Grassmé
1
, Malte Pedersen
1
, David Getreuer Jensen
2
,
Søren Holm Andersen
2
and Thomas B. Moeslund
1
1
Section of Media Technology, Aalborg University, Denmark
2
EnviDan, Aalborg, Denmark
Keywords:
Computer Vision, Circular Analogue Gauge, Gauge Reading Principal Component Analysis, Expectation
Maximization, Digital Time Series, Parametric Object Classification.
Abstract:
This paper presents an image processing based pipeline for automated recognition and translation of pointer
movement in analogue circular gauges. The proposed method processes an input video frame-wise in a mo-
dule based manner. Noise is minimized in each image using a bilateral filter before a Gaussian mean adaptive
threshold is applied to segment objects. Subsequently, the objects are described by a set of proposed features
and classified using probability distributions estimated using Expectation Maximization. The pointer is clas-
sified by the Mahalanobis distance and the angle of the pointer is determined using PCA. The output is a low
pass filtered digital time series based on the temporal estimations of the pointer angle. Seven test videos have
been processed by the algorithm showing promising results. Both source code and video data are publicly
available.
1 INTRODUCTION
Analogue pointer-type dials are widely applied in
both industrial and personal products where informa-
tion such as pressure or speed is displayed. This in-
cludes old waste water pumping stations, which can
have analogue pressure gauges mounted on the pump
as the main instrument to inspect the condition of the
system. Typically a field operator is responsible for
reading and recording the data from the gauge to eva-
luate the performance of the pump. This is a time
consuming and expensive process and it is prone to
human errors. An alternative to the manual readings
is to record a video of the gauge and analyze the pres-
sure variations using computer vision techniques.
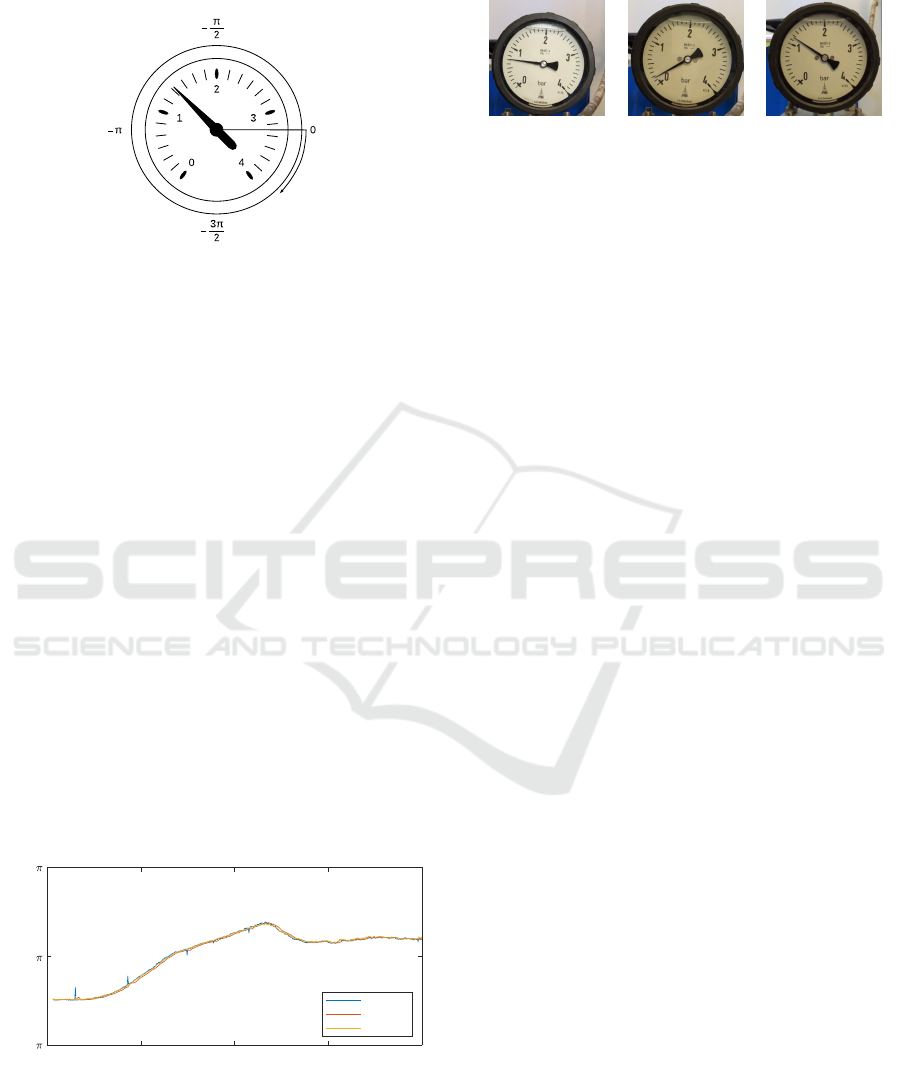
Figure 1: Illustration of a circular pressure gauge with high-
lighted features and their respective terms.
This paper presents such an approach, that auto-
matically recognizes key parts of analogue circular
gauges and identifies the transient behaviour of the
pointer over the course of the video in order to cre-
ate a digital time series. The terminology that will be
used throughout the paper when describing gauges is
presented in Figure 1.
2 RELATED WORK
One of the early attempts to describe and break down
the problem of digitizing analogue dials was presen-
ted by Sablatnig et al., who proposed a design stra-
tegy for automatically reading dials of various shapes
using pattern recognition techniques (Sablatnig and
Kropatsch, 1994). Some years later Alegria et al. de-
veloped a calibration system capable of reading di-
als using thresholding, image thinning and the Hough
line transform. However, this system was only able
to read dials where the pointer moves in a half circle
(Alegria and Serra, 2000). The Hough line transform
and its variations have since been a popular method
for reading the pointer’s angle yielding feasible re-
sults (Ye et al., 2013) (Jiannan Chi, 2015) (Jiale et al.,
2011). Others have used least squares as an alterna-
tive yielding more accurate results in general (Yang
Lauridsen, J., Grassmé, J., Pedersen, M., Jensen, D., Andersen, S. and Moeslund, T.
Reading Circular Analogue Gauges using Digital Image Processing.
DOI: 10.5220/0007386003730382
In Proceedings of the 14th International Joint Conference on Computer Vision, Imaging and Computer Graphics Theory and Applications (VISIGRAPP 2019), pages 373-382
ISBN: 978-989-758-354-4
Copyright
c
2019 by SCITEPRESS – Science and Technology Publications, Lda. All rights reserved
373
et al., 2014) (Wang et al., 2013).
M. Gellaboina uses a rotation of segmented ob-
jects and unwinding of the dial to read round pres-
sure gauges (Gellaboina et al., 2013). The unwin-
ding technique is also used by Zheng et al., who furt-
hermore made the system more robust using colour
correction and perspective transforms (Zheng et al.,
2016). Yi et al. provide an algorithm robust to ax-
ial noise changes by not assuming a perfect circular
shape, finding the scale marks with the K-means clus-
tering algorithm (Yi et al., 2017).
The aforementioned contributions exclude the as-
sociation of unit related text on the dial to the scale
as a part of the automation. Sun et al. include this in
their contribution by recognizing the numbers in the
dial and associating these to the dial scale (Sun et al.,
2014).
A consistent flaw within the field is the lack of
public data, as it has not been possible to locate the
source code, videos, images or other relevant mate-
rial from any of the state-of-the-art methods. Furt-
hermore, several articles lack detailed descriptions of
critical parts of the implementations, leading to a se-
rious inadequacy within the field, as it is not possible
to make accurate comparisons and benchmark tests.
3 CONTRIBUTION
Based on the shortcomings of the current state-of-the-
art methods, the following contributions will be pre-
sented in the paper:
• Presentation of a new state-of-the-art method ba-
sed on parametric classification of the pointer and
scale marks.
• Application example: obtaining a digital time se-
ries based on a recording of an analogue pressure
gauge.
• Source code and video data are published for ben-
chmarking.
4 APPROACH
We propose a system that takes a video of a circular
analogue gauge as input and translates the signal into
a digital time series.
The overall structure of the module based system
is illustrated in Figure 2 and every part will be descri-
bed in the following sections. It should be noted that
there has not been implemented a module for classi-
fying the dial numbers as there exist excellent open
source solutions capable of handling this.
Preproccesing and
segmentation
Circle fitting
Scale mark and pointer
recognition
Pointer angle
estimation
Time series
Figure 2: Algorithmic structure of automatic pressure rea-
ding system.
4.1 Preprocessing and Segmentation
The need to separate and segment objects with mini-
mal error is a traditional image processing problem.
In the given case, the problem can be boiled down to
handling minor variations in light, contrast, and blur
assuming that the camera is kept relatively steady in
front of a well-lit gauge.
This problem has previously been handled using
local contrast normalization (Gellaboina et al., 2013),
multi-scale retinex to reduce the influence of different
brightness levels (Zheng et al., 2016), and a laplacian
filter to enhance the sharpness of the image (Selvathai
et al., 2017).
Our approach to handling irregularities and vari-
ations in the input images is to use a bilateral filter
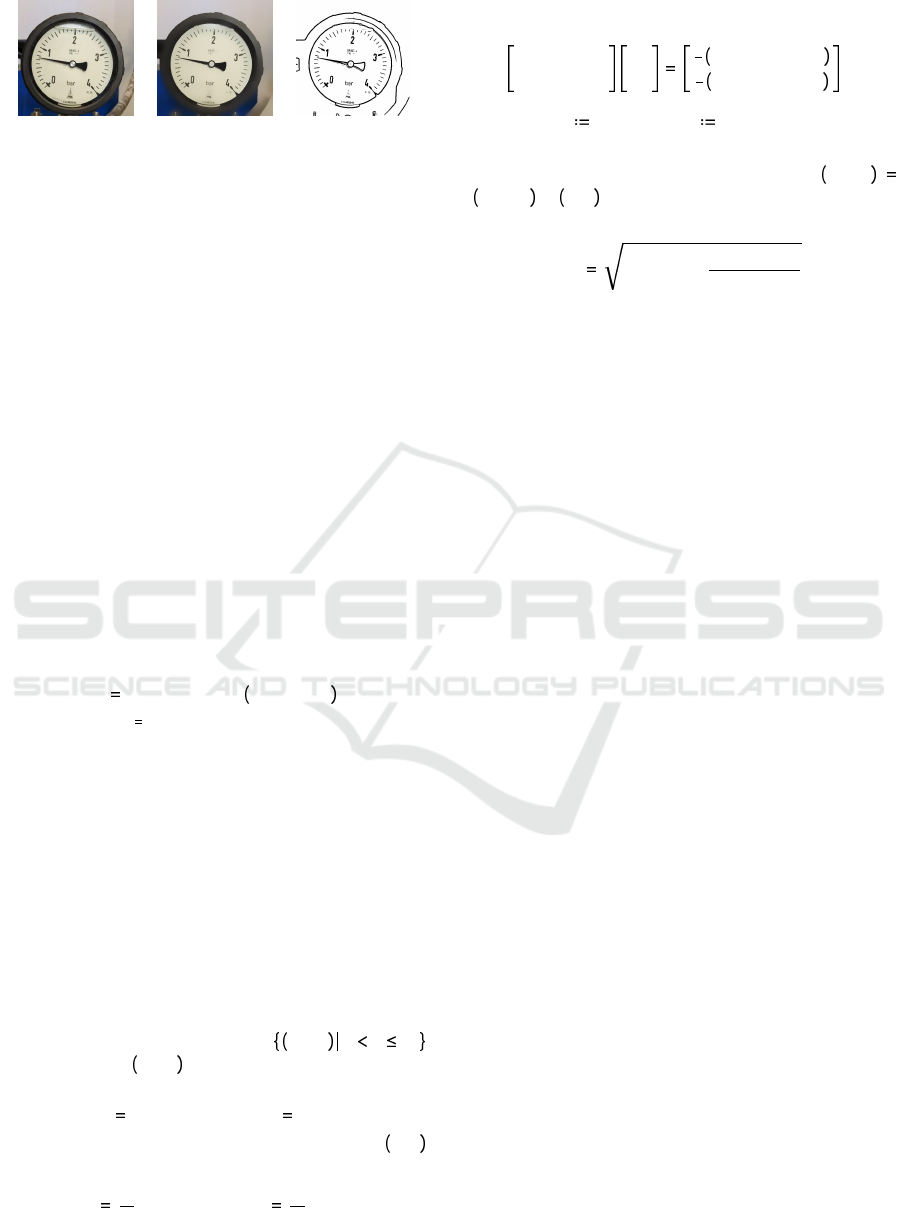
followed by an adaptive threshold. An example of an
input image of a standard pressure gauge can be seen
in Figure 3 (a).
The output of running a bilateral filter on an image
of a gauge can be seen in Figure 3 (b). The bilateral
filter minimizes noise such as glass transition irregu-
larities and trapped air pockets, which are common in
pressure gauges.
A Gaussian mean adaptive threshold is used to bi-
narize the filtered image as it is robust against variati-
ons in lighting conditions. The thresholded image can
be seen in Figure 3 (c).
After the image has been binarized it is processed
by the grassfire algorithm in order to label the objects.
VISAPP 2019 - 14th International Conference on Computer Vision Theory and Applications
374
(a) (b) (c)
Figure 3: (a) The input image of a standard pressure gauge.
(b) The bilateral filtered image. (c) The filtered image after
being thresholded.
4.2 Circle Fitting
One of the most common methods to locate the gauge
bezel is to use the Hough circle transform. However,
this method has been found to perform poorly on gau-
ges with chromed bezels, as they are highly reflective,
which make the segmentation difficult and may result
in only a part of the bezel being binarized. Therefore,
a more error tolerant method inspired by (Gellaboina
et al., 2013) is used as it has been found to provide
more stable results on segmented circles.
4.2.1 The Circle Fitting Algorithm
In order to determine whether a given object in the
binarized image is circular, the center is first determi-
ned by finding the centroid of the object via the image
Moment of the object contours. Then an overlap va-
lue, V , is introduced as
V
36
n 0
C AND rot C
r
, 10 − n (1)
where C is the original object and C
r
is a copy of the
object, which is rotated 360 degrees around the center
of C in steps of 10 degrees.
It is assumed that the gauge bezel object is always
circular and among the largest objects, which means
that it will stand out by accumulating the highest va-
lue V .
After having identified the most likely gauge bezel
object, it is necessary to identify the circle described
by this object as this information is crucial for recog-
nizing the scale marks and the pointer. This is done by
fitting a circle to the object using least squares circle
fitting (Crawford, 1983).
Given a set of N input points x
i
, y
i
0 i N
each coordinate x
i
, y
i
is translated into another coor-
dinate set (α
i
, β
i
) by
α
i
x
i
◦ ¯x β
i
y
i
◦ ¯y (2)
where the sample mean of the set of coordinates ¯x, ¯y
is given by
¯x
1
N
i
x
i
¯y
1
N
i
y
i
(3)
The least square center (α
c
, β
c
) is found by solving
the system
M
αα
M
αβ
M
αβ
M
ββ
α
c
β
c
1
2
M
ααα
≡ M
αββ
1
2
M
βββ
≡ M
ααβ
(4)
where M
αα
i
α
2
i
, M
αβ
i
α
i
β
i
and so forth.
The center point can then be transformed back into
the original coordinate system by letting x
c
, y
c
α
c
, β
c
≡ ¯x, ¯y and the circle radius can be determi-
ned by
R α
2
c
≡ β
2
c
≡
M
αα
≡ M
ββ
N
(5)
With the gauge circle detected, characteristics of ob-
jects inside of the circle can now be determined.
4.3 Recognition of Scale Marks and
Pointer
The idea of recognizing parts in the gauge dial origi-
nates from (Yi et al., 2017), who recognizes the scale
marks on the dial using features of binary objects and
the clustering technique K-means. This idea can be
expanded by using parametric distributions to recog-
nize both the scale marks and the pointer.
To describe the objects in the dial, five features
are proposed, which will be outlined in this section
along with sample distribution graphs that illustrate
their capabilities to separate the objects.
The rotated bounding box ratio is a feature me-
ant to capture the oblongness of an object. Each ob-
ject is rotated to be aligned with the horizontal axis
before the bounding box ratio is calculated.
The mass of an object is simply the number of
pixels it contains. To make sure that the mass does
not reach unnecessarily large values, it is transformed
with the natural logarithm.
The compactness is the mass related to the area
of the bounding box.
The distance to gauge center is the Euclidean
distance between the object’s bounding box center
and the center point of the gauge bezel. To ensure
that values are independent to the gauge size in the
frame, the distance is normalized by the gauge radius.
The orientation inaccuracy is given by the Euc-
lidean distance of the orthogonal vector between the
orientation vector of a given object and the gauge cen-
ter. The eigenvector of the largest eigenvalue found
using PCA defines the orientation vector. The dis-
tance is normalized by the gauge radius.
By describing objects according to these simple
features it becomes possible to differentiate between
them. As illustrated in Figure 4, the pairwise combi-
nations of the proposed features reveal structures that
Reading Circular Analogue Gauges using Digital Image Processing
375
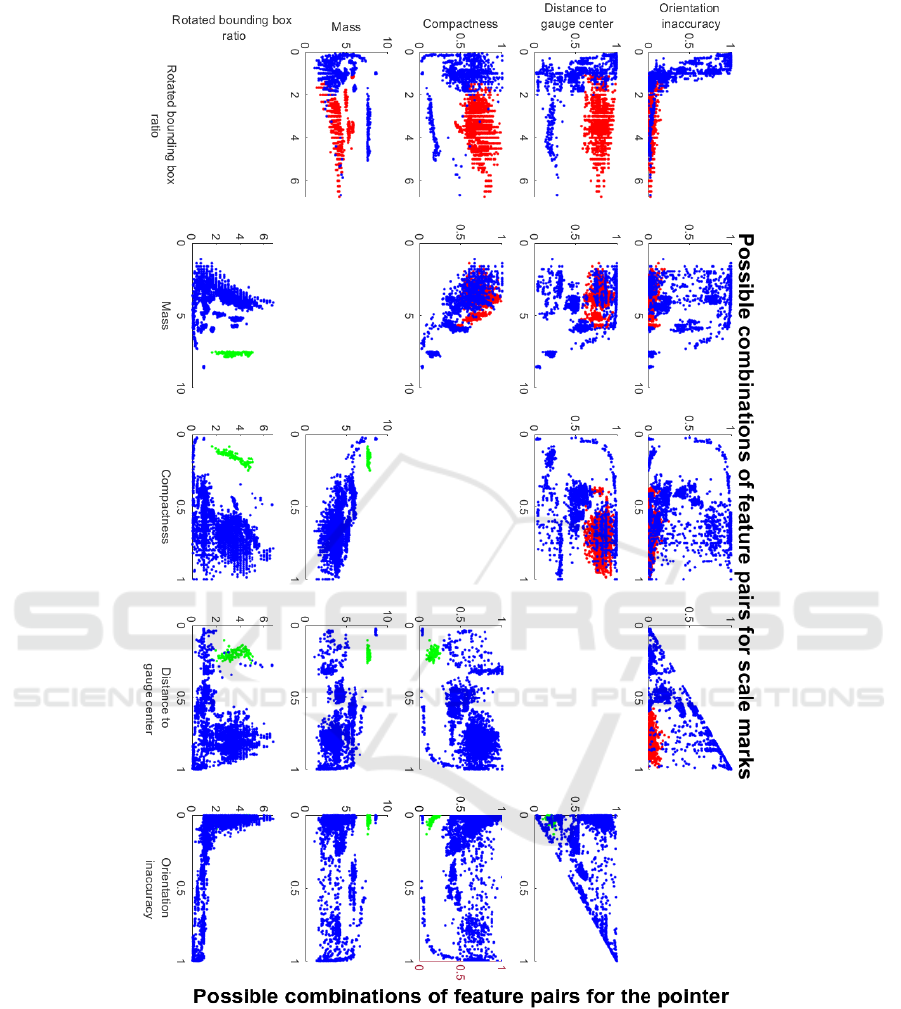
Figure 4: Graphs showing all the feature-pairs and their ability to separate objects. The graphs on the left and right side of the
empty diagonal shows the same feature-pairs but with a different focus. On the left, the red dots illustrate the scale marks and
the blue dots represent noise, which include the pointer objects. On the right, the green dots illustrate the pointer object and
the blue is noise, which include the scale marks.
are capable of separating the objects. All the graphs
are based on manually classified objects in 49 images
from each of three training videos of pressure gauges
that are presented later.
One example is the feature space spanned by mass
and distance to gauge center, which clearly separa-
tes the pointer object from everything else. Another
example is the distance to gauge center and rotated
bounding box ratio, which separates scale marks and
noise.
The samples give rise to the assumption that ob-
jects in the dial can be classified using multivariate
VISAPP 2019 - 14th International Conference on Computer Vision Theory and Applications
376
Gaussian distributions. In most of the presented ex-
amples a single Gaussian distribution should be ade-
quate to describe the relevant object, whereas two dis-
tributions seem to be needed in order to cover the
noise.
The Gaussian multivariate distributions are descri-
bed by a mean vector, µ
k
, and covariance matrix Σ
k
,
where the subscript, k, denotes the given distribution.
A mixing coefficient α
k
is introduced to ensure that
the probability density function integrates to 1 (Bis-
hop and Nasrabadi, 2007). An object can then be des-
cribed by its feature vector, x, and the likelihood of
that object belonging to a class, i, can be expressed
by
L i x
k i
α
k
N x µ
k
, Σ
k
(6)
Parameters are fitted using unlabelled samples from
the training videos, which are described later, and the
unsupervised learning technique Expectation Maxi-
mization (EM). The algorithm is run until conver-
gence using initial mean vectors, and diagonal cova-
riance matrices based on the manually classified ob-
jects. Two feature-pairs are found to be able to dis-
tinguish scale marks, the pointer and noise from each
other.
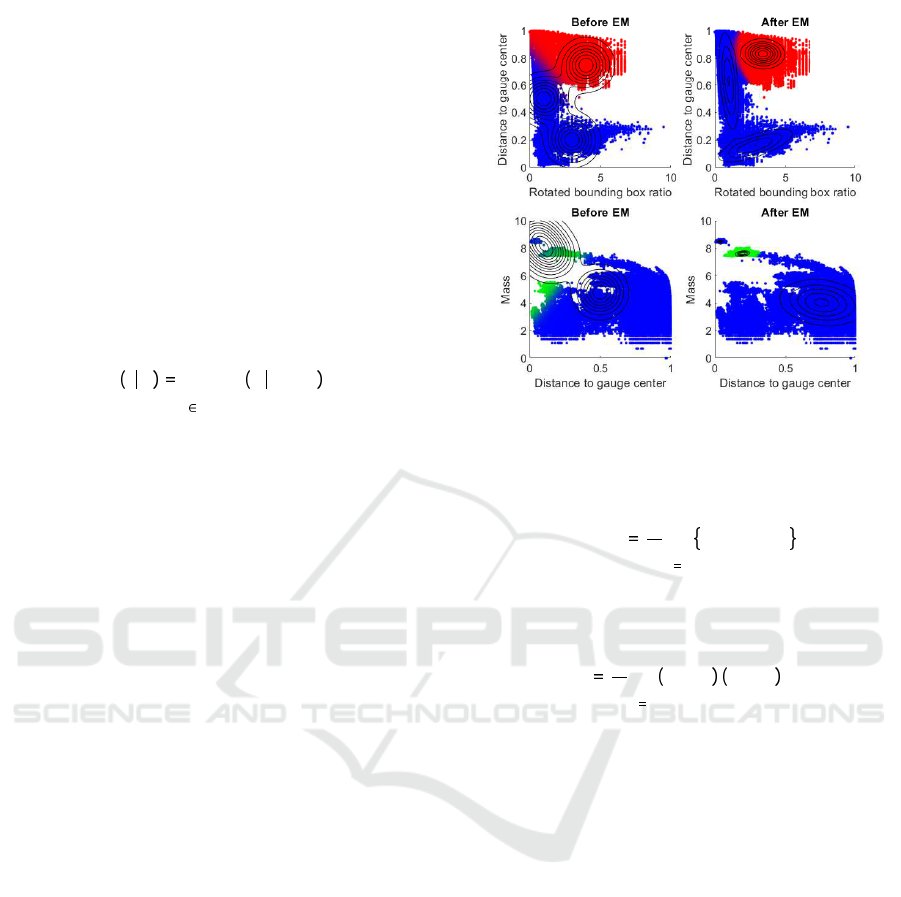
The feature-pair consisting of the distance to
gauge center and rotated bounding box ratio is used
to classify scale marks. A visualization of the distri-
butions before and after EM can be seen in Figure 5.
The classification of new objects is based on the like-
lihood of the objects belonging to a given class.
The mass and distance to gauge center is used to
classify the pointer object and a presentation of the
distribution before and after EM is shown in Figure 5.
When classifying the pointer, only one object needs
to be found. Hence all objects are sorted by their Ma-
halanobis distance to the pointer distribution and the
closest object is assumed to be the pointer.
4.4 Estimation of the Pointer Angle
The angle of the pointer is found using principal com-
ponent analysis (PCA), which is defined as an ortho-
gonal projection of the data set onto a subspace that
maximizes the variance of the projected data.
The binary pixels of the pointer object can be in-
terpreted as a set of two-dimensional points, x, and by
projecting x onto the one-dimensional subspace u
1
,
that maximizes the variance of the set, the direction
of the pointer can be determined.
The mean of the projected data can be described
as u
T
1
¯
x, where
¯
x is the mean of x. The variance of the
Figure 5: Visualization of distributions before and after es-
timating parameters using the EM algorithm.
projected data can then be found by
u
T
1
Su
1
1
N
N
n 1
u
T
1
x
n
◦ u
T
1
¯
x (7)
where N is the amount of points in x and the covari-
ance matrix, S, is given by
S
1
N
N
n 1
x
n
◦
¯
x x
n
◦
¯
x
T
(8)
A practical solution to maximizing the projected
variance, u
T
1
Su
1
, is to set u
1
equal to the eigenvector
of the largest eigenvalue found in the covariance ma-
trix (Bishop and Nasrabadi, 2007).
However, the orientation of the object needs to be
determined as the vector can point in two directions
seen from the object’s perspective. The pointy end
of the pointer is assumed to always be longer than
the blunt end relative to the center. Therefore, the di-
rection vector formed from the center of the gauge to
the bounding box center of the pointer object is used
to determine the orientation.
With this known, the pointer vector with the lo-
west angle to the direction vector can be determined
using the angle between the vectors. To improve the
direction vector obtained by PCA, the object is crop-
ped with a circle that has the same center as the gauge
and a radius of one fifth of the radius of the gauge
bezel. This is done because the pointer occasionally
passes over the gauge numbers which produces noise
at the tip of the pointer.
The resulting method will extract the angle in each
frame of the video. This angle will have to be related
to a reference location to obtain an absolute angle as
Reading Circular Analogue Gauges using Digital Image Processing
377
seen in Figure 6, resulting in a time series expressing
the pointer’s angle as a function of time.
Figure 6: Visualization of how the rotation of the pointer is
referenced.
4.5 Data Time Series
As the angle of the pointer can be identified its tran-
sient behaviour throughout a video can now be consi-
dered. Without any filtering, the pressure time series
becomes noisy as seen in Figure 7. The noise is com-
prised of misinterpreted pointer angles and scenarios
where a direction could not be determined.
Pressure time series recorded manually with digi-
tal pressure sensors from waste water pumping stati-
ons were obtained by consulting [an anonymous en-
gineering company], which specializes in waste water
systems. An FFT of the received time series showed
that the important frequency components were below
1Hz. Therefore, based on the Nyquist–Shannon sam-
pling theorem the frequency resolution should be sa-
tisfactory at a minimum of 2 Hz.
To remove outliers, the 30 Hz recorded signal is
filtered by a tenth-order low pass FIR filter, which has
a cutoff frequency of 2 Hz. An example of a recorded
time series before and after being filtered is presented
in Figure 7.
0 5 10 15 20
Time [s]
-
3
/
2
-
-
1
/
2
Pointer angle [rad]
Time series
Unfiltered
Filtered
Annotated
Figure 7: Graph illustrating a raw and noisy signal in blue
and its low pass filtered counterpart in red.
5 DATA SET
Figure 8: Images from the train1, train2 and train3 recor-
dings, seen from left to right, respectively.
The data set that has been used consists of 3 training
videos and 7 testing videos of running analog pres-
sure gauges used in the waste water industry. The re-
cordings have been edited to mainly contain the gauge
bezel and scaled to a size of 512 ⊆ 512 pixels. Howe-
ver, the raw videos and additional recorded videos are
also provided in the published data set.
The 3 training videos are recorded under a vari-
ety of conditions to diversify the training set. train1
is stationary with bright lighting, train2 is stationary
with ambient lighting and train3 is hand held with
ambient lighting. Images from the three recordings
can be seen in Figure 8.
The 7 testing videos are edited to match the for-
mat of the training videos and are provided along
with their corresponding annotations. They are na-
med test1, test2, ..., test7 and are all recorded with
a stationary camera under ambient lighting but each
has a unique combination of characteristics, such as
shaking, erratic pointer, angle, water level, bezel re-
flection and light glare that make them relevant to test
against. Images from the seven recordings can be seen
in Figure 9.
6 RESULTS
Figure 12 shows the results of running the algorithm
on test1. The grey dashed lines in the figure corre-
sponds to a recognized mark in the first frame of the
video. The algorithm recognizes scale marks in all
frames, but for visual purposes, only scale marks from
the first frame are used. Comparing each measure-
ment of the pointer’s angle to the annotated truth, an
error is assigned.
The histogram plot presented in Figure 10 illustra-
tes the absolute error between the annotated and me-
asured signal in radians. The error is normally distri-
buted with a mean and standard deviation of 0.02 and
0.02 radians, respectively. This low error corresponds
to the pointer being approximately 1 degree offset ac-
cording to the annotated data and in a few cases 2-3
degrees off. The observable negative tail in the nega-
tive area may by caused by periods in test1 where the
VISAPP 2019 - 14th International Conference on Computer Vision Theory and Applications
378
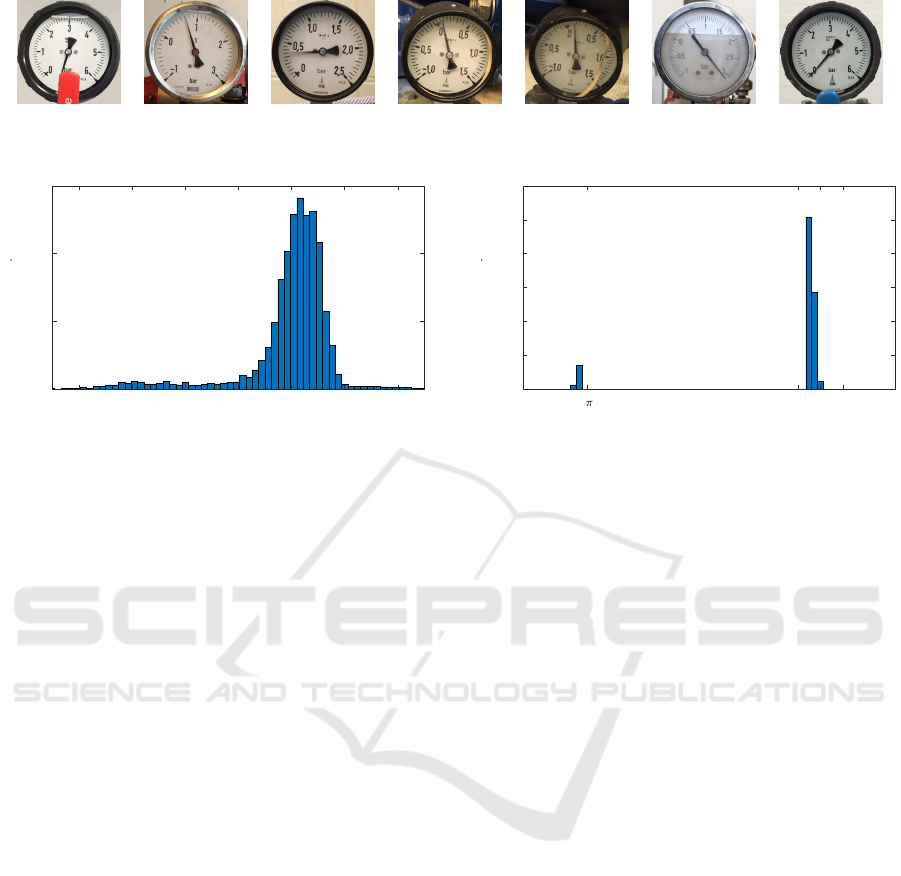
Figure 9: Images from the test1, test2, ..., test7 recordings, seen from left to right, respectively.
Recording: Test1
-0.06 -0.04 -0.02 0 0.02 0.04 0.06
Error [rad]
0
500
1000
1500
Frequecy [ ]
Figure 10: Histogram of the absolute error between the an-
notated and measured signal of the captured time series of
test1.
pointer is covered or by a periodically present shadow
from the pointer.
In some frames, the implementation of the algo-
rithm fails to produce a meaningful angle of the poin-
ter, at which it gives up and stores NAN as the result.
This is illustrated in Figure 13 that shows the compu-
ted signal from test2 with almost no detected pointer
angles in the last part of the signal.
Figure 14 shows the results of running the propo-
sed algorithm on test3. Here it should be noticed how
the computed angle fluctuates heavily. By inspection
of the annotated data, it can be seen that the pointer
does not change as much as predicted during the given
time periods.
However, as emphasized by Figure 11 a signifi-
cant error occurs at almost exactly ◦π, which is ana-
logue for a half circle rotation. By inspection of the
recorded video it can be seen that the pointer is erratic,
and in some frames the pointy end is nearly invisible
due to heavy motion blur. In those frames the algo-
rithm misjudges the direction of the pointer to be the
blunt end resulting in an error of ◦π radians.
Table 2 shows the number of hits and misses as
well as the mean and standard deviation of the pointer
angle error in radians for the seven test videos. Hits
describe the number of frames where the gauge bezel,
pointer and marks are found such that the angle of the
pointer can be estimated. Misses describe the oppo-
site, where the system is not capable of determining
an angle of the pointer relative to the bezel.
Inspection of test2 and test6 shows that the low hit
rate is due to varying lighting conditions, which is es-
Recording: Test3
-
-0.3 0 0.3
Error [rad]
0
200
400
600
800
1000
1200
Frequecy [ ]
Figure 11: Histogram of the absolute error between the an-
notated and measured signal. Notice how there is a signifi-
cant accumulation of erroneous measurements around ◦π.
pecially apparent in the chrome gauge bezels making
them undetectable for the system in large parts of the
recordings.
6.1 Comparison with State-of-the-Art
Over the last couple of decades, many articles have
been published on how to digitise analogue dials
using computer vision and a comparison between the
state-of-the-art methods would, therefore, be appro-
priate. However, even though the meticulousness of
the publications vary, they share the same bad traits
which makes such a comparison difficult to realise.
As presented in the first row of Table 1, the data
that have been used for testing the methods generally
consists of images of a single dial, with the excep-
tion of (Jiannan Chi, 2015) and (Yang et al., 2014).
Furthermore, the results are in many cases based on
only a few images taken from the same angle and light
condition (Ye et al., 2013)(Yi et al., 2017)(Sun et al.,
2014)(Jiale et al., 2011)(Wang et al., 2013). This me-
ans that, even though the results may be good, there
is a high possibility that the methods have been over-
fitted to their respective setups. Lastly, none of the
authors has published their source code or test data,
so it is not possible to replicate their findings.
In order to create a foundation for future bench-
marking tests and comparisons, the entire source code
used for the presented work is published along with
the raw and edited test and training videos.
Reading Circular Analogue Gauges using Digital Image Processing
379
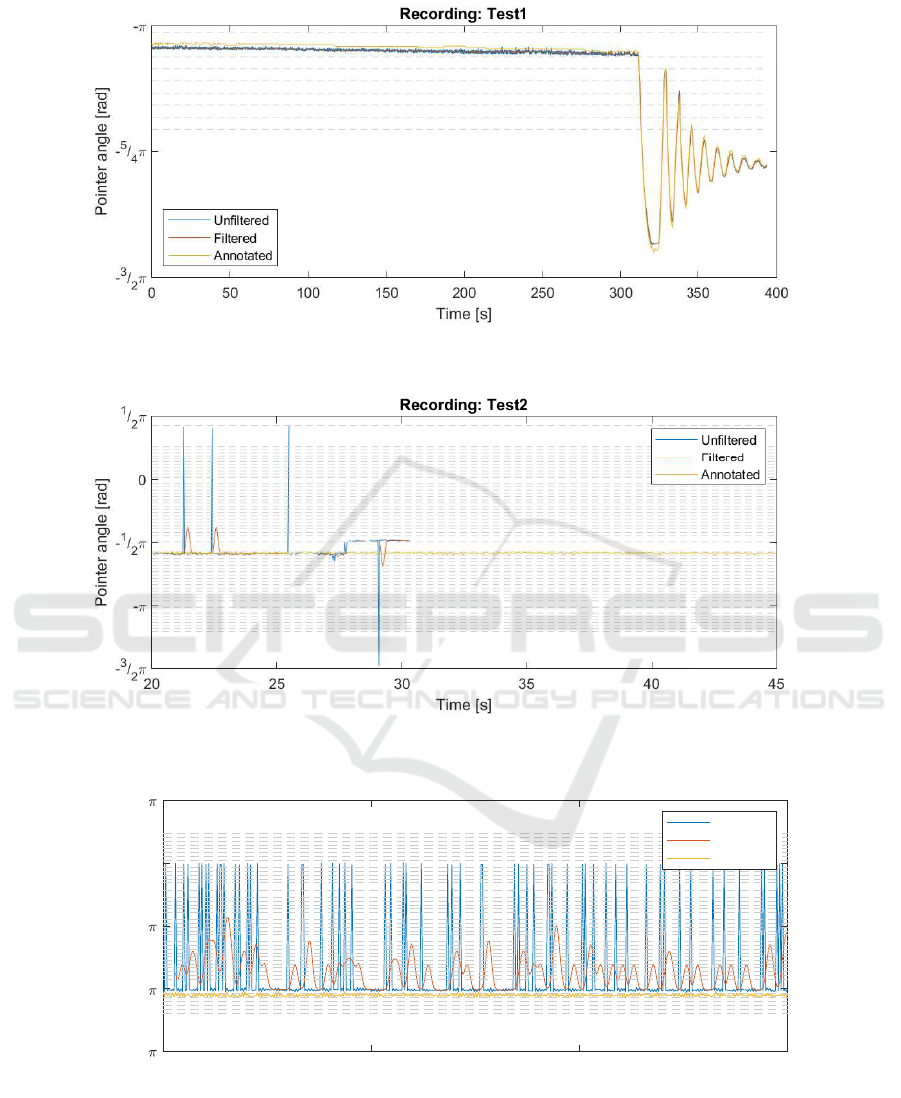
Figure 12: Time series captured by processing test1 using the proposed method. Notice how the measured pointer angle is
closely related to the annotated angle throughout the recording.
Figure 13: Results from performing the algorithm on test2. The system fails to produce any meaningful angle of the pointer
in a significant amount of frames.
0 5 10 15
Time [s]
-
3
/
2
-
-
1
/
2
0
1
/
2
Pointer angle [rad]
Recording: Test3
Unfiltered
Filtered
Annotated
Figure 14: Results from performing the algorithm on test3. The measured signal jumps incorrectly from ◦π to 0 often. This
is due to motion blur of the pointer in test3.
VISAPP 2019 - 14th International Conference on Computer Vision Theory and Applications
380
Table 1: Overview of state-of-the-art methods with regards to accessibility and the number of dials involved in the work.
J. Chi X. Ye C. Zheng M. Yi B. Sun H. Jiale B. Yang Q. Wang Proposed
No. of Dials 2 1 1 1 1 1 8 1 10
Open Source No No No No No No No No Yes
Public Data No No No No No No No No Yes
Table 2: Classification and error rate of the proposed met-
hod when processing the seven test videos.
Hit Miss µ [rad] σ [rad]
test1 11811 0 0.02 0.02
test2 967 1253 -0.47 1.28
test3 1801 0 -0.42 0.39
test4 1111 0 0.08 0.32
test5 451 0 -0.12 0.39
test6 347 704 -6.07 0.56
test7 571 2 -0.13 0.61
7 CONCLUSION
A method to automatically digitize analog circular
gauges using computer vision is presented with an ap-
plication example of a video recording of a pressure
gauge translated into a digital time series.
The method is based on segmenting objects in
each frame using Gaussian adaptive mean threshol-
ding and subsequently classifying the objects using
probability distributions estimated with the unsuper-
vised learning method Expectation Maximization.
The output of the algorithm is an estimated angle of
the pointer object, which is determined using PCA.
Recordings of seven pressure gauges, mounted on
waste water pumping stations, have been processed
by the algorithm. The mean and standard deviation of
the angle error are calculated for each of the videos
with the best case of µ 0.02 radians and σ 0.02
radians.
However, in three of the recordings, significant er-
rors are present. In test2 and test6 the bezel is made
from a reflective material, which makes it difficult to
segment objects properly with the proposed method
due to reflections. In another case, a problem is iden-
tified where the angle of the pointer is miscalculated
by ◦π radians due to motion blur.
The shortcomings that have been uncovered in the
tests are related to specific scenarios, which should be
taken into consideration during the next iteration of
the project. Generally, the results are very promising
and there is a great potential in the proposed parame-
tric classification method.
The source code is published at (Lauridsen and
Grassmé, 2018a) and the test and training data is pu-
blished at (Lauridsen and Grassmé, 2018b).
8 FUTURE WORK
The current system only processes a single frame at
a time, neglecting the benefits that might arise from
utilizing data from neighbouring frames. As an ex-
ample, to achieve better estimates for the circle, cen-
ter or for more accurate scale creation the temporal
neighboring data could be utilized. This could also be
used to reduce the errors introduced by motion blur,
where the angle is incorrectly determined by the blunt
end of the pointer.
Exploring other features, higher feature spaces or
other compositions could possibly increase the accu-
racy and make the proposed solution more robust.
The training data could also be more diverse in order
to better generalize to different types of dials. Lastly,
the level of automation can be improved by recogni-
zing the dial numbers and associating those numbers
to the scale marks.
REFERENCES
Alegria, F. C. and Serra, A. C. (2000). Computer vision
applied to the automatic calibration of measuring in-
struments. Measurement, 28(3):185 – 195.
Bishop, C. M. and Nasrabadi, N. M. (2007). Pattern Recog-
nition and Machine Learning. Journal of Electronic
Imaging, 16(4):049901.
Crawford, J. (1983). A non-iterative method for fitting ci-
rcular arcs to measured points. Nuclear Instruments
and Methods in Physics Research, 211(1):223–225.
Gellaboina, M. K., Swaminathan, G., and Venkoparao, V.
(2013). Analog dial gauge reader for handheld devi-
ces. In 2013 IEEE 8th Conference on Industrial Elec-
tronics and Applications (ICIEA). IEEE.
Jiale, H., En, L., Bingjie, T., and Ming, L. (2011). Reading
recognition method of analog measuring instruments
based on improved hough transform. In IEEE 2011
10th International Conference on Electronic Measu-
rement Instruments, volume 3, pages 337–340.
Jiannan Chi, Lei Liu, J. L. Z. J. G. Z. (2015). Machine
vision based automatic detection method of indicating
values of a pointer gauge. In Mathematical Problems
in Engineering, Article ID 283629, volume 2015.
Lauridsen, J. S. and Grassmé, J. G. (2018a). Bit-
bucket pressure gauge reader source code.
https://bitbucket.org/aauvap/pressure-gauge-reader
[Link].
Reading Circular Analogue Gauges using Digital Image Processing
381

Lauridsen, J. S. and Grassmé, J. G. (2018b).
Kaggle pressure gauge reader data set.
http://kaggle.com/juliusgrassme/pressure-gauge-
reader-data [Link].
Sablatnig, R. and Kropatsch, W. G. (1994). Automatic re-
ading of analog display instruments. In Proceedings
of 12th International Conference on Pattern Recogni-
tion, volume 1, pages 794–797 vol.1.
Selvathai, T., S, J. S., Ramesh, S., and KK, R. (2017). Auto-
matic interpretation of analog dials in driver's instru-
mentation panel. In 2017 Third International Confe-
rence on Advances in Electrical, Electronics, Informa-
tion, Communication and Bio-Informatics (AEEICB).
IEEE.
Sun, B., Zhang, C., Liu, Z., Qian, B., and Zhang, H. (2014).
Study of fpga-based visual detection for pointer dial.
In The 26th Chinese Control and Decision Conference
(2014 CCDC), pages 1467–1472.
Wang, Q., Fang, Y., Wang, W., Wu, M., Wang, R., and Fang,
Y. (2013). Research on automatic reading recogni-
tion of index instruments based on computer vision.
In Proceedings of 2013 3rd International Conference
on Computer Science and Network Technology, pages
10–13.
Yang, B., Lin, G., and Zhang, W. (2014). Auto-recognition
method for pointer-type meter based on binocular vi-
sion. JCP, 9(4):787–793.
Ye, X., Xie, D., and Tao, S. (2013). Automatic value iden-
tification of pointer-type pressure gauge based on ma-
chine vision. JCP, 8:1309–1314.
Yi, M., Yang, Z., Guo, F., and Liu, J. (2017). A clustering-
based algorithm for automatic detection of automo-
bile dashboard. In IECON 2017 - 43rd Annual Confe-
rence of the IEEE Industrial Electronics Society, pa-
ges 3259–3264.
Zheng, C., Wang, S., Zhang, Y., Zhang, P., and Zhao, Y.
(2016). A robust and automatic recognition system of
analog instruments in power system by using compu-
ter vision. Measurement, 92:413 – 420.
VISAPP 2019 - 14th International Conference on Computer Vision Theory and Applications
382
