Calibration of Two 3D Sensors with Perpendicular Scanning
Directions by using a Piece of Paper
Ju-Hwan Lee and Soon-Yong Park
School of Computer Science & Engineering, Kyungpook National University, Daegu, South Korea
Keywords: Calibration, Foot Scanner, Reconstruction, Structured Light Sensor.
Abstract: It is difficult to find the 3D transformation relationship between two 3D sensors when the scanning directions
of the two sensors has very large angle, for example 90 degrees or more. In this paper, we propose a very
simple and efficient calibration method to get 3D transformation between two 3D sensors using a piece of
white-colored paper. A piece of white-colored paper is folded in a quadrangular pyramid shape. The paper
calibration object is placed on the transparent acryl board to get the shape of the object from two 3D sensors
whose scanning direction is about 90 degree. The performance of the proposed calibration method is verified
through 3D model reconstruction experiments. The calibration error between two sensors is less than 0.5 mm.
1 INTRODUCTION
In the shoe industry in the past, customized products
were only offered to people with special needs, such
as medical treatment and athletic players, but many
companies are doing researches to improve customer
satisfaction with the recent trend. An example of
customized products are customized shoes, insole and
so on. To make customized shoes or insole, it is
necessary to know accurate 3D shape information of
customer’s foot.
In the past, the foot measurements were made
using callipers, tape measure and special tools such as
the Foot-Measuring Instrument of Charles F.
Brannock (The Brannock Device Company, 1927).
Alternatively, there is also a measurement method of
foot shape using clay. The above two method is called
contact measurement method. However, contact
measurement results in foot deformity when it is
measured by a person, thus accurate results cannot
always be obtained. In addition, there is a
disadvantage that an accurate measurement is a time-
consuming task.
In order to overcome this problem, many
researches have been done to acquire 3D shape of
human foot using non-contact measurement methods
(Kouchi & Mochimaru, 2001), (Wibowo et al., 2017).
The non-contact method measures the 3D foot shape
through a 3D sensing device composed of laser, white
light or pressure device. It has the advantage of
Figure 1: A circular-type 3D foot scanner using structured
light sensing method.
measuring accurate shape information without
deformation of foot shape and measuring faster than
the contact measurement method.
Several commercial 3D foot scanners are
available already. Examples are LSF-350 foot 3D
scanner of 3DOE solutions (3DOE Solution, 2013),
HP Fitstation’s 3D foot scanner (FitStation, 2018)
and Podia scanner of STT systems (STT Systems,
2018).
In general, the 3D foot scanner is equipped with
two or more 3D sensing devices to acquire shape
information of the entire foot. The sensor of the foot
scanner normally uses structured light for precise
measurement. And the scanning system consists of a
lower 3D sensor which scans the sole of the foot and
162
Lee, J. and Park, S.
Calibration of Two 3D Sensors with Perpendicular Scanning Directions by using a Piece of Paper.
DOI: 10.5220/0007383301620168
In Proceedings of the 14th International Joint Conference on Computer Vision, Imaging and Computer Graphics Theory and Applications (VISIGRAPP 2019), pages 162-168
ISBN: 978-989-758-354-4
Copyright
c
2019 by SCITEPRESS – Science and Technology Publications, Lda. All rights reserved
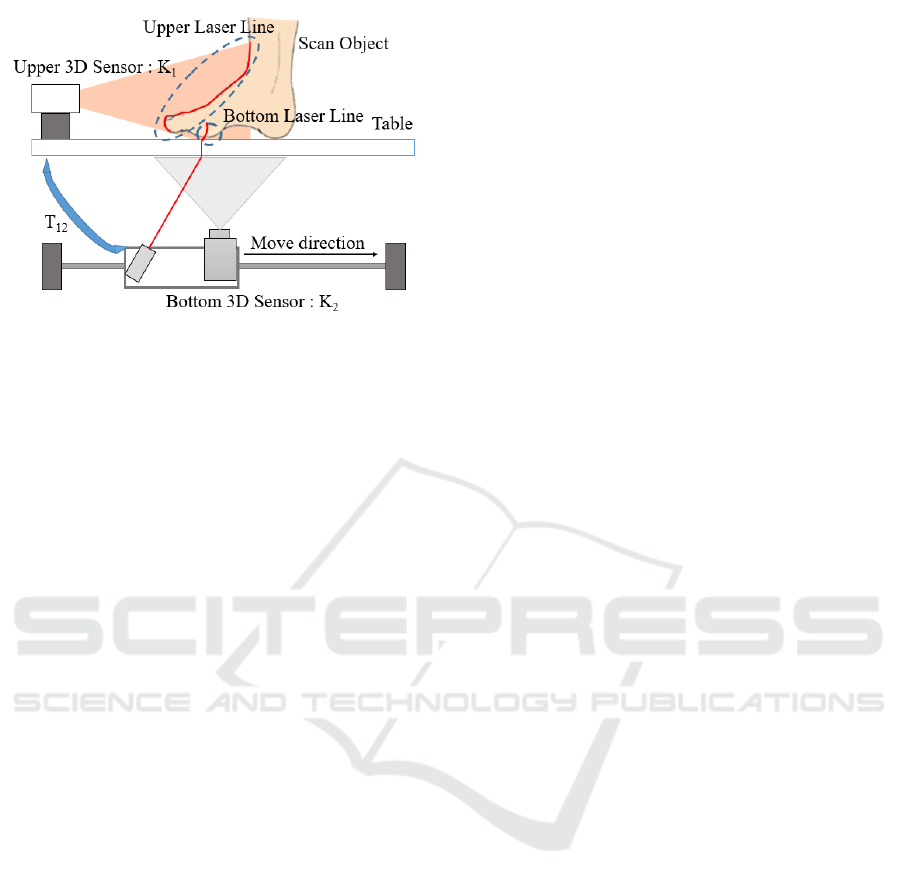
Figure 2: The circular foot scanner consists of an upper 3D
scan sensor and a lower 3D scan sensor.
an upper sensor scans the upper part of the foot. The
two scan results are then combined to obtain the entire
3D shape of the foot.
In a previous paper of this study (Lee et al., 2017),
we developed a three-dimensional circular foot
scanner with upper and lower 3D sensors to obtain the
whole shape of the foot, as shown in Figure 1. For
scanning the whole shape of the foot, the upper sensor
moves along a circular stage and the lower sensor
moves along a linear stage. To obtain the correct
shape of the whole foot, it is necessary to represent
the data acquired from each view point as a single
view point. In order to represent the data obtained
from different viewpoints as a single view point, it is
necessary to know a 3D transformation relation
between the two sensors.
In Figure 2, K
1
and K
2
represent the upper and the
lower 3D scanning sensor coordinate systems. The
3D transformation relationship between the two
sensor systems is expressed as T
12
. T
12
is represented
by a 3x3 rotation matrix R and a translation vector t.
In general, for two different cameras, the
transformation matrix between two viewpoints can be
obtained by the Zhang algorithm (Zhang, 2000)
which uses a checkerboard. In our previous research,
we also used a checkerboard pattern to find the
transformation relationship between the upper and
lower 3D sensors.
However, the Zhang algorithm is difficult to use
for calibration between two sensors when the angle
between two sensors’s viewing direction is large.
Unfortunately, because most foot scanners use
multiple 3D sensors to obtain soles and foot shapes,
the viewing angles between the sensors are often
more than 90 degrees. In this reason, some researches
have been done to calibrate 3D sensors with large
between large viewing angle by using special
calibration objects.
(Barone et. al., 2013) calibrates two sensors by
placing printed markers on an object. Using markers
has an advantage of being able to know the direction
of the object and clearly identify the feature points for
correction, but placing printed markers on the object
is an inconvenient method. (Mitchelson and Hilton,
2003) use a specially designed LED pattern to
calibrate two sensors. Another calibration method is
using three or more checkerboard pattern attached
perpendicular each other on a cube box. But it is not
easy to make two or more sensors see the three
checkerboard pattern simultaneously.
When a 3D scanning system consists of multiple
3D sensors with large viewing directions, it is
difficult to calibrate the sensor coordinate systems. In
the previous researches, only specially designed
calibration objects and algorithm are used. In
addition, because the 3D scanning systems of the
previous researches have different structure than our
scanning system, it is not easy to employ the previous
methods.
In this paper, we propose a very simple and easy
calibration method for the calibration of two 3D
sensor systems. Especially the proposed method is
applied for the calibration of our 3D foot scanning
system. We evaluate the performance of the proposed
method by obtaining the 3D model of the human foot
using the transformation between the two 3D sensors.
2 CALIBRATION METHOD
USING A PAPER OBJECT
The authors of this paper have reflected on how to
calibrate between two sensors that are more than 90
degree easily and simply. And making of the
calibration object was also focused on using materials
that are readily available from around, so that anyone
can calibrate easily the two sensors. Therefore, the
criteria of the proposed calibration object are as
follows:
1. The material of the calibration object should be
readily available from around.
2. The making of the calibration object should be
easy enough for everyone.
3. Algorithms for calibrating between the two
sensors using a calibration object should also be
simple.
Calibration of Two 3D Sensors with Perpendicular Scanning Directions by using a Piece of Paper
163
2.1 Calibration Object using One Piece
of Paper
As described in the introduction, specially designed
calibration objects can be used for our foot scanner.
However, it is not easy to make a special calibration
object, such an exact square-shape board, attaching
LED patterns, and attaching printed markers on an
object.
In this paper, we try to find a simple and efficient
method for calibration of two 3D sensors which have
orthogonal scanning directions. We propose a very
simple solution by using an easily available piece of
A4 paper. First we make a quadrangular pyramid
object using a piece of A4 paper and use both sensors
to scan the inside and outside shapes of the object.
And then we calibrate between the two sensors by
matching the 3D shapes. The background of making
the calibration object using an A4 paper is as follows:
- The thickness of one piece of A4 paper is less
than 0.1mm.
- After making a quadrangular pyramid object
with a single piece of A4 paper, the inner and the
outer of the object are scanned. Then the two scan
data can be matched with only 0.1 mm error, which is
negligible.
- A piece of A4 paper can be easily obtained from
around.
Figure 3 shows how to scan a calibration object made
with a piece of paper from two 3D sensors. As shown
in the figure, if the scanning of the calibration object
consisting of 3D data from an upper sensor and a
lower sensor, each sensor can acquired 3D surface da-
Figure 3: How to scan a calibration object made from one
paper with two sensors. We can obtain 3D scanning data of
the inner and outer surfaces of calibration objects from two
sensors.
ta of the inside and outside of the calibration object.
The shape of the calibration object does not matter,
while the shape of the calibration object used in this
paper is a pyramid shape that is easy to make, and one
edge of the pyramid is cut out to find the direction of
the object.
Any other shape or material can be used for
calibration object, but it should be very thin. The
thinner the portion corresponding to the side of the
calibration object, the less the calibration error
between the two sensors. In this paper, we make a
calibration object with the shape of a pyramid that is
easiest to make with a piece of paper.
2.2 Calibration Method
In order to represent the data acquired at different
viewpoints as a single coordinate system, we should
find 3D transformation relationship between two
sensors by using the calibration object. The
transformation matrix T
12
between the two sensors
can be expressed as Eq. 1.
T
12
(1)
When the calibration object is scanned by the two 3D
sensors, the acquired scan data of the calibration
object is represented by the coordinate system of each
sensor.
If there are 3D surface information of the same
object at different viewpoints, the 3D transformation
matrix between two sensors can be simply found
using the well-known ICP (Iterative Closest Point)
algorithm (Besl and McKay, 1992). Since the scan
resolution of each sensor is different, the 3D
transformation matrix T
12
between the two sensors
can be obtained using the point-to-plane ICP
algorithm (Low, 2004).
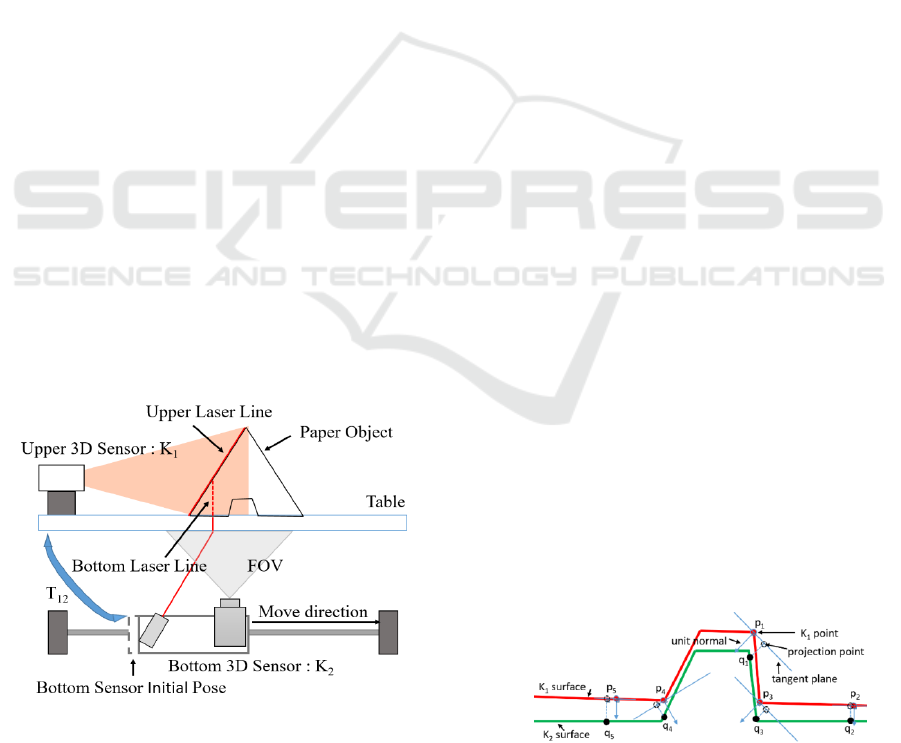
Figure 4 illustrates how to use the point-to-plane
algorithm to find the 3D relationship between two
sensors. In the figure, two 3D surfaces of the scanned
object by sensors K
1
and K
2
, are ‘K
1
surface’ and ‘K
2
Figure 4: How to use the point-to-plane algorithm to find
the transformation matrix between two points.
VISAPP 2019 - 14th International Conference on Computer Vision Theory and Applications
164
surface’, respectively. And the points on the surface
are expressed as p
i
and q
j
. Ideally speaking, two 3D
shapes of the calibration object scanned by both
sensors must be the same.
First, the unit normal for all points p
i
on the ‘K
1
surface’ is calculated by using neighbour points of p
i
.
Then, the 3D point q
i
on the ‘K
2
surface’ which is
closest to p
i
on the ‘K
1
surface’ is projected onto the
tangent plane of p
i
. Therefore we can find p’
i
on the
tangent plane of p
i
, as the correspondence of q
i
as
shown in Eq. 2. By minimizing the error ε, we can
find 3D transformation matrix T
12
in which the sum
of the distances of p’
i
and q
i
is minimized by using
LSM (Least Square Minimization).
(2)
The above point-to-plane ICP can be expressed as
follows pseudocode code.
---------------------------------------------------------------
While(ε > T
ε
)
// Find the corresponding point q
i
where the
distance between p
i
and q
j
is minimum…
// Find the T matrix that minimizes the error...
// Convert q
j
to global coordinate system
---------------------------------------------------------------
Theoretically, when a calibration object made
using a piece of paper is scanned with two sensors,
the 3D transformation relationship between the two
sensors is obtained perfect. However, because the
paper thickness, there is a 0.1mm translation error
between the two sensors. In this paper, we consider
that this small error is negligible in the application of
our 3D foot scanner.
3 EXPERIMENTS
To verify the performance of the proposed method,
we used a circular 3D foot scanner as shown in Fig 5.
As shown in the figure, the upper 3D sensor of the
circular scanner is designed to rotate along the center
axis of the turntable and scans the instep of the foot.
The upper 3D sensor consists of one vision camera
and two line lasers.
The depth of the scanned object surface is calculated
by detecting two line lasers projected on the instep of
the foot from the image of the camera. Therefore, the
rotation sensor scans partial surface of the foot. The
lower 3D sensor of the circular foot scanner consists
of one laser and one camera. The sensor is mounted
on a linear stage, so it scans the bottom part of the
foot. The angle of the upper and lower sensors is
almost 90 degree, but not exactly.
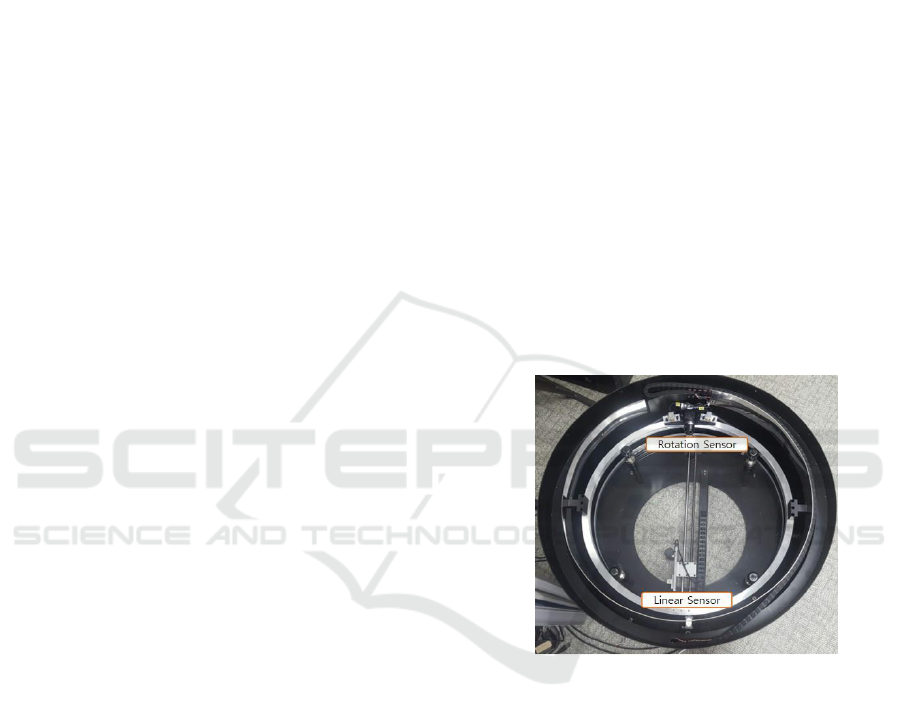
Figure 5: A circular 3D foot scanner for experiments.
To calibrate 3D relationship between the two
sensors, a piece of A4 paper is used. By folding the
paper, we make a pyramid-shaped calibration object
as shown in Figure 6. Any other shape of object can
be use if the object’s outer and inner surface has
enough geometry for ICP matching. The size of the
object is very appropriate for 3D scanning with our
foot scanner. At the one side of the pyramid, there is
a cut-out to distinguish the direction of the object as
shown in the figure.
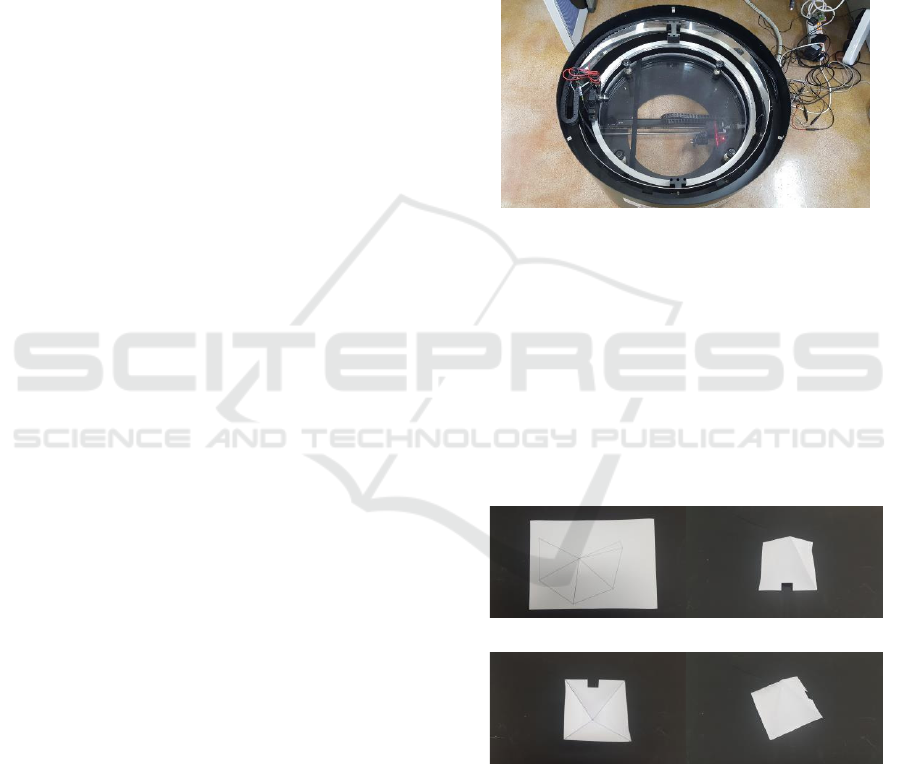
(a) (b)
(c) (d)
Figure 6: Photographs of the calibration object (a) shows
the schematic of the calibration object drawn on a piece of
A4 paper, (b) shows outer surface of the object which is
scanned by the upper sensor, (c) shows inner surface of the
object which is scanned by lower sensors, (d) shows a side
view of the calibration object.
Calibration of Two 3D Sensors with Perpendicular Scanning Directions by using a Piece of Paper
165
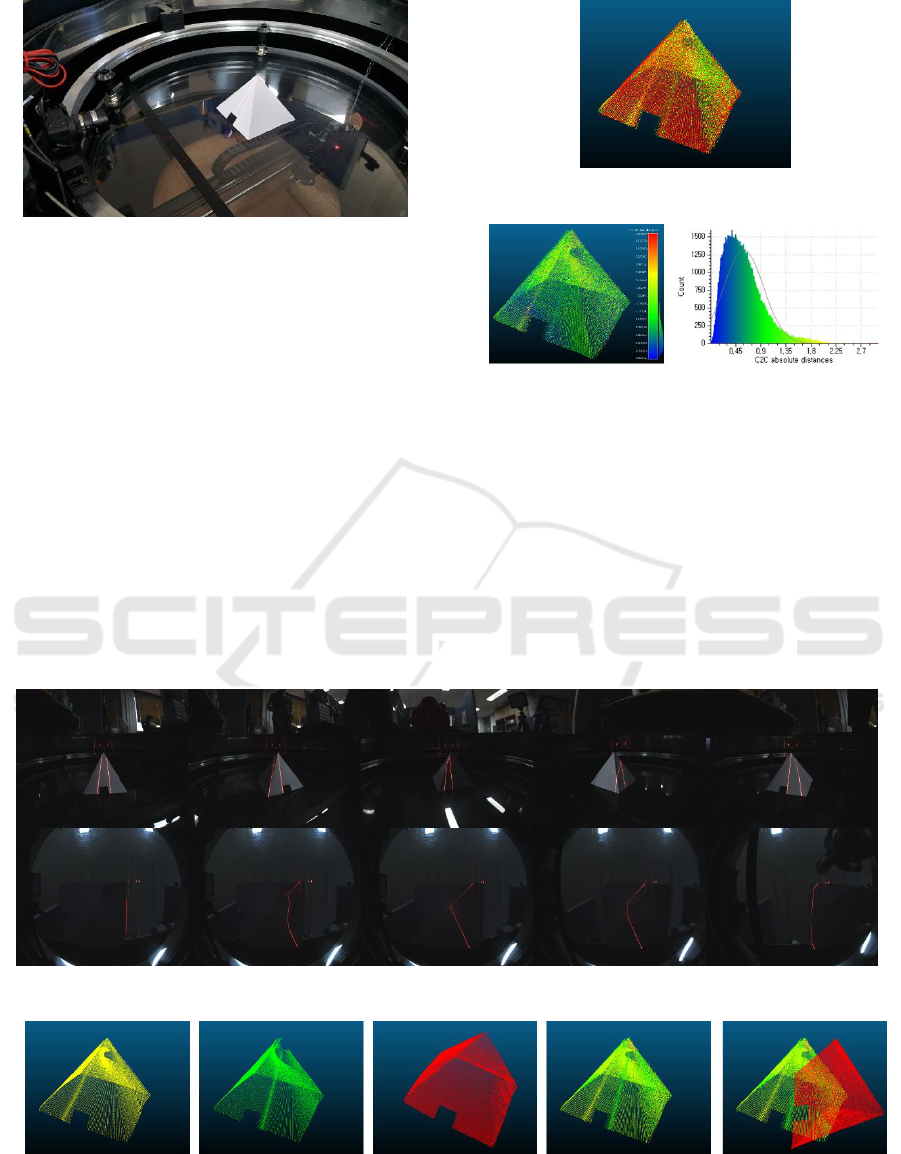
Figure 7: A pyramid object placed at a position visible from
both 3D sensors.
As shown in Figure 7, the calibration object is
placed at the center of the circular scanner, and the
calibration object is scanned using both the upper and
lower sensors of the scanner. Figure 8 shows images
of the calibration object captured from the two
cameras. Figure 9 shows the 3D scanning results from
the two sensors. Since the scanned information of the
object is expressed based on the coordinate system of
each sensor, the surface information of the object
scanned by the two sensors in the single coordinate
system can be expressed as shown in Fig 9 (e).
Using the point-to-plane ICP algorithm described
in Section 2.2, we can calculate the three-dimensional
transformation relation between two sensors with the
3D surface information of the calibration object
scanned by each sensor. Figure 10 shows the results
Figure 10: ICP matching result of the two scanned shapes.
Figure 11: Matching error between the two 3D shapes after
ICP transformation.
of the point-to-plane ICP algorithm between the two
sensors. It looks that two shapes are matched exactly
since the color of the two shapes are overlapped.
Therefore, we can confirm that the surface information
of the calibration object expressed in different
coordinate systems is transformed to one coordinate
system.
To analyse the transformation error, the ICP
matching error is shown in Figure 11. From 3D points
on the ‘K
1
surface’, we find the closest points on the
Figure 8: Images obtained from the upper and lower sensors of the foot scanner.
Figure 9: (a) and (b) shows the scanned 3D points of the calibration object using the left and right lasers of the upper 3D
sensor, (c) shows the scanned 3D points using lower sensor, (d) shows 3D points that combine (a) and (b), (e) shows two
scanned shapes by the upper and lower sensors in the upper sensor’s coordinate system.
VISAPP 2019 - 14th International Conference on Computer Vision Theory and Applications
166
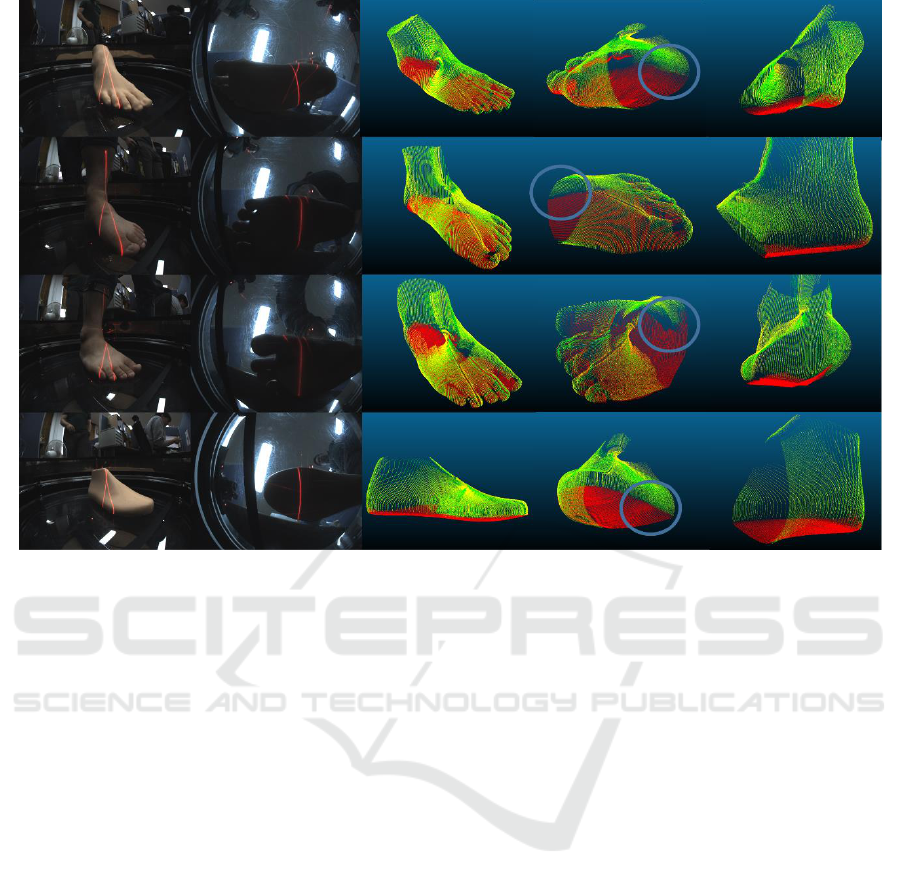
Figure 12: Results of 3D foot models by using the transformation relation between two sensors. From the top, 3D models of
a plastic foot model, human left and right foot, and a plastic raster of shoes.
‘K
2
surface’. The distance between the closest
matching points is measured and displayed in Figure
11. The overall trans-formation error is less than 0.5
mm on average. Theoretically, the 3D reconstruction
error of the foot scanner is 0.1mm, because it is the
thickness of the paper object. However, in real
experiments, the 3D foot reconstruction error is more
than 0.1 mm. The 3D reconstruction error mainly due
to two reasons. The first is the thickness of the paper
and the second is the reconstruction error of each 3D
sensor.
After the calibration, we know the 3D
transformation between two sensors. Using the
calibration data, the foot scanner can be used to
reconstruction various models after scanning the
object using two sensors. Figure 12 shows results of
modelling after scanning various objects on the foot
scanner. The results show that the 3D model of
human foot obtained from the scanner. The upper and
the lower 3D shapes are matched very exactly. In the
enlarged part of the 3D model, we know that 3D
shapes of two different sensors are aligned very
exactly.
4 CONCLUSIONS
It is difficult to find the 3D transformation
relationship between two sensors when the angle
between the two sensors is perpendicular or 90
degrees or more, such as a foot scanner. Therefore, in
this paper, we propose a simple method to find the 3D
relationship between two sensors with a paper
calibration object. The calibration object proposed in
this paper has advantages that it can be easily made
by anyone and it is easy to obtain an A4 paper. The
transformation relationship between the two sensors
was obtained by using the calibration object, and the
performance of this paper was verified by
reconstructing 3D models of human foot.
ACKNOWLEDGEMENTS
This work was supported by the Industrial Strategic
Technology Development Program (10083642)
funded By the Ministry of Trade, Industry & Energy
(MOTIE, Korea) and This research was supported by
The Leading Human Resource Training Program of
Regional Neo industry through the National Research
Calibration of Two 3D Sensors with Perpendicular Scanning Directions by using a Piece of Paper
167

Foundation of Korea (NRF) funded by the Ministry
of Science, ICT and future Planning (NRF-
2016H1D5A1909829)
REFERENCES
The Brannock Device Company, 1927.
https://brannock.com
Kouchi, M., M. Mochimaru., 2001. Development of a low
cost foot-scanner for a custom shoe making system, 5th
ISB Footwear Biomechanics (2001): 58-59.
Wibowo, D. B., Haryadi, G. D., Widodo, A., Rahayu, S. P.,
2017. Estimation of calcaneal loading during standing
from human footprint depths using 3D scanner. In AIP
Conference Proceedings, volume 1788, pages 030063.
3DOE Solutions, 2013. http://www.3doescanner.com.
FitStation., 2018. https://www.fitstation.com.
STT Systems, 2018. https://www.stt-systems.com.
Lee, M. J., Baek, S. H., Park, S. Y., 2017. 3D foot scanner
based on 360 degree rotating-type laser triangulation
sensor. In Society of Instrument and Control Engineers
of Japan (SICE), 2017 56th Annual Conference, pages.
1065-1070. IEEE.
Zhang, Z., 2000. A flexible new technique for camera
calibration. IEEE Transactions on Pattern Analysis and
Machine Intelligence, volume 22, No.11, pages. 1330-
1334.
Barone, S., Paoli, A., Razionale, A. V., 2013. Multiple
alignments of range maps by active stereo imaging and
global marker framing. Optics and Lasers in
Engineering, 51(2), pages 116-127.
Mitchelson, J., Hilton, A., 2003. Wand-based multiple
camera studio calibration. Center Vision, Speech and
Signal Process.
Besl, P. J., McKay, N. D., 1992. Method for registration of
3-D shapes. In: Sensor Fusion IV: Control Paradigms
and Data Structures. International Society for Optics
and Photonics, pages. 586-607.
Low, K. L., 2004. Linear least-squares optimization for
point-to-plane icp surface registration. Chapel Hill,
University of North Carolina, 4(10).
VISAPP 2019 - 14th International Conference on Computer Vision Theory and Applications
168
