
Exhaustive Testing of Trader-agents in Realistically Dynamic
Continuous Double Auction Markets: AA Does Not Dominate
Dave Cliff
Department of Computer Science
University of Bristol, Bristol BS8 1UB, U.K.
Keywords: Financial Markets, Automated Trading, Computational Finance, Agent-based Computational Economics.
Abstract: We analyse results from over 3.4million detailed market-trading simulation sessions which collectively
confirm an unexpected result: in markets with dynamically varying supply and demand, the best-performing
automated adaptive auction-market trading-agent currently known in the AI/Agents literature, i.e.
Vytelingum’s Adaptive-Aggressive (AA) strategy, can be routinely out-performed by simpler trading
strategies. AA is the most recent in a series of AI trading-agent strategies proposed by various researchers
over the past twenty years: research papers contributing major steps in this evolution of strategies have been
published at IJCAI, in the Artificial Intelligence journal, and at AAMAS. The innovative step taken here is to
brute-force exhaustively evaluate AA in market environments that are in various ways more realistic, closer
to real-world financial markets, than the simple constrained abstract experimental evaluations routinely used
in the prior academic AI/Agents research literature. We conclude that AA can indeed appear dominant when
tested only against other AI-based trading agents in the highly simplified market scenarios that have become
the methodological norm in the trading-agents academic research literature, but much of that success seems
to be because AA was designed with exactly those simplified experimental markets in mind. As soon as we
put AA in scenarios closer to real-world markets, modify it to fit those markets accordingly, and exhaustively
test it against simpler trading agents, AA’s dominance simply disappears.
1 INTRODUCTION
Automated algorithmic trading systems are a big
business. In most major financial markets around the
world, jobs previously done by highly-paid human
traders are now routinely done by machines,
autonomous adaptive computational systems that can
process vast amounts of data and that can act and react
at speeds that no human is physically capable of
matching. Commonly referred to as “algo traders” or
“robot traders”, such automated systems running in any
one major investment bank might be responsible for
order-flows of $100Bn or more per working week.
When it comes to sub-second financial-market trading,
we Homo Sapiens are simply made from the wrong
hardware: in the global financial markets, the “rise of
the robots” has been underway for the past 10 years or
more. And, inside that industry, everybody knows the
robots won (see e.g. Rodgers, 2016).
The AI and Autonomous Agents research
community should be claiming this as a victory, a
major demonstration of success. If the annual
compensation (salary and bonuses) paid to someone in
a knowledge-intensive job is even a half-way
reasonable indication of the intelligence required to do
that job, then the fact that traders previously paid very
high levels of compensation have now been replaced
by machines costing only a tiny fraction of a trader’s
salary is surely a sign that, in the domain of the
financial markets, the widespread deployment of
artificially intelligent “robot trader” autonomous
agents is a major success story for AI/Agents research.
Such a claim can be justified by reference to the key
published literature on adaptive automated trading.
Although a few significant publications contributing to
the development of robot-trading systems came from
academic economists, the landmark papers largely
appeared in AI and autonomous-agent publication
venues such as the International Joint Conference on
Artificial Intelligence (IJCAI), the International
Conference on Autonomous Agents and Multi-Agent
Systems (AAMAS), the Artificial Intelligence journal
(AIJ), and in previous ICAART papers: Section 2
reviews in more detail eight major publications in
the development of this field.
The review in Section 2 is important, because there we
224
Cliff, D.
Exhaustive Testing of Trader-agents in Realistically Dynamic Continuous Double Auction Markets: AA Does Not Dominate.
DOI: 10.5220/0007382802240236
In Proceedings of the 11th International Conference on Agents and Artificial Intelligence (ICAART 2019), pages 224-236
ISBN: 978-989-758-350-6
Copyright
c
2019 by SCITEPRESS – Science and Technology Publications, Lda. All rights reserved

trace the way in which the methodology of initial
experiments published in 1962 by a young economist,
Vernon Smith (who 40 years later would be awarded
the Nobel Prize for his empirical research work) have
since come to be fixed, or fixated upon, in the
AI/agents literature. Motivated by what it seems fair to
assume was a well-intentioned desire to show each set
of the latest results in the context of what had gone
before, papers that followed Smith’s replicated much
or all of his 1962 experiment design and analysis. And
this, it seems, may have led down a dead end.
The papers reviewed here are a sequence of steps,
each building on the earlier work, that lead to the most
recent step: Vytelingum’s 2006 PhD thesis which
described a trading algorithm called Adaptive
Aggressive (AA) that, in an AIJ paper (Vytelingum et
al., 2007), and in subsequent ICAART and IJCAI
papers (De Luca and Cliff, 2012a, 2012b), was
demonstrated to be the best-performing public-domain
trading strategy. That is, AA was shown to perform
better, for a specific definition of “better”, than all other
notable strategies published in the literature up to that
time. (It is possible that better strategies exist and are
being used to profitably trade in real financial markets,
but for obvious reasons any such strategies would be
closely-guarded commercial secrets: we can only talk
with any authority about those strategies known in the
public domain).
In this paper we demonstrate that the trading
capabilities of AA are, when faced with realistic
market dynamics, in fact really rather limited. While
AA does very well in the type of minimally-simple
abstract market experiments that had become the norm
for evaluating and comparing trading-agent
algorithms, we argue here that this success is due to AA
having been seemingly (and perhaps subconsciously)
designed specifically to address features of those
abstract experimental markets, features that are absent
or much more complicated in real-world markets. It is
as if, somewhere along the line, people collectively lost
sight of the fact that the ultimate test of any automated
trading system claimed to be relevant to the real-world
financial markets is simply stated: how much money
can it actually make? The results presented here
demonstrate that, when operating in a realistically
dynamic market, AA routinely makes less money than
simpler strategies.
This paper reports on simulation experiments
involving more than 3 million independent market
sessions where AA and various other trading strategies
interact and compete for limited profits, in a market
with a Limit Order Book (LOB), the core data structure
found in real-world financial markets, explained
further in Section 2.2. We use the free open-source
BSE LOB-market simulator (BSE, 2012; Cliff, 2018)
available from GitHub since 2012. Using a well-
established public-domain market simulator makes it
easier for other researchers to check, replicate, and
extend our methods and results.
After the review of past work in Section 2, in
Section 3 we briefly discuss issues arising,
modifications that need to be made, to adapt AA from
its original design (which is extremely well-suited to
minimal abstract market experiments) over to working
in the much more realistic environments presented by
a contemporary market simulator such as BSE. To
distinguish between the original AA, which does not
operate in realistic markets, and the version modified
and extended to work in BSE, we here refer to the latter
as Modified AA (MAA). We describe our methods in
Section 4, and our results in Section 5.
We start in Section 5.1 by replicating the spirit of
prior work, comparing MAA’s performance to other
trading agents in a BSE market that is deliberately
constrained to match the simplifying assumptions and
constraints of earlier experimental work. After that, we
explore the effects of removing those simplifying
assumptions and constraints: we report the resultant
changes in the relative performance of MAA and those
other trading strategies active in the market alongside
it. We find that when the market’s underlying supply
and demand schedules are stationary (i.e., are largely
fixed for the course of an experiment) or suffer
intermittent step-change “price shocks”, MAA does as
well as all previous publications lead us to expect.
However, when we introduce dynamic variation into
the supply and demand schedules over the course of
individual experiments, such that the market’s
equilibrium price is continuously varying, we then find
that MAA’s performance degenerates badly. Section
5.2 then presents results from experiments where
fluctuations in the equilibrium price are driven by a
price-history taken from a real-world asset, for a
variety of asset-classes. We find that these real-world
dynamics lead MAA to always do worse than simpler
strategies.
Section 6 then discusses these results and
concludes that the success of MAA seems to be due in
large extent to “methodological over-fitting”, i.e. to
being embedded in a research methodology so set on
repeating the same style of experiments (admirably so,
because replication is fundamental to validation), that
it lost sight of what real-world phenomena those
experiments were intended to be abstract models of.
MAA does very well in the abstract experimental
scenarios, but it does so well in comparison to its
terrible performance in more realistic scenarios that it
is hard to avoid the conclusion that AA was (perhaps
Exhaustive Testing of Trader-agents in Realistically Dynamic Continuous Double Auction Markets: AA Does Not Dominate
225

subconsciously) designed specifically for those
abstract models without much consideration of its
performance in more realistic environments like actual
financial markets. Unfortunately for MAA,
practitioners in real financial markets are not at all
forgiving of mismatches between models and reality.
The ultimate message of this paper is that we should all
be testing our systems in as realistic environments as
we have reasonable access to. Free access to public-
domain open-source market simulators such as BSE,
and to alternatives such as OpEx (De Luca, 2015) or
ExPo (Stotter et al., 2013), coupled with cheaply
available cloud computing, now makes this kind of
study much easier for others to replicate.
2 BACKGROUND
The 2002 Nobel Prize in Economics was awarded to
Vernon Smith, in recognition of Smith’s work in
establishing and thereafter growing the field of
Experimental Economics (abbreviated hereafter to
“ExpEcon”). Smith showed that the microeconomic
behaviour of human traders interacting within the rules
of some specified market, known technically as an
auction mechanism, could be studied empirically,
under controlled and repeatable laboratory conditions,
rather than in the noisy messy confusing circumstances
of real-world markets. The minimal laboratory studies
could act as useful proxies for studying real-world
markets of any type, but one particular auction
mechanism has received the majority of attention: the
Continuous Double Auction (CDA), in which any
buyer can announce a bid-price at any time and any
seller can announce an offer-price at any time, and in
which at any time any trader in the market can accept
an offer or bid from a counterparty, and thereby engage
in a transaction. The CDA is the basis of major
financial markets worldwide.
Smith’s initial set of experiments were run in the
late 1950’s, and the results and associated discussion
were presented in his first paper on ExpEcon,
published in the highly prestigious Journal of Political
Economy (JPE) in 1962. It seems plausible to speculate
that when his JPE paper was published, Smith had no
idea that it would mark the start of a line of research
that would eventually result in him being appointed as
a Nobel laureate. And it seems even less likely that he
would have foreseen the extent to which the
experimental methods laid out in that 1962 paper
would subsequently come to dominate the
methodology of researchers working to build adaptive
autonomous trading agents by combining tools and
techniques from artificial intelligence (AI), machine
learning (ML), agent-based modelling (ABM), and
agent-based computational economics (ACE).
Although not a goal stated at the outset, this strand of
AI/ML/ABM/ACE research converged toward a
common aim: specifying an artificial agent, an
autonomous adaptive trading strategy, that could
automatically tune its behaviour to different market
environments, and that could reliably beat all other
known automated trading strategies, thereby taking the
crown of being the current best trading strategy known
in the public domain, i.e., the “dominant strategy”.
Over the past 20 years the dominant strategy crown has
passed from one algorithm to another. Here, we
demonstrate that the current holder of the title,
Vytelingum’s (2006) AA strategy, does not perform
nearly so well as was previously believed from success
in small numbers of simple trials.
Given that humans who are reliably good at trading
are generally thought of as being “intelligent” in some
reasonable sense of the word, the aim to develop ever
more sophisticated artificial trading systems is clearly
within the scope of AI research, although some very
important early ideas came from the economics
literature: a comprehensive review of relevant early
research was presented by Cliff (1997). Below in
Section 2.1 we first briefly introduce eight key
publications leading to the development of AA; then
describe key aspects of ExpEcon market models in
Section 2.2; and then discuss each of the eight key
publications in more detail in Section 2.3.
2.1 A Brief History of Trading Agents
Our story starts with Smith’s 1962 JPE paper. The next
major step comes 30 years later, with a surprising result
published in the JPE by Gode and Sunder (1993): this
popularised a minimally simple automated trading
algorithm now commonly referred to as ZIC. A few
years later two closely related research papers were
published independently and at roughly the same time,
each written without knowledge of the other: the first
was a Hewlett-Packard Labs technical report by Cliff
(1997) describing the adaptive AI/ML trading-agent
strategy known as the ZIP algorithm; the second
summarised the PhD thesis work of Gjerstad, in a paper
co-authored with his PhD advisor (Gjerstad and
Dickhaut 1998), describing an adaptive trading
algorithm now widely known simply as GD.
After graduating his PhD, Gjerstand worked at IBM’s
TJ Watson Labs where he helped set up an
ExpEcon laboratory that his IBM colleagues used in a
study that generated world-wide media coverage when
the results were published by Das et al. at IJCAI-2001.
This paper presented results from studies exploring the
ICAART 2019 - 11th International Conference on Agents and Artificial Intelligence
226

behaviour of human traders interacting with GD and
ZIP robot traders, in a CDA with a Limit Order Book
(LOB: explained in more detail in Section 2.2, below),
and demonstrated that both GD and ZIP reliably
outperformed human traders. Neither GD nor ZIP had
been designed to work with the LOB, so the IBM team
modified both strategies for their study. A follow-on
2001 paper by Tesauro and Das (two co-authors of the
IBM IJCAI paper) described a more extensively
Modified GD (MGD) strategy, and later Tesauro and
Bredin (2002) described the GD eXtended (GDX)
strategy. Both MGD and GDX were each claimed to
be the strongest-known public-domain trading
strategies at the times of their publication.
Subsequently, Vytelingum’s 2006 thesis
introduced the Adaptive Aggressive (AA) strategy
which, in an AIJ paper (Vytelingum et al., 2007), and
in later ICAART and IJCAI papers (De Luca and Cliff
2012a, 2012b), was shown to be dominant over ZIP,
GDX, and human traders. Thus far then, AA holds the
title.
However Vach (2015) recently presented results
from experiments with the OpEx market simulator (De
Luca, 2015), in which AA, GDX, and ZIP were set to
compete against one another, and in which the
dominance of AA is questioned: Vach’s results
indicate that whether AA dominates or not can be
dependent on the ratio of AA:GDX:ZIP in the
experiment: for some ratios, Vach found AA to
dominate; for other ratios, it was GDX. Vach studied
only a relatively small sample from the space of
possible ratios, but his results prompted the work
reported here, in which we exhaustively sample a wide
range of differing ratios of four trading strategies (AA,
ZIC, ZIP, and the minimally simple SHVR strategy
described in Section 2.2), doing a brute-force search
for situations in which AA is outperformed by the other
strategies. The combinatorics of such a search are quite
explosive, and in Section 5 we report on results from
over 3.4 million individual simulations of market
sessions. Our findings indicate that Vach’s observation
was correct: AA’s dominance depends on how many
other AA traders are in the market; and, in aggregate,
AA is routinely outperformed by ZIP and by SHVR.
2.2 On Laboratory Models of Markets
Smith’s early experiments were laboratory models of
so called open-outcry trading pits, a common sight in
any real financial exchange before the arrival of
electronic trader-terminals in the 1970s. In a trading
pit, human traders huddle together and shout out their
bids and offers, and also announce their willingness to
accept a counterparty’s most recent shout. It’s a chaotic
scene, now largely consigned to the history books. In
the closing quarter of the 20
th
Century, traders moved
en masse to interacting with each other instead via
electronic means: traders “shouted” their offer or bids
or acceptances by typing orders on keyboards and then
sending those orders to a central server that would
display an aggregate summary of all orders currently
“shouted” onto the market. That aggregate summary is
very often in the form of a Limit Order Book or LOB:
the LOB shows a summary of all bids and offers
currently live in the market. At its simplest, the LOB is
a table of numbers, divided into the bid side and the ask
side (also known as the offer side). Both sides of the
LOB show the best price at the top, with less good
prices arranged below in numeric order of price: for the
bid side this means the highest-priced bid at the top
with the remaining bid prices displayed in descending
order below; and for the ask side the lowest-priced
offer is at the top, with the remaining offers arranged
in ascending order below. The arithmetic mean of the
best bid and best ask prices is known as the mid-price,
and their difference is the spread. For each side of the
LOB, at each price on the LOB, the quantity available
on that side at that price is also indicated, but with no
indication of who the relevant orders came from: in this
sense the LOB serves not only to aggregate all
currently live orders, but also to anonymize them.
Traders in LOB-based markets can usually cancel
existing orders to delete them from the LOB. In a
common simple implementation of a LOB, traders can
accept the current best bid or best offer by issuing a
quote that crosses the spread: i.e., by issuing an order
that, if added to the LOB, would result in the best bid
being at a higher price than the best ask. Rather than be
added to the LOB, if a bid order crosses the spread then
it is matched with the best offer on the ask side (known
as lifting the ask), whereas an ask that crosses the
spread is matched with the best bid (hitting the bid);
and in either case a transaction then occurs between the
trader that had posted the best price on the relevant side
of the LOB, and the trader that crossed the spread. The
price of the resulting transaction is whatever price was
hit or lifted from the top of the LOB.
Smith’s earliest experiments pre-dated the arrival
of electronic trading in real financial markets, and so
they can be thought of as laboratory models of open-
outcry trading pits. Even though the much later work
by Gode and Sunder, Cliff, Gjerstad and Dickhaut, and
Vytelingum all came long after the introduction of
electronic LOBs in real markets, these academic
studies all stuck with Smith’s original methodology, of
modelling open-outcry markets (often by essentially
operating a LOB with the depth fixed at 1, so the only
information available to traders is the current best, or
Exhaustive Testing of Trader-agents in Realistically Dynamic Continuous Double Auction Markets: AA Does Not Dominate
227

most recent, bid and ask prices).
Nevertheless, the studies by IBM researchers (Das
et al., 2001; Tesauro and Das, 2001; Tesauro and
Bredin 2012), and also the replication and confirmation
of AA results by De Luca and Cliff (2011a, 2011b) and
by Stotter et al. (2013), all used LOB-based market
simulators. The IBM simulator Magenta seems to have
been proprietary to IBM; developed at TJ Watson Labs
and not available for third-party use. But De Luca
made an open-source release of his OpEx simulator
(De Luca, 2015) which was subsequently used by Vach
(2015) in the studies that prompted our work reported
here. Also of relevance here is the ExPo simulator
described by Stotter et al. (2014): in the work by De
Luca, by Vach, and by Stotter et al., Vytelingum’s
original AA needed modifications to make it work in a
LOB-based market environment: this is discussed
further in Section 3.
In the work reported here we used neither OpEx nor
ExPo, but instead BSE (BSE, 2012; Cliff, 2018) which
is another open-source ExpEcon market simulator,
initially developed as a teaching aid but subsequently
used as a platform for research (see, e.g. le Calvez and
Cliff, 2018). BSE has the advantage of being relatively
lightweight (a single Python script of c.2500 lines) and
hence readily deployable over large numbers of virtual
machines in the cloud. BSE maintains a dynamically
updated LOB and also publishes a tape, a time-ordered
record of all orders that have been executed. It comes
with pre-defined versions of ZIC and ZIP, and also
some additionally minimally-simple non-adaptive
trading strategies that can be used for benchmarking
against other more complex strategies added by the
user. One of these, the Shaver strategy (referred to in
BSE by the “ticker symbol” SHVR) simply reads the
best prices on the LOB and, if it is able to do so without
risking a loss-making deal then it issues an order that
improves the current best bid or best ask by one
penny/cent.
2.3 Eight Key Papers, One
Methodology
2.3.1 Smith 1962
Smith’s 1962 JPE paper is widely regarded as the first
published study in ExpEcon. In it he reported on
experiments in which groups of human subjects were
randomly assigned to be either buyers or sellers.
Buyers were given a supply of artificial money, and
sellers were given one or more identical items, of no
intrinsic value, to sell. Each trader in the market was
assigned a private valuation, a secret limit price: for a
buyer this was the price above which he or she should
not pay when purchasing an item; for a seller this was
the price below which he or she should not sell an item.
These limit-price assignments model the client orders
executed by sales traders in real financial markets;
we’ll refer to them just as assignments in the rest of this
paper. After the allocation of assignments to all
subjects, they then interacted via an open-outcry CDA
while Smith and his assistants made notes on the
sequence of events that unfolded during the
experiment: typically, buyers would gradually increase
their bid-prices, and sellers would gradually lower their
offer-prices (also known as ask-prices) until
transactions started to occur. Eventually, typically after
5 or 10 minutes, the experimental market reached a
position in which no more trades could take place,
which marked the end of a trading period or “trading
day” in the experiment; any one experiment typically
ran for n=5-10 periods, with all the traders being
resupplied with money and items-for-sale at the start of
each trading period. The sequence of n contiguous
trading periods (or an equivalently long single-period
experiment with continuous replenishment, as
discussed in Section 5.1) is referred to here as one
market session. Smith could induce specific supply and
demand curves in these experimental markets by
appropriate choices of the various limit-prices he
assigned to the traders. As any high-school student of
microeconomics knows, the market’s theoretical
equilibrium price (denoted hereafter by P
0
) is given by
the point where the supply curve and the demand curve
intersect. Smith found that, in these laboratory CDA
markets populated with only remarkably small groups
of human traders, transaction prices could reliably and
rapidly converge on the theoretical P
0
value despite the
fact that each human trader was acting purely out of
self-interest and knew only the limit price that he or she
had been assigned. Smith’s analysis of his results
focused on a statistic that he referred to as
, the root
mean square (RMS) deviation of actual transaction
prices from the P
0
value over the course of an
experiment. In his early experiments, P
0
was fixed for
the duration of any one experiment; in later work Smith
explored the ability of the market to respond to “price
shocks” where, in an experiment of N trading days, on
a specific day S<N the allocation of limit prices would
be changed, altering P
0
from the value that had been in
place over trading periods 1, 2, …, S, to a different
value of P
0
that would then remain constant for the rest
of the experiment, i.e. in trading periods S+1, S+2, …,
N. For brevity, in the rest of this paper Smith’s style of
experiments will be referred to as S’62 experiments.
ICAART 2019 - 11th International Conference on Agents and Artificial Intelligence
228

2.3.2 ZIC: Gode and Sunder 1993
Gode and Sunder’s 1993 JPE paper used the S’62
methodology, albeit with the CDA markets being
electronic (a move Smith himself had made in his
experiments many years earlier), so each trader was sat
at a personal terminal, a computer screen and
keyboard, from which they received all information
about the market and via which they announced their
orders, their bids or offers, to the rest of the traders in
the experiment. Gode and Sunder first conducted a set
of experiments in which all the traders were human, to
establish baseline statistics. Then, all the human traders
were replaced with automated trading systems,
absolute-zero minimally-simple algo traders which
Gode and Sunder referred to as Zero Intelligence (ZI)
traders. Gode and Sunder studied markets populated
with two type of ZI trader: ZI-Unconstrained (ZIU),
which simply generated random prices for their bids or
offers, regardless of whether those prices would lead to
profitable transactions or to losses; and ZI-Constrained
(ZIC), which also generated random order prices but
were constrained by their private limit prices to never
announce prices that would lead them to loss-making
deals. Gode and Sunder used fixed supply and demand
schedules in each experiment, i.e. there were no price-
shocks in their experiments.
Not surprisingly, the market dynamics of ZIU
traders were nothing more than noise. But the
surprising result in Gode and Sunder’s paper was the
revelation that a commonly used metric of market price
dynamics known as allocative efficiency (AE,
hereafter) was essentially indistinguishable between
the human markets and the ZIC markets. Because AE
had previously been seen as a marker of the degree to
which the traders in a market were behaving
intelligently, the fact that ZIC traders scored AE values
largely the same as humans was a shock. Gode and
Sunder proposed that a different metric should instead
be used as a marker of the intelligence of traders in the
market. This metric was profit dispersion (PD,
hereafter) which measures the difference between the
profit each trader accrued in an experiment, compared
to the profit that would be expected for that trader if
every transaction in the market had taken place at the
market’s theoretical equilibrium price P
0
: humans
typically showed very low values of PD (which is
assumed to be good) while ZIC traders did not. On this
basis, Gode and Sunder argued that PD should be used
in preference to AE.
2.3.3 Zip: Cliff 1997
Taking direct inspiration from both Smith’s work and
from the ZI paper by Gode and Sunder, Cliff (1997)
developed a ZI trading strategy that used simple
machine-learning techniques to continuously adapt the
randomly-generated prices quoted by the traders: this
strategy, known as ZI-Plus (ZIP) was demonstrated to
show human-like market dynamics in experiments
with flat supply and/or demand curves: Cliff also
showed theoretical analyses and empirical results
which demonstrated that transaction prices in markets
populated only by ZIC traders would not converge to
the theoretical equilibrium price when the supply
and/or demand curves are flat (or, in the language of
microeconomics, “perfectly elastic”). ExpEcon studies
in which the supply and/or demand curve was flat had
previously been reported by Smith and others, but
Gode and Sunder had not explored the response of their
ZIC traders to this style of market. Cliff’s work
involved no human traders: all the focus was on
markets populated entirely by autonomous agents, by
ZIP traders. In total Cliff (1997) reported on fewer than
1,000 simulated market sessions. The focus on
homogenous markets can fairly be interpreted as
continuing the tradition established by Gode and
Sunder (who studied markets homogeneously
populated with either human, ZIU, or ZIC traders) and
by Smith (who studied all-human markets). In all other
regards Cliff continued the S’62 tradition: key metrics
were Smith’s
AE, and PD.
2.3.4 GD: Gjerstad and Dickhaut 1997
Gjerstad’s PhD studies of price formation in CDA
markets (Gjerstad and Dickhaut, 1998) also involved
creating an algorithm that could trade profitably by
adapting its behavior over time, in response to market
events. In contrast to the ZI work, Gjerstad’s trading
algorithm uses frequentist statistics, gradually
constructing and refining a belief function that
estimates the likelihood for a bid or offer to be accepted
in the market at any particular time, mapping from
price of the order to its probability of success. Gjerstad
did not explicitly name his strategy, but it has since
become known as the GD strategy. In all other regards,
as with Cliff (1997) and Gode and Sunder (1993),
Gjerstad’s work was firmly in the S’62 tradition:
homogenous markets of GD traders interacting in a
CDA, buying and selling single items, with the metrics
being Smith’s
AE, and PD.
2.3.5 MGD: IBM 2001
In their landmark 2001 IJCAI paper, IBM researchers
Das, Hanson, Kephart, and Tesauro studied the
performance of GD and ZIP in a series of ExpEcon
market experiments where, for the first time ever in the
same market, some of the traders were robots while
Exhaustive Testing of Trader-agents in Realistically Dynamic Continuous Double Auction Markets: AA Does Not Dominate
229

others were human (recall that the earlier work of
Smith, of Gode and Sunder, of Cliff, and of Gjerstad
and Dickhaut had all studied homogeneous markets:
either all-human or all-robot). Das et al. used a LOB-
based market simulator called Magenta, developed by
Gjerstad, and ran a total of six experiments, six market
sessions, in which humans and robots interacted and
where there were three shock-changes to P
0
, i.e. four
phases in any one experiment, each phase with a
different P
0
value that was held static over that phase.
The surprising result in this paper was that robot
trading strategies could consistently outperform human
traders, by significant margins: a result that attracted
worldwide media attention. Both GD and ZIP
outperformed human traders, and in the six
experiments reported by Das et al. the results from the
two robot strategies are so similar as to not obviously
be statistically significant. A subsequent paper by
IBM’s Tesauro and Das (2001), reported on additional
studies in which a Modified GD (MGD) strategy was
exhibited what the authors described in the abstract of
their paper as “…the strongest known performance of
any published bidding strategy”.
2.3.6 GDX: Tesauro and Bredin 2002
Extensions to MGD were reported by IBM researchers
Tesauro and Bredin (2002) at AAMAS 2002. This
described extensions to MGD, using dynamic
programming methods: this version was named GDX
and its performance was evaluated when competing in
heterogenous markets with ZIP and other strategies.
Tesauro and Bredin reported that GDX outperformed
the other strategies and claimed in the abstract of their
paper that GDX “...may offer the best performance of
any published CDA bidding strategy.”
2.3.7 AA: Vytelingum 2006
Vytelingum developed AA and documented it in full
in his PhD thesis (2006) and in a major paper in the AIJ
(Vytelingum et al., 2008). The internal mechanisms of
AA are described in greater detail in Section 3 of this
paper. Although Vytelingum’s work came a few years
after the IBM publications reviewed in Sections 2.3.5
and 2.3.6, the discussion within Vytelingum’s
publications is phrased very much in terms of the S’62
methodology: the P
0
value in his AA experiments was
either fixed for the duration of each market session, or
was subjected to a single “price shock” partway
through the session (as described in Section 2.3.1); and
again the primary metrics studied are Smith’s , AE,
and PD. Vytelingum presented results from
heterogeneous market experiments where AA, GDX,
and ZIP traders were in competition, and the published
results indicated that AA outperformed both GDX and
ZIP by small margins. In total, results from c.25,000
market sessions are presented in (Vytelingum et al.,
2008).
2.3.8 AA Dominates: De Luca and Cliff 2011
As part of the research leading to his 2015 PhD thesis,
De Luca used his LOB-based OpEx market simulator
system (De Luca, 2012) to study the performance of
AA in heterogeneous market experiments where some
of the traders were AA, some were other robot
strategies such as ZIP, and some were human traders
sat at terminals interacting with the other traders
(human and robot) in the market via the OpEx GUI, in
the style introduced by the IBM team in their IJCAI
2001 paper. De Luca and Cliff (2011a) had previously
published results from comparing GDX and AA in
OpEx, at ICAART-2011, and the first results from AA
in human-agent studies were then published in a 2011
IJCAI paper (De Luca and Cliff, 2011b), in which AA
was demonstrated to dominate not only humans but
also GDX and ZIP. For consistency with what was by
then a well-established methodology, in De Luca’s
experiments the P
0
value was static for sustained
periods with occasional “shock” step-changes to
different values. Continuing the tradition established
by the IBM authors, the abstract of (De Luca and Cliff
2011b) claimed supremacy for AA: “We…
demonstrate that AA’s performance against human
traders is superior to that of ZIP, GD, and GDX. We
therefore claim that… AA may offer the best
performance of any published bidding strategy”.
And, until the publication of Vach (2015), that claim
appeared to be plausibly true.
3 MAA: MODIFIED AA
Taking the AA algorithm and attempting to run it in a
LOB-based market reveals the extent to which AA
seems designed to fit very well in the Smith’62 style of
experiments with periodic replenishment, and is less
well suited to a continuously varying market dynamic.
In brief, AA’s internal mechanisms revolve around
three questions that each AA trader attempts to answer:
(1) What is my best estimate of the current equilibrium
price P
0
? (2) What is my best estimate of the current
volatility of transaction prices around P
0
? And (3) is
the limit price on my current assignment intramarginal
(i.e., could be sold/bought at P
0
and still make a profit)
or extramarginal? For its estimate of P
0
, the original
AA trader computes a moving average of recent
transaction prices. For its volatility estimate, it
ICAART 2019 - 11th International Conference on Agents and Artificial Intelligence
230

computes Smith’s metric, taking the difference
between recent transaction prices and the trader’s
current estimate of P
0
(i.e., ignoring any trend in P
0
,
which is safe to do if, as in the S’62 experiments, P
0
changes rarely or never). Deciding on whether the
current assignment is intra/extra marginal is done by
comparing its limit price to its P
0
estimate.
In MAA, our modified implementation of AA,
these questions can instead each be answered by
reference to information that is routinely available
from an exchange: the LOB and the exchange’s “tape”
(the record of timestamped transactions). P
0
can be
better estimated by using the volume-weighted mid-
price at the top of the book (known as the microprice):
this is a better metric because it can be sensitive to
shifts in the P
0
value before any transactions go
through that reflect the shift. Volatility can be
estimated by reference not to only the current estimate
of P
0
but also to BSE’s tape data: a time-series of
transaction-price values correlated with a time series of
microprice values is better to use in situations where
the P
0
value is continuously changing: for each
transaction on the tape, the microprice at the time of
that transaction (or immediately before) is the better
reference value for calculating Smith’s Extra-/intra-
marginality is still decided by reference to the trader’s
P
0
estimate, but in MAA that estimate can come from
the microprice.
Previous authors have also needed to adapt AA for
LOB-based markets: De Luca (2011a, 2011b, 2015)
and Vach (2015) each used AA in the OpEx simulator,
and Stotter et al. (2013) used AA in the ExPo
simulator. However, the modified AA proposed here is
novel insofar as prior authors don’t report using the
exchange’s tape data or the microprice.
There is a tension between modifiying AA in an
attempt to better fit it to a LOB-based market, and
making claims about AA’s poor performance in those
markets: the more heavily AA is modified, the more
one is open to accusations that the modifications
themselves are the cause of the poor performance,
rather than that poor performance being a reflection of
the original AA being badly-suited to LOB markets.
For that reason, in this paper, we keep AA very close
to the original, using only the microprice modification
in generating the results presented here.
4 EVALUATION METHODS
Having modified AA to run in the more realistic CDA
market scenarios provided by BSE, we evaluated its
performance, measured as average profitability per
trader, when tested against other trading strategies
under a variety of supply and demand schedules, in
markets of varying population sizes; and, for any one
population size, testing across an exhaustive sequence
of strategy-ratios (described in Section 4.1). In the
experiments reported here, we chose to test AA against
three other strategies: Gode and Sunder’s (1993) ZIC
(see Section 2.3.2); Cliff’s (1997) ZIP (Section 2.3.3);
and the BSE built-in strategy SHVR (Section 2.2). ZIC
serves as a lower-limit non-adaptive baseline strategy,
albeit one that ignores all information available on the
LOB; SHVR as a minimally simple non-adaptive
strategy that does actually use LOB data; and ZIP, also
pre-coded into BSE, was argued by Vytelingum to be
outperformed by AA; and was argued by Tesauro and
Bredin to be outperformed by GDX: so if AA cannot
do better than ZIP in a specific type of experiment then
it presumably also cannot do better than GDX.
For brevity, the only metric that we discuss here for
any given strategy, for any one trial or for aggregate
results of multiple trials, is the average profit per trader
(APPT) calculated across all traders playing that
particular strategy, and the associated stddev.
4.1 Varying Trader-Strategy Ratios
The results published by Vach (2015) demonstrated
that the measured performance of AA in a
heterogeneous market (i.e. a market populated by
trading agents with a variety of trading strategies)
could be heavily dependent on the ratios of the various
strategies active in the market. To control for this, in
the experiments reported here we evaluate the
performance of trading strategies by calculating
summary statistics that aggregate over a large number
of trials for any given ratio of the various trading
strategies in the market: let T represent the number of
trials we perform for any one ratio of trading strategies,
and let S represent the number of different strategies
we are testing in an experiment. We systematically and
exhaustively vary the ratios of the different trading
strategies in the market for a given total number of
traders in the market, which we refer to as the
population size P, which in turn is determined by the
number NEqR of traders running each strategy when
the ratio is equal across all strategies, such that
P=2·S·NEqR. This is best illustrated with an example:
in Section 5 we report on experiments with MAA,
SHVR, ZIC, and ZIP, so S=4. Then let R denote the
ratio between the different trader types, such that R =
MAA:SHVR:ZIC:ZIP.
If we set NEqR to 3, that means when the ratio R is
equal, it will be 3:3:3:3 on the buyer side (and 3:3:3:3
on the seller side), so there will be S·NEqR=3x4=12
traders on each side, so P=24. When we say that we are
Exhaustive Testing of Trader-agents in Realistically Dynamic Continuous Double Auction Markets: AA Does Not Dominate
231

exhaustively varying the ratios, this means that for any
given number of buyer or seller traders P/2, we test all
possible ratios for that given P/2, sweeping the counts
of each trader-type in R through all valid nonnegative
integers. Taking again the P=24 example from our
experiments in Section 5, this means starting with
R=0:0:0:12 on each side of the market, running T trials
(independent market sessions) at that ratio, then
running T trials at R=0:0:1:11, a further T at
R=0:0:2:10, and so on systematically adjusting all
counts in the ratio, through the equal-ration case of
R=3:3:3:3 and on to the final ratio of R=12:0:0:0. The
combinatorics are quite explosive: for any particular
values of S and NEqR, total number of different viable
ratios R is given by:
R = (S·NEqR + S – 1)! / ((S·NEqR)! · (S-1)!)
Hence the total number of market sessions that need to
be run for any one value of NEqR is R·T. This gets quite
big, quite fast: e.g., with S=4, NEqR=4, and T=100, we
have R·T=96,900. And to rigorously explore
population-size effects we sweep NEqR through a
range of values.
4.2 Varying Supply/Demand Schedules
The review in Section 2.3 demonstrated that typically
the supply and demand schedules induced by the
experimenter (via the choice of limit prices in the
traders’ assignments) are such that the equilibrium
price P
0
is either constant for the duration of the
experiment, or undergoes one or more step-changes,
(price shocks) in the course of the experiment, jumping
from one constant value to another. Much of the work
reviewed in Section 2.3 also involves periodic
replenishment of all traders’ assignments, dividing the
experiment into a number of trading “periods”. While
this style of experiment design will certainly have been
most convenient for Vernon Smith when he was
running his early experiments, entirely manually, in the
late 1950s and 1960s, once everything is under
computer control it seems a curious thing way to
organise things, especially given the observation that
almost every real-world market of interest is quite
clearly not fixed at a constant equilibrium price,
undergoes step-changes in P
0
only very rarely (if at all)
and that in the course of a trading day for any
reasonably liquid tradeable asset the flow of orders
(i.e., trader assignments) into the market is not neatly
periodic but instead is best modelled as a stochastic
process, with random interarrival times.
Fortunately, BSE offers the experimenter a lot of
control over the supply and demand schedules (SDSs)
used in any one experiment. Traditional ExpEcon
constant-P
0
SDSs can easily be specified in BSE, with
or without step changes so that P
0
jumps from one
constant value to another, but BSE also allows for
constantly-varying SDSs to be specified, driven by
closed-form functions or by look-up tables (LUTs)
which each specify an offset value, denoted P
0
+
(t) that
is added to P
0
at time t during the experiment. To study
the response of MAA to continuously-varying P
0
, we
used LUTs of real-world financial-asset intra-day time-
series drawn from a range of asset classes, as described
in Section 5.2: in these experiments the supply and
demand curves were totally flat, with all supply-curve
limit prices P
S
=P
0
+
(t) + $0.95 and all demand-curve
prices P
S
=P
0
+
(t) + $1.05. In contrast, in the S’62
experiments reported in Section 5.1, the SDSs were
constant (P
0
+
(t)=0 for all time) and symmetric over the
range $0.10 to $1.90.
5 RESULTS
5.1 Experiments in the Style of
Smith’62
Our first set of S’62 experiments explores the
profitability of MAA, SHVR, ZIC, and ZIP in market
experiments run within BSE but modelled as closely
as possible on Smith’s original experiments:
individual traders are either buyers or sellers; trading
happens in discrete periods (“days”), with all traders’
assignments of buy and sell orders being
simultaneously replenished at the start of each period.
The SDS are such that the underlying equilibrium
price P
0
is held fixed for the duration of the
experiment, or is subjected to one or more step-
change “price shocks” which always occur at the start
of a trading period. Figure 1 shows a comparison of
the results, expressed as average profit per trader
(APPT) from markets populated by a mix of MAA
and ZIP traders, in ratios varying from roughly
5%:95% through 50%:50% to 95%:5%.
This is exactly the kind of comparison that is
usually reported in the trading-agent literature. From
Figure 1 it is clear that, for both MAA and ZIP, when
either strategy is in the minority (<50% of the traders
in the population), the profit scores are roughly the
same; but as the proportion increases beyond 50%,
MAA’s profit scores are significantly better than
those of ZIP. The data in Figure 1 should cause no
surprises to anyone familiar with the literature
surveyed in Section 2.3: this is confirmation that
MAA can outperform ZIP, which is to be expected
from the results and analysis previously published by
Vytelingum and by De Luca and Cliff. AA’s
ICAART 2019 - 11th International Conference on Agents and Artificial Intelligence
232
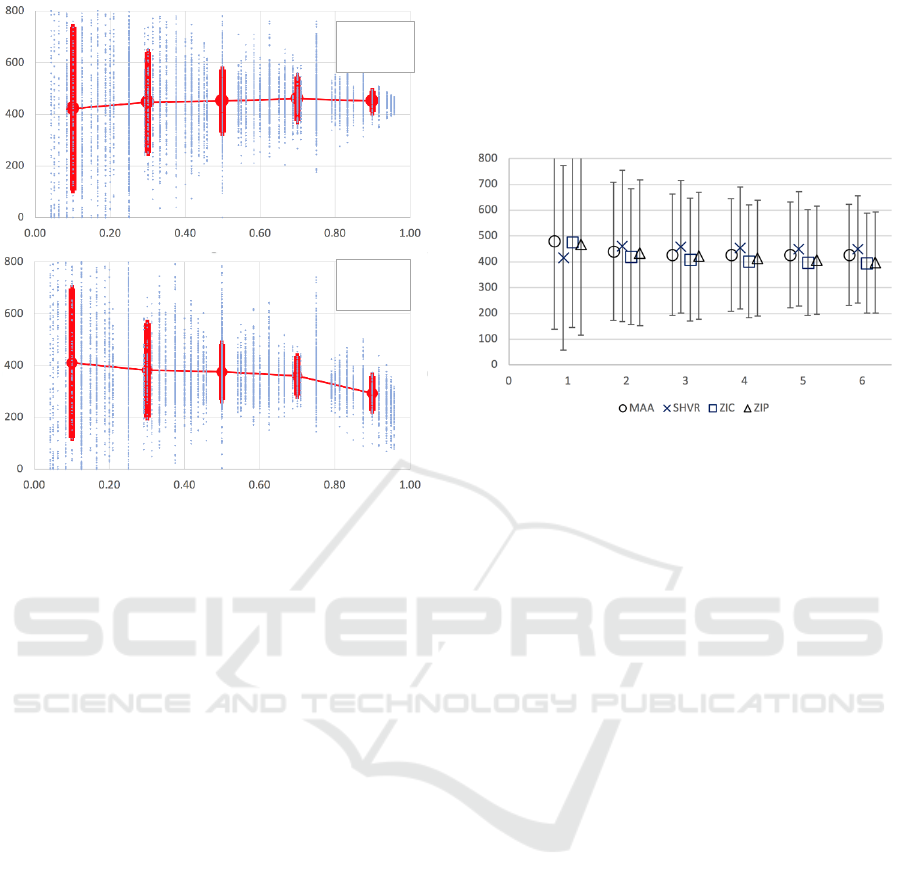
Figure 1: Results from 7,800 separate S’62 market sessions
pitting some number of MAA traders against some number
of ZIP traders, in markets where the total number of traders
varies from 8 (4 buyers + 4 sellers) to 48 (24+24). Upper
graph is MAA results; lower graph is ZIP. Horizontal axis
is percentage of that strategy within the population; vertical
axis is average profit per trader (APPT). Small blue markers
are results from individual market sessions; large solid-red
markers show the mean, with error bars to plus and minus
one standard deviation, for quintile bins (i.e., 0-20%, 20%-
40%, etc). For both strategies, when in the minority the
results are broadly similar, but when MAA is in the majority
it scores significantly higher profit than MAA.
dominance is clearest when it is trading in markets
where most other traders are also using the MAA
strategy. Thus far though, the king retains the crown.
While Figure 1 shows the effect of varying the
proportion of two trading strategies in a two-trader
market, summarising results from 7,800 separate
market sessions, the number of different situations
studied there is very small in comparison to the space
of all viable ratios across some reasonable range of
population sizes. Figure 2 illustrates aggregate
statistics from 546,000 market sessions that
exhaustively explore that whole space. Here the ratios
of four strategies are systematically varied over all
viable values (so this includes the data shown in Figure
1, where the MAA:SHVR:ZIC:ZIP ratio R was
restricted to match n:0:0:m). Figure 2 shows APPT for
the four trading strategies plotted as NEqR varies over
the range [1,6] (i.e., total number of traders in the range
[8, 48]), with T=100 at each ratio.
It is clear from Figure 2 that as NEqR increases
there is a slight reduction in variance; and although the
mean values of the four trader types differ, these
differences are tiny in comparison to the standard
deviations: when measured by APPT there are no
major differences when the whole space is sampled.
Figure 2: Results from 546,000 separate S’62 market
sessions with periodic replenishment of traders’
assignments. Horizontal axis is NEqR values; vertical axis
is APPT, with error bars at plus and minus one standard
deviation. The explosive combinatorics of the exhaustive
sweep through all combinations of ratios of the four trader
types for any specific value of NEqR means that the number
n of discrete experiments summarised by each marker on
the graph for NEqR=1,2,…,6 are respectively: n=2,000;
12,000; 36,400; 81,600; 154,000; and 260,000.
This may seem like a counterintuitive result: in these
experiments the zero-intelligence ZIC and SHVR are
scoring just as well as MAA and ZIP. It can be
explained by reference to three factors: choice of
metric; heterogenous trader populations; and
experiment design. On the choice of metric: if we had
reported the traditional metrics of Smith’s or PD, the
differences between strategies would have been more
clear; transaction prices in markets populated by ZIC
and SHVR do show increased (i.e., RMS deviation
of transaction prices from the theoretical P
0
value) and
PD (i.e., differences between actual profit accrued, and
profit expected if all transactions took place at the P
0
price), but as was argued above, the bottom line in a
real-world trading environment is actual profit. On the
heterogeneity of the trading population: in almost all of
the market sessions summarised in Figure 1, the
“dumb” traders playing the SHVR strategy can, in
essence, get a free-ride from the AI/ML in MAA and
ZIP: as traders playing those “intelligent” strategies
post prices, SHVR traders can parasitically jump one
cent better, immediately posting a better price,
positioning themselves at the top of the LOB. On the
experiment design, this classic SDS where the P
0
is
static for the entire experiment does not exactly
provide the most taxing environment in which to trade;
MAA
ZIP
Exhaustive Testing of Trader-agents in Realistically Dynamic Continuous Double Auction Markets: AA Does Not Dominate
233

Table 1: Results table for S’62 experiments with periodic
(upper sub-table: PR) and continuous (lower sub-table: CR)
replenishment of trader assignments for NEqR=1…5. Each
sub-table shows the sample mean
and standard deviation
of the APPT scores for the four strategies. The
values
of the four strategies are so tightly clustered, relative to the
values, that the differences between the
values are of no
consequence. The column N is the total number of separate
market sessions run for that sub-table.
in the rest of this paper we test the strategies in more
challenging environments, and the differences in their
performance come much more starkly into view. Our
second set of S’62 experiments uses the same SDS as
our first, but we switch from periodically updating all
trader’s assignments at the same time, at the start of
each trading period or “day”, and instead have
assignments made continuously, arriving at random
during the course of the experiment which has the same
overall duration but is no longer sensibly spoken about
as being divided into distinct periods. To save space,
we will move from graphical presentation of results to
tabular. Table 1 presents the numeric values shown
graphically in Figure 2 from our periodic-
replenishment (PR) experiment, along with the
corresponding values from the same experiment, same
SDS, run with continuous-replenishment (CR). As can
be seen, the move to CR (which is much closer to real-
world markets) has no impact on the rank-ordering of
the strategies.
5.2 Real-World-Dynamics Experiments
To explore whether AA dominates in more realistic
environments, a set of experiments were run where
the market’s underlying equilibrium price was varied
dynamically using an appropriate P
0
+
(t) function with
the SDS, as described in Section 4.2.
A first set of experiments, involving 858,000
simulated market sessions, was run where P
0
+
(t) was
generated from a closed-form sinusoidal function.
Results from these experiments (not presented here,
due to space constraints) indicated that MAA did not
do well in such circumstances, but were open to the
criticism that the P
0
+
(t) functions involved were too
artificial, too unlike real-world dynamics. For that
reason, a second set of 1,716,000 experiments were
run, referred to here as Real-World Dynamics (RWD).
In the RWD experiments, P
0
+
(t) was determined by a
LUT of intra-day price movements of a specific real
financial asset on a particular date. In an attempt at
mitigating any biases in the dynamics of a particular
asset class, we ran sets of RWD experiments using
intra-day price data from six different classes of asset:
an equity; a foreign-exchange (FX) currency-pair; a
government bond; a metal; a commodity; and an
aggregate index. In any one RWD experiment the
intra-day price time-series at one-minute resolution for
a specific asset on a specific date was read into BSE
and then normalised on the time and price axes to give
a LUT that could return a P
0
+
value at any point in the
duration of the experiment, with prices in the range [0,
80] for ease of comparison across the six different asset
classes.
In the results shown here, the RWD-Equity
experiment uses prices of IBM stock on 08/31/17;
RWD-FX uses price data for GBP-USD (i.e., “Cable”)
on 09/11/17; RWD-Bond uses prices of the US
Government 10yr Treasury Note on 09/12/17; RWD-
Metal uses data for Copper on 09/12/17; RWD-
Commodity uses spot Brent Crude Oil on 15/29/18;
and RWD-Index uses NASDAQ on 09/13/17. In each
case, 1-minute intraday price data was taken from the
free samples available at the website of
BacktestMarket.com; the date chosen for use in each
asset class is simply the first date available in the
BacktestMarket sample data, and hence is arbitrary.
For each asset-class of RWD experiment we ran an
exhaustive sweep where NEqR values were varied over
the range [1,5] (i.e., markets with P=8, 16, 24, 32, and
40 traders, always 50% buyers and 50% sellers), where
for each NEqR value all possible ratios R of trading
strategies were tested, and where for any specific
(NEqR, R) combination we executed T=100
independent simulated market sessions. This required
a total of 1,716,000 market simulations across the six
asset classes.
Figure 3 shows summary data from these
experiments: as is clear, MAA is again the 3
rd
-ranked
strategy, and again it performs significantly worse than
either SHVR or ZIP. After viewing these results, there
is no reasonable way that MAA can continue to be
seriously considered as the best-performing published
strategy.
6 DISCUSSION AND
CONCLUSIONS
The results in Figure 1 and Table 1 confirm what
anyone familiar with the CDA trading-agent literature
would reasonably claim to already know: AA, when
appropriately modified to work in a LOB-based
ICAART 2019 - 11th International Conference on Agents and Artificial Intelligence
234
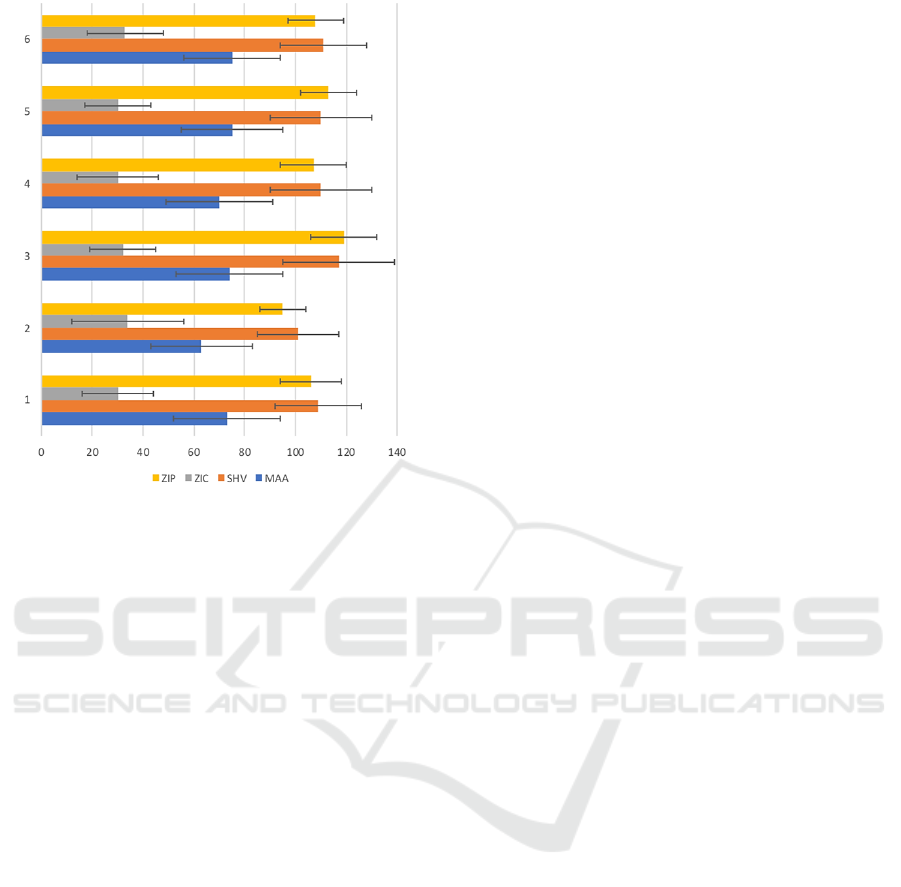
Figure 3: Summary of results from RWD experiments
across six asset classes: this chart summarises results from
1,716,000 separate market sessions. Horizontal axis is
average profit per trader (APPT). Results are grouped by
asset-class, with group-numbers on the vertical axis. Group
1 (at bottom) are from bond-price experiments; Group 2 are
from commodity-price; Group 3 from equity-price; Group
4 from metal-price; Group 5 from FX prices; and Group 6
from index prices. Bars show mean APPT with error-bars
indicating plus and minus one standard deviation.
CDA, and when tested in the kind of simple market
environment as has traditionally been used in the
literature, scores just as well as well-known other
trading strategies and is not dominated by them.
But the results in Figure 3 blow a major hole in the
status quo: merely by altering the nature of the market
environment to have continuous stochastic
replenishment (which is surely what happens in real
markets) and to have the equilibrium price P
0
continuously varying over time (which is also surely
what happens in real markets), the results we get from
MAA are very poor indeed. On the basis of these
results, it is manifestly no longer correct to claim that
AA/MAA is the best-performing trading strategy
known in the published literature. How well the
previous title-holder, i.e. GDX, fares in RWD
experiments is an obvious line of further enquiry.
It seems very hard to avoid the conclusion that
AA’s success as reported in previous papers is largely
due to the extent to which its internal mechanisms are
designed to fit exactly the kind of experiment settings
first introduced by Vernon Smith: AA is very well
suited to situations in which all assignments are issued
to all traders simultaneously, and in which the
equilibrium price remains constant for sustained
periods of time, with only occasional step-change
“shocks”. Real markets are not like this, and when AA
is deployed in the more realistic market setting
provided by BSE, its dominance disappears.
But surely the broader lesson here is that we should
not allow ourselves to be seduced by results from
small-scale studies in minimally simple
approximations to real-world markets. Smith
developed his experimental methods in the late 1950’s
when there were no realistic alternative ways of doing
things. Running experiments with human subjects is
laborious and slow, but experiments in electronic
markets populated entirely by robot traders can
proceed in appropriate simulators at speeds much
faster than real-time, and are “embarrassingly
parallelizable”: the experiments reported in this paper
took a couple of weeks; if I’d used more virtual
machines they could have been done in a couple of
days or even in a couple of hours.
At this point in time, 20% of our way into the 21
st
Century, surely trading-agent researchers should
collectively abandon the simple minimal test-beds that
worked well for Vernon Smith in the middle of the 20
th
Century and instead start to tolerate the minor
inconvenience of running very large numbers of trials
on reasonably accurate simulations of realistic market
situations: the methods used here should be the norm,
not the exception. The availability of open-source
public-domain exchange simulators such as BSE,
OpEx, and ExPo, coupled with readily available cheap
cloud-computing for doing the necessary processing,
means that there are now really no excuses for not
doing so.
REFERENCES
Bse, 2012. “Bristol Stock Exchange” GitHub repository at
https://github.com/davecliff/BristolStockExchange
Cliff, D. 1997. “Minimal-Intelligence Agents for
Bargaining Behaviours in Market-Based
Environments”. HP Labs Technical Report HPL-97-91.
Cliff, D. 2018. “An Open-Source Limit-Order-Book
Exchange for Teaching and Research.” Proc. IEEE
Symposium on Computational Intelligence in Financial
Engineering (CIFEr). SS-1296, pp.1853--1860.
Das, R., Hanson, J., Kephart, J., and Tesauro, G. 2001.
“Agent-Human Interactions in the Continuous Double
Auction”. Proceedings IJCAI-2001, pp.1169-1176.
De Luca, M. and Cliff, D. 2011a. “Agent-Human
Interactions in the CDA, Redux”. Proc. ICAART2011.
De Luca, M. and Cliff, D. 2011b. “Human-Agent Auction
Interactions: Adaptive-Aggressive Agents Dominate.”
Exhaustive Testing of Trader-agents in Realistically Dynamic Continuous Double Auction Markets: AA Does Not Dominate
235

Proc IJCAI-2011, pp.178-185.
De Luca, M., 2015. Adaptive Algorithmic Trading Systems.
PhD Thesis, University of Bristol, UK.
Gjerstad, S. and J. Dickhaut, J. 1998, “Price Formation in
Double Auctions”, Games and Economic Behavior.
22(1):1-29.
Gode, D. and Sunder, S. 1993. “Allocative efficiency of
markets with zero-intelligence traders”, Journal of
Political Economy, 101(1):119-137.
le Calvez, A. and Cliff, D. 2018. “Deep Learning can
Replicate Adaptive Traders in a LOB Financial
Market.” Proc. IEEE Symp. on Comp. Intelligence in
Financial Eng. (CIFEr). SS1070, pp.1876--1883.
Rodgers, K. 2016. Why Aren’t They Shouting? A Bankers
Tale of Change, Computers, and Perpetual Crisis. RH
Business Books / Cornerstone Digital.
Smith, V. 1962. “An experimental study of competitive
market behavior”, JPE 70(2):111-137.
Stotter, S., Cartlidge, J., and Cliff, D. 2013. “Exploring
assignment-adaptive (ASAD) trading agents in
financial market experiments”, Proc. ICAART, 1:77-88.
Stotter, S., Cartlidge, J., and Cliff, D. 2014. “Behavioural
investigations of financial trading agents using
Exchange Portal (ExPo).” In N. Nguyen et al. (eds),
Trans. Comput. Collective Intell. XVII. pp. 22-45.
Tesauro, G. and Das, R. 2001. “High-performance Bidding
Agents for the Continuous Double Auction”. Proc. 3rd
ACM Conf. on Electronic Commerce, pp.206-209.
Tesauro, G. and Bredin, J., 2002. “Sequential Strategic
Bidding in Auctions using Dynamic Programming”. In
Proceedings AAMAS 2002.
Vach, D. 2015. Comparison of Double Auction Bidding
Strategies for Automated Trading Agents. MSc Thesis,
Charles University in Prague. https://bit.ly/2rk1clV
Vytelingum, P. 2006. The Structure and Behaviour of the
Continuous Double Auction. PhD Thesis, University of
Southampton, UK. https://bit.ly/2Sw78nv
Vytelingum, P., Cliff, D., and Jennings, N. 2008. “Strategic
Bidding in CDAs”. Art. Intell., 172(14): 1700-1729.
ICAART 2019 - 11th International Conference on Agents and Artificial Intelligence
236
