
A Simulation based Optimization Study for Optimum Sequencing of
Precast Components Considering Supply Chain Risks
Mohamed Mamdouh Yusuf
1
, Ahmed Karam
2
and Amr B. Eltawil
1
1
Industrial Engineering and Systems Management, Egypt-Japan University of Science and Technology (E-JUST),
POBox 179, New Borg Elarab City, Alexandria 21934, Egypt
2
Mechanical Engineering Department, Faculty of Engineering at Shoubra, Benha University, 108, Cairo, Egypt
Keywords: Precast Supply Chain, Risk Management, Discrete Event Simulation, Flow Shop Sequencing, Stochastic
Optimization.
Abstract: Unquestionably, Precast Supply Chain (PSC) abounds with many risks distributed along its echelons. Despite
that there is a wide consensus among the previous studies about the negative impact of these risks on the PSC
performance, its effect on making operational decisions in precast plants such as scheduling of Precast
Components (PCs) is still ambiguous. So, this study aims at exploring and quantifying the effect of
considering PSC risks on the optimum PCs sequences. To accomplish this, different processes of the PSC
with their associated risks are modelled via a discrete event simulation model. Then, the developed simulation
model is linked with an optimizer to generate PCs sequences that achieve on-time delivery of PCs with
minimum production costs. This optimization process is conducted twice, with and without considering
supply chain risks. Interestingly, the optimum PCs sequences generated in both cases are totally different.
More importantly, the optimized PCs sequences produced without considering risks may backfire and cause
higher production and penalty costs if they are applied to a PSC exposed to risk. So, investing in making a
reliable risk management plan of the PSC not only can cushion the risks impact but also can lead to better
sequences of PCs.
1 INTRODUCTION
By virtue of their benefits, construction by using
precast components is adopted increasingly all over
the world (Sacks et al., 2004). Moreover, this
construction method is fostered to be adopted in the
near future not only in public housing but also in
infrastructure projects by many countries (Wang et
al., 2018a). Owing to the fact that the precast
construction method is an integration between
construction and manufacturing domains (Wang et
al., 2018b), risks are divided between the construction
site and the precast plant, where production managers
shoulder delivery of Precast Components (PCs)
according to contracted due dates so as not to cause
delay in installation of PCs at construction sites. To
accomplish this target, pre-caster makes some
operational decisions such as resource allocation,
inventory management and sequencing of required
PCs. However, there are risks embedded in the
different echelons of the Precast Supply Chain (PSC)
starting from material supplying and followed by
production, transportation and approval of PCs at
construction site (Wang et al., 2018b). The PSC is a
unique multi-echelon supply chain that is different
from other supply chains because the precast
production alters between push (repetitive
production) and pull (on-time delivery to construction
sites) production all the time. This makes the PSC
more susceptible to risks which cause more costly
supply chain and handicap on-time delivery of PCs,
and as a result the advantages of using the precast
construction method can be easily wiped away (Wang
et al., 2018b). So, there exists a need to understand
how PSC risks can influence the operational decisions
of the pre-casters. Sequencing of PCs is one of the
most important operational decisions in precast
plants. It aims at ordering different types of PCs on a
number of sequential operations in order to meet the
contracted due dates, and meanwhile reducing
production costs. To date, literature is riddled with
studies on sequencing of PCs; diverse issues had been
addressed in these studies such as mold planning and
leveling (Hu, 2007), available space between
330
Yusuf, M., Karam, A. and Eltawil, A.
A Simulation based Optimization Study for Optimum Sequencing of Precast Components Considering Supply Chain Risks.
DOI: 10.5220/0007373303300337
In Proceedings of the 8th International Conference on Operations Research and Enterprise Systems (ICORES 2019), pages 330-337
ISBN: 978-989-758-352-0
Copyright
c
2019 by SCITEPRESS – Science and Technology Publications, Lda. All rights reserved

production processes (Ko and Wang, 2011), multiple
production lines (Yang et al., 2016), incorporating of
mold manufacturing, storage and transportation
processes (Wang and Hu, 2017), demand fluctuations
of PCs (Wang and Hu, 2018) and considering
stochastic processing times (Wang et al., 2018a). On
the other hand, literature lacks studies that investigate
how multiple risks can impact the performance of the
PSC, which aims at on-time delivery of PCs with the
required quality at lowest cost incurred by supply
chain members (Tuncel and Alpan, 2010). (Wang et
al., 2018b) was the pioneer in meeting this need by
using discrete event simulation to evaluate the
performance of the PSC under multiple risks from
pre-casters’ perspective. Their conclusions
illuminated pre-casters to the criticality of each risk
embedded in different stages of the PSC. Despite this,
the question of whether considering risks in the PSC
can affect operational decisions such as PCs
sequencing, is yet to be answered. So, this study is
intended to provide numerical justification of the
value of considering the PSC’s risks in determination
of optimum PCs sequences in precast plants. This is
done by using a simulation optimization approach to
compare between the optimum PCs sequences
generated with and without considering risks in the
PSC. But before applying this approach, different
risks propagated through echelons of the PSC are
identified and assessed by using information from
literature. These risks are then incorporated into
different operations of the PSC in a discrete event
simulation model. Thereafter, this simulation model
is integrated with an optimization package to search
for the optimum PCs sequence which minimizes both
penalty and production costs.
The reamaining parts of this paper are organized
as follows. Section 2 is the literature review. Section
3 discusses the integration between the risk
managemnt and the PSC. The DES model of the PSC
is explained in Section 4. The developed simulation-
based optimization approach is illustrated in section
5. Results of the study are presented and discussed in
section 6. Finally, conclusions are drawn in section 7.
2 LITERATURE REVEW
Due to the fact that the production stage of PCs is at
the core of the PSC, many researchers addressed the
precast production planning by using either
mathematical modeling or Discrete Event Simulation
(DES). Regarding using mathematical modeling,
(Chan and Hu, 2001) was the first to indicate that the
precast production system resembled the traditional
flow shop sequencing problem where n jobs have to
be processed in the same sequence on all m machines,
and the objective is to minimize the makespan using
the appropriate order for these jobs. Despite that
literature is full of studies on flow shop sequencing
(Yenisey and Yagmahan, 2014), these studies cannot
be applied directly to the precast industry because of
the specific nature of precast production. So, (Chan
and Hu, 2001) formulated a tailored flow shop
sequencing model for precast production by
considering the realistic nature of the precast
production activities. They classified these activities
into preemptive or non-preemptive activities and
sequential or parallel activities. Their objective was
to minimize Tardiness and Earliness (T&E) penalty
costs or reduce makespan. More and more scholars
enhanced the model proposed by (Chan and Hu,
2001) by incorporating more factors. For instance,
(Ko and Wang, 2011) considered the waiting times
due to restricted buffer size between production
processes. To be closer to the realistic precast
production environment, (Yang et al., 2016)
enhanced the previous model to consider multiple
production lines as well as additional types of
production resources such as pallets and curing
machine. Despite these improvements, (Wang and
Hu, 2017) contended that addressing the precast
production problem in isolation from its supply chain
would not inevitably lead to on-time delivery of
precast components, and hence they added three
processes to the precast flow shop sequencing model.
One of them is mold manufacturing prior to
production processes, and the others are storage and
transportation to the construction sites, after
production processes. Recently, (Wang and Hu,
2018) extended their model used in (Wang and Hu,
2017) to address demand variability issue by
assignment of PCs to proper production line and
reordering of PCs. Interestingly, genetic algorithms
were a common method used in the previous studies
by virtue of its performance to tackle such
nondeterministic polynomial (NP)-hard problems.
However, academics often resort to simulation
modeling due to its superiority over mathematical
modeling to imitate complex stochastic systems
(Law, 2007), such as the PSC. To support this, (Wang
et al., 2018a) claimed to be the first to consider
stochastic processing times within PSC by using
simulation modeling to evaluate pre-optimized PCs
sequences generated in advance from mathematical
optimization. Moreover, (Wang et al., 2018b)
developed a DES model to evaluate multiple risks in
PSC. Their model was used to prioritize risks under
study based on their impact on economic and tech-
A Simulation based Optimization Study for Optimum Sequencing of Precast Components Considering Supply Chain Risks
331

nical factors. After reviewing the aforementioned
studies, it is noticed that researchers had not, as yet,
addressed precast flow shop sequencing problem
while considering multiple risks identified in the
PSC. In this work, a DES model is developed to study
the different stages of the PSC while considering the
associated risks. The simulation environment is used
to identify the optimum PCs sequences with
considering several real aspects such as the
uncertainty of PCs processing times and different
operational risks in the PSC. This simulation
optimization approach is conducted twice, with and
without considering risks in the PSC, and the
optimum PCs sequences generated in the two cases
are compared and analysed to study the effect of
considering PSC risks on the developed optimum
precast production schedules.
3 PRECAST SUUPLY CHAIN
MANAGEMENT WITH RISK
CONSIDERATIONS
This section aims at applying the risk management
procedure to the PSC management. But firstly, the
definition of PSC management should be clarified.
PSC management can be defined as the applied
techniques to link between suppliers, manufacturers,
transporters and contractors, so as to deliver PCs on
time with required quality and quantity, in a way to
reduce system costs incurred by the supply chain
members, (Simchi-Levi et al., 2000). However,
(Tuncel and Alpan, 2010) argued that overlooking of
disturbances across any supply chain can impact its
performance. Owing to this fact, contractors are used
to procure raw materials as early as possible in
traditional construction projects in order to mitigate
the consequences of supply chain uncertainties.
Unfortunately, the large sizes and heavy weights of
PCs hamper stacking them on construction sites
surrounded by urban areas, (Wang et al., 2018a). So,
integrating risk management with supply chain
management is of utmost importance for optimal PSC
management. To accomplish this integration, risks
pertained to the different parts in the PSC should be
firstly identified. Risk identification is an iterative
process that needs collaboration between different
stakeholders of the PSC. Documentation review is
one of many methods that can be used to accomplish
this process (Guide, 2001). After determination of
different risks that might impact the PSC, assessing
the identified risks is the second step in the risk
management procedure (Guide, 2001). During this
stage, many techniques can be used to assess
numerically the likelihood and impact of the
identified risks. Despite that there are many risks
associated with the different echelons of the PSC, as
documented by (Pheng and Chuan, 2001), no much
information about their probability and impact is
available in literature. Hence, only five main risks in
the PSC are considered and summarized in Table 1. It
is worth mentioning that the impact of these risks is
represented by the time delay they may impose on the
system. After risk identification and risk assessment,
the third process in the risk management procedure is
the risk response, where the risk management team
tries to reduce the probability and impact of each risk
by using different techniques such as risk aviodance,
risk mitigation, risk transfer and risk acceptance. The
risk responses mentioned in Table 1 are classified as
risk acceptance where there are no other suitable risk
responses available for the team to deal with such
risks. To sum up, Table 1 represents the output from
applying the risk identification, risk assessment and
risk response processes to the PSC. This table
identified five risks which are poor-quality materials,
machine breakdown, truck failure, poor-quality PCs
and rejection of PCs at the construction site. These
Table 1: Identified risks in PSC with its probability and impact, (Michalska and Mazurkiewicz 2011) and (Wang et al.,
2018b).
Echelons of PSC
Identified risks
Probability
Impact (hours)
Risk response
Material supplying
Low quality of
materials
22%
EXPO(15)
Reordering
materials
Precast plant
Machine breakdown
28%
EXPO(50)
Machine repairing
Logistics
Truck failure
EXPO (1000)
hrs*
Norm(2,0.71)
Truck repairing
On-site checking
Imperfections in
delivered PCs
27%
EXPO(15)
PC repairing
Rejection of PCs
after repairing
19%
Deduced from
simulation model
Reproduction of
rejected PCs
* Time between failures obeys exponential distribution.
ICORES 2019 - 8th International Conference on Operations Research and Enterprise Systems
332

risks disrupt different echelons of the PSC which are
material supplying, PC production, logistics and on-
site checking. These five risks and different
operations of the PSC will be incorporated in a
developed simulation model, as will be illustrated in
the next section.
4 DEVELOPMENT OF
SIMULATION MODEL
In this section, a DES model is developed to represent
the operations at different echelons of the PSC and its
embedded risks aforementioned in Table 1. The
developed model considers the whole supply chain of
the PCs starting from processes of material supplying
to PC inspection on-site with their related risks, as
discussed in the previous section. Figure 1 shows the
different processes at each echelon of the PSC with
their corresponding risks, starting from material-
supplying stage and ending with on-site checking of
delivered PCs. During the supplying stage, PCs
orders are registered and raw materials are solicited.
After arrival of the materials, if the precast plant
rejects the delivered materials due to their poor
quality, the production of PCs will be delayed until
inventory is replenished with another shipment of
good-quality materials. After that, the production
process can start with the identified PCs sequence.
The production process begins with mold
manufacturing, followed by mold preparation and
reinforcement setting. But before proceeding to the
casting and curing processes, there is a probability
that the machines used in these processes break down,
and as a result, the repairing activities will halt the
production process. After casting and curing
processes, PCs are extracted from molds, finished and
stored at the stockyard of the precast plant. The third
stage in the PSC is logistics, where the PCs are carried
Figure 1: Schematic of PSC with multiple risks in its echelons; (a) Material supplying, (b) Precast plant, (c) Logistics and
(d) On-site checking.
A Simulation based Optimization Study for Optimum Sequencing of Precast Components Considering Supply Chain Risks
333
to the construction sites by trucks or trailers. Delivery
of PCs to the construction sites can be delayed due to
truck failure. Eventually, PCs arrive at the
construction sites; but before hoisting them to their
final destination, the responsible site engineer
scrutinizes the delivered PCs to ensure that they are
matching with construction drawings. In case of
finding defects that cannot be overlooked, the PCs are
repaired and installed at their positions. However, if
the repaired PC is still rejected by the site engineer,
an alternative PC is ordered from the precast plant.
Finally, the incurred penalty cost and production
costs are recorded for the purpose of decision making.
The processing times of the different operations of the
PSC are taken from (Wang et al., 2018b) and
summarised in Tables 2 and 3.
Table 3: Processing times of tasks at the echelons of
material supplying and construction site.
Process
Duration (hour)
Receiving PC order
TRIA (0.05, 0.1, 0.15)
Ordering material
TRIA (0.05, 0.1, 0.15)
On-site inspection of PCs
TRIA (0.15, 0.35, 0.55)
5 THE SIMULATION-BASED
OPTIMIZATION APPROACH
The developed simulation model is integrated with an
optimization package in order to find the optimum
PCs sequences. The inputs, decision variables and
objective function are elucidated along the following
subsections.
5.1 Objective Function
Commonly, pre-casters are contemplating
minimization of production cost and penalty cost, as
reducing the first one enables them to repay financing
costs while minimizing the second one promotes their
reputation. The two objective functions are adopted
from (Wang and Hu, 2017) and (Wang et al., 2018b),
respectively. The penalty cost,
is represented
by equation (1) while the production cost,
is
represented by equation (2).
(1)
Where is the sequence of precast components;
is completion time of each job (PC) at the last
process;
is contracted due date for each job (PC) ;
and
are the tardiness and earliness penalties per
unit
= LC(s) + IC(s)
(2)
=
Where LC(s) is labor cost at sequence s; IC(s) is
inventory cost at sequence s;
and
are empirical
cost coefficients equal 3$/(labor*hour) and
12.3$/day;
is number of labours;
is time in
hours spent by precast components, ordered in a
sequence , from receiving the order to be approved
on site.
However, summing the two objectives into one
objective function may be unsuitable as the
production cost is often higher than the penalty cost,
and therefore it is expected that the production cost
will dominate the penalty cost. This situation might
lead to solutions focus only on minimizing production
costs at the expense of penalty cost. So, the two
objectives are combined into one non-dimensional
fitness function with equal weights by using a
function transformation method, mentioned in
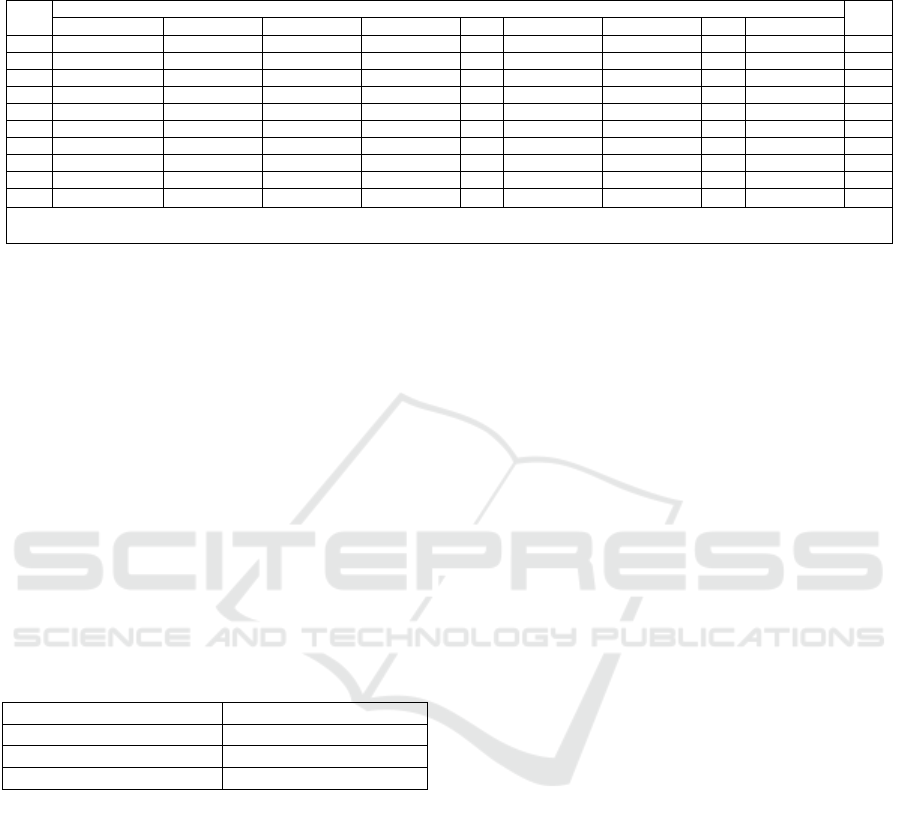
Table 2: Processing times (hours) of the production and transportation processes in the PSC, and the due date (hours)
associated with each PC type.
PC
type
Processing times of production and transportation processes (triangular distribution (Min, Mode, Max))
Due
date
M1
M2
M3
M4
M5
M6
M7
M8
M9
1
(10.2,11,11.5)
(1.3,1.5,1.7)
(1.2,2,2.5)
(0.3,0.5,0.7)
8
(0.8,1,1.2)
(0.3,0.5,0.7)
10
(1.2,1.5,1.6)
164
2
(10,11,11.8)
(0.8,1,1.2)
(1.8,2,2.5)
(0.2,0.4,0.6)
8
(0.8,1,1.2)
(0.3,0.5,0.8)
10
(1.2,1.5,1.6)
140
3
(9,10,10.5)
(0.8,1,1.2)
(1,1.5,1.8)
(0.3,0.5,0.7)
8
(0.3,0.5,0.7)
(0.3,0.5,0.7)
10
(0.8,1,1.2)
164
4
(7.8,8,8.2)
(0.2,0.5,0.8)
(0.8,1,1.2)
(0.1,0.3,0.5)
8
(0.1,0.3,0.5)
(0.3,0.5,0.7)
10
(1.2,1.5,1.6)
160
5
(3.8,4,4.5)
(0.5,1,1.2)
(0.6,0.8,1)
(0.5,1,1.2)
8
(1.2,1.5,1.7)
(0.3,0.5,0.7)
10
(1.2,1.5,1.6)
160
6
(7.5,8,8.5)
(0.3,0.5,0.7)
(1.5,2,2.2)
(0.2,0.4,0.6)
8
(0.3,0.5,0.7)
(0.3,0.5,0.7)
10
(1.2,1.5,1.6)
164
7
(4,5,5.8)
(1.3,1.5,1.7)
(1.5,2,2.2)
(0.2,0.5,0.6)
8
(0.5,1,1.2)
(0.2,0.4,0.6)
10
(0.3,0.5,0.7)
140
8
(4.8,5,5.5)
(0.3,0.5,0.7)
(1.8,2,2.5)
(0.1,0.3,0.5)
8
(0.4,0.6,0.8)
(0.2,0.3,0.5)
10
(1.2,1.5,1.6)
164
9
(7.5,8,8.2)
(1.3,1.5,1.7)
(1.6,1.8,2)
(1,1.2,1.8)
8
(1,1.5,1.8)
(1.2,1.5,1.6)
10
(0.8,1,1.2)
140
10
(3.8,4,4.5)
(0.2,0.4,0.8)
(0.2,0.5,0.7)
(0.4,0.6,0.8)
8
(0.3,0.5,0.7)
(0.2,0.5,0.7)
10
(1.5,2,2.2)
164
M1= mold manufacturing; M2 = mold assembling; M3 = placement of reinforcement; M4 = casting; M5 = curing; M6 = mold stripping; M7 =
finishing/repairing; M8 = storing; M9 = transportation.
ICORES 2019 - 8th International Conference on Operations Research and Enterprise Systems
334

(Marler and Arora, 2005). The Fitness function,
is represented by equation (3).
(3)
Where
and
are minimum or approximate
minimum values of penalty and production costs;
and
are relative weights of penalty and
production costs.
5.2 Decision Variables
The solution of the optimization procedure is the
sequence (s) of producing ten PCs. For example, 7-9-
2-5-4-10-8-6-3-1 is a PC production sequence where
the first PC to be processed is component 7; the
second one is component 9; and so forth.
Understandably, each PC may have a different
processing time at each process in the PSC, and all
jobs (PCs) have to be processed in the same operating
sequence of all machines (processes). So, it is a
typical flow shop sequencing problem.
5.3 Constraints
Any solution becomes feasible only if each PC has a
unique ordering from 1 to 10. For example, 7-9-2-5-
4-10-7-6-3-1 is an infeasible solution because
component 7 is processed twice and component 8 is
not scheduled at all. The following constraints ensure
the feasibility of the generated solutions. For instance,
if we have a number of PCs and each PC , where
, must be processed with a sequence
number , where . A binary variable
will equal one if the PC is processed in
th
order and
zero otherwise.
(4)
(5)
5.4 The Simulation Optimization
Technique
OptQuest
®
for Arena
®
is used for simulation based
optimization. OptQuest
®
is fully integrated with
Arena
®
; it utilizes scatter search, tabu search and
neural networks as search techniques. By using these
techniques, OptQuest
®
establishes a new set of
decision variables after evaluating the objective
function generated by the simulation model in a
cyclic manner until a predefined stopping criteria is
achieved (Automation, 2013).
6 RESULTS AND DISCUSSION
In this section, the aforementioned simulation
optimization approach is applied to find out whether
considering or ignoring risks in the PSC changes the
optimum PCs sequences generated from the
optimization process. For more clarification, this
approach is conducted twice, with and without
considering risks. The obtained results are discussed
and analyzed along the following sub-sections.
6.1 In Case of Considering Risks
To launch the optimization process, the number of
replications and stopping criteria have to be specified.
Regarding the number of replications, 800
replications are used to obtain solutions with avergae
half width less than 5%. It is worth mentioning that
(Wang et al., 2018b) used 1000 replications.
Secondly, the stopping criteria is determined to
terminate the optimization process when there is no
improvement in the fitness value for a consecutive
200 simulation iterations. This number of iterations is
determined after conducting some preliminary
analysis.
Finally, the optimization process is accomplished
in about 160 minutes with 250 simulation iterations
by using a laptop with Intel(R) Core(TM) i7-6500U
2.50 GHz processor, 8.00 GB of RAM and running a
Windows 10 Education 64-bit operating system. The
top near optimum PCs sequences are listed in Table 4
with their values of penalty and production costs.
Table 4: Near Optimum sequences produced when
considering risks with its penalty and production cost.
Sequence
ID (s
ri
)
PCs sequence
Penalty
cost
Production
cost
s
r1
7-9-2-5-4-10-
8-6-3-1
479.0
10594.0
s
r2
10-9-2-5-4-7-
8-6-3-1
502.2
10636.8
s
r3
2-10-9-8-7-5-
3-6-1-4
511.9
10622.2
s
r4
7-9-2-6-4-10-
5-8-3-1
509.1
10730.3
A Simulation based Optimization Study for Optimum Sequencing of Precast Components Considering Supply Chain Risks
335

6.2 In Case of Ignoring Risks
The same procedure is repeated again, but this time
after discarding the risks. Eliminating the risks in the
developed DES model is simply done by setting the
probabilities of the five risks to zero. By trial and
error, ten replications are used to ensure generating
reliable solutions with about 5 percentage avergae
half width. Eventually, the optimization process is
completed after 500 generations and it took about 15
minutes by using the same hardware mentioned in
section 6.1. The top near optimum sequences are
listed in Table 5. To explore the penalty and
production costs of these schedules, in case of
applying them to a PSC suffered from the five
identified risks. Table 6 presents the values of the
penalty and production costs of these schedules if
they are applied to the PSC without eliminating the
original risks’ probabilities mentioned in Table 1.
Table 5: Near optimum sequences resulted in case of
ignoring risks with its penalty and production cost.
Sequence
ID (s
i
)
PCs
sequence
Penalty
cost
Production
cost
s
1
1-2-9-7-8-5-
10-6-3-4
200.4
9212.5
s
2
4-2-9-7-6-5-
10-8-3-1
203.1
9212.5
s
3
3-2-9-7-8-5-
10-4-6-1
203.3
9212.5
s
4
2-6-7-9-4-5-
8-10-3-1
204.7
9212.5
Table 6: Values of penalty and production cost when
applying near optimum schedules (s
1
to s
4
) on PSC with the
associated risks.
Seque
nce ID
With considering
risks
Percentage increase
Penalty
cost
Producti
on cost
Penalty
cost
Producti
on cost
s
1
537.4
10904.7
168%
18.4%
s
2
564.9
11128.7
178%
20.8%
s
3
525.2
10847.9
158%
17.8%
s
4
598.9
11198.5
193%
21.6%
Making a comparison between Tables 4 and 5
reveals that the near optimum PCs sequences
generated after risk consideration in PSC (schedules
from s
r1
to s
r4
) are totally different from those
obtained when neglecting the risks (schedules from s
1
to s
4
). More importantly, applying the PCs sequences
generated without considering risks (schedules from
s
1
to s
4
) to a PSC exposed to the predefined risks may
lead to poor performance in terms of both high
penalty and production costs, as shown from the
second column of Table 6. The third column of the
same table represents the percentage increase in
penalty and production costs in comparison with their
values in Table 5. These percentages illustrate how
production and penalty costs are escalated when
taking risks into consideration, and interestingly they
show that the penalty cost is more sensitive to these
risks than the production cost. This means that the
reputation and credibility of pre-casters to deliver PCs
on contracted due dates may be significantly harmed
if they ignore risks of PSC. In addition to that,
simulating PSC with risks requires a larger number of
replications (800 replications) than the number used
in case of ignoring risks (only 10 replications) and as
a result the optimization process takes longer time
when considering risks in the PSC. The long solution
time may pose a problem to production managers
who need faster ways to determine PCs sequences.
So, this might call for using other simulation
optimization methods to shorten the solution time
such as the response surface methodology.
7 CONCLUSION
Risks are ubiquitous and inevitable in the different
echelons of the PSC, and hence pre-casters need to
consider them when making operational decisions
such as sequencing of PCs. In spite of pernicious
effect of these risks propagating throughout the PSC,
as pointed in the previous studies, the effect of these
risks on determination of the optimum PCs sequences
has not yet been addressed. To bridge this gap, firstly,
echelons of the PSC accompanied by their risks are
simulated using a discrete event simulation model.
After that, it is linked with an optimization solver to
generate the optimum PCs sequences with and
without considering risks in the PSC. Making a
comparison between the optimum PCs sequences
generated with and without considering risks reveals
some remarkable points:
1- Near optimum PCs sequences obtained with
considering risks are totally different from that
produced in case of discarding risks.
2- Applying the generated near optimum PCs
sequences without considering risks on a PSC
plagued by risks causes high penalty and production
costs.
3- The penalty cost is escalated more than the
production cost in case of taking PSC risks into
consideration.
4- Considering risks in PSC increases variability
which in turn prolongs the computational time.
Having discussed all of this, this study provides
ICORES 2019 - 8th International Conference on Operations Research and Enterprise Systems
336

pre-casters with quantitative evidence for the
importance of integrating the risk management with
the PSC. Since allocating resources to conduct the
risk management procedures can help pre-casters not
only in minimizing the probability and impact of the
identified risks, but also in making better operational
decisions such as determining the optimum PCs
sequence to ensure higher service level with
minimum production cost. Hence, investing in
making a reliable risk management plan has dual
benefits to precasters. This can be backed by the study
findings that found that conducting simulation
optimization without considering risks in the PSC, to
find the optimum PCs sequence, may backfire and
lead to PCs sequences which cause high production
costs and vast deviations from the contracted due
dates. Moreover, this study provides the practitioners
with the way to link Arena
®
model with Optquest
®
to
solve precast flow shop sequencing problem.
However, using Optquest
®
for Arena
®
to solve this
problem when considering risks in the PSC took long
time due to high variability. This issue may be
worsened in case of using larger number of decision
variables and replications, which poses a problem for
pre-casters who need quicker way to make such
operational decisions. To remedy this, using another
simulation optimization methods such as response
surface methodology may be fruitful in order to
shorten the optimization time.
In line with this study, other research questions
need to be answered such as how considering the PSC
risks can influence other operational decisions such
as resource allocation and inventory management in
the precast plants.
REFERENCES
Automation, R., 2013. OptQuest for Arena, Rockwell
Automation.
Chan, W.-T., Hu, H., 2001. An application of genetic
algorithms to precast production scheduling.
Computers & Structures, 79(17), 1605–1616.
https://doi.org/10.1016/S0045-7949(01)00036-0
Guide, A., 2001. Project Management Body of Knowledge
(PMBOK® GUIDE). Project Management Institute.
Hu, H., 2007. A study of resource planning for precast
production. Architectural Science Review, 50(2), 106–
114. https://doi.org/10.3763/asre.2007.5016
Ko, C. H., Wang, S. F., 2011. Precast production scheduling
using multi-objective genetic algorithms. Expert
Systems with Applications, 38(7), 8293–8302.
https://doi.org/10.1016/j.eswa.2011.01.013
Law, A. M., 2007. Simulation modeling and analysis,
McGraw-Hill New York, 4
th
edition.
Marler, R. T., Arora, J. S., 2005. Function-transformation
methods for multi-objective optimization. Engineering
Optimization, 37(6), 551–570.
Michalska, K. Mazurkiewicz, J., 2011. Functional and
dependability approach to transport services using
modelling language. International Conference on
Computational Collective Intelligence, Springer, pp.
180–90.
Pheng, L. S., Chuan, C. J., 2001. Just-in-Time Management
of Precast Concrete Components. Journal of
Construction Engineering and Management, 127(6),
494–501. https://doi.org/10.1061/(ASCE)0733-
9364(2001)127:6(494)
Sacks, R., Easman, C. M., Lee, G., 2004. Process model
perspectives on management and engineering
procedures in the precast/prestressed concrete industry.
Journal of Construction Engineering and Management,
130(2), 206–215.
Simchi-Levi, D., Kaminsky, P., Simchi-Levi, E., 2000.
Designing and managing the supply chain. Concepts,
Strategies, and Case Studies.
Tuncel, G., Alpan, G., 2010. Risk assessment and
management for supply chain networks: A case study.
Computers in Industry, 61(3), 250–259.
https://doi.org/10.1016/j.compind.2009.09.008
Wang, Z., Hu, H., 2017. Improved Precast Production –
Scheduling Model Considering the Whole Supply
Chain. Journal of Computing in Civil Engineering,
31(4), 1–12. https://doi.org/10.1061/(ASCE)CP.1943-
5487.0000667.
Wang, Z., Hu, H., 2018. Dynamic response to demand
variability for precast production rescheduling with
multiple lines. International Journal of Production
Research, (January), 1–16.
https://doi.org/10.1080/00207543.2017.1414970
Wang, Z., Hu, H., Gong, J., 2018a. Framework for
modeling operational uncertainty to optimize offsite
production scheduling of precast components.
Automation in Construction, 86(April 2017), 69–80.
https://doi.org/10.1016/j.autcon.2017.10.026
Wang, Z., Hu, H., Gong, J., 2018b. Simulation based
multiple disturbances evaluation in the precast supply
chain for improved disturbance prevention. Journal of
Cleaner Production, 177(March), 232–244.
https://doi.org/10.1016/j.jclepro.2017.12.188
Yang, Z., Ma, Z., Wu, S., 2016. Optimized flowshop
scheduling of multiple production lines for precast
production. Automation in Construction, 72, 321–329.
https://doi.org/10.1016/j.autcon.2016.08.021
Yenisey, M. M., Yagmahan, B., 2014. Multi-objective
permutation flow shop scheduling problem: Literature
review, classification and current trends. Omega, 45,
119–135.
A Simulation based Optimization Study for Optimum Sequencing of Precast Components Considering Supply Chain Risks
337
