
A Clustering-based Approach to Determine a Standardized Statistic for
Daily Activities of Elderly Living Alone
Alexander Gerka
1
, Christian Lins
1
, Max Pfingsthorn
1
, Marco Eichelberg
1
, Sebastian M
¨
uller
2
,
Christian Stolle
2
and Andreas Hein
2
1
OFFIS - Institute for Information Technology, Escherweg 2, Oldenburg, Germany
2
Department for Health Services Research, Carl-von-Ossietzky University, Oldenburg, Germany
{christian.stolle1, sebastian.mueller, andreas.hein}@uni-oldenburg.de
Keywords:
Behavior Modeling, Assisted Living, Dementia, Activities of Daily Living, Clustering, χ
2
-statistic.
Abstract:
The modeling of behavior by monitoring activities of daily living allows caregivers to recognize early stages
of dementia. Therefore, many monitoring systems were presented in recent years. In this work, we present a
behavior modeling system that is based only on two adjustable parameters and provides a single standardized
output statistic. Therefore, this system enhances the comparison of recent and future activity monitoring
systems. The approach is comprised of three parts: First, the clustering of power plug data to detect time
windows in which appliances are used regularly. Second, the calculation of a comparison Matrix. Third the
test of change using the χ
2
-statistic. We tested this approach successfully in a seven-month field study with
two healthy subjects. We showed that the χ
2
-statistic reflected how regular activities were performed and that
one to two months, depending on the regularity of the performed activities, provide the necessary amount of
reference data for our approach to work.
1 INTRODUCTION
The development of a mild cognitive impairment or a
dementia disease is often accompanied by a decrease
in everyday functioning and the performance of ac-
tivities of daily living (ADL) (Deuschl et al., 2009).
Therefore, assessments to measure the ability of a per-
son to perform ADL and instrumented ADL (IADL)
were introduced (Lawton and Brody, 1969).
In general, studies using those tests show that
there is a correlation between the decline in ADL
skills and cognitive decline of persons suffering from
dementia (Cooke et al., 2000). Additionally, it was
detected that complex and instrumented ADL, such as
taking care of finances or using complex devices such
as the telephone are among the first activities affected
by cognitive decline (Willis et al., 1998).
A widely-accepted requirement for activity mon-
itoring systems is the unobtrusiveness (Gerka et al.,
2017) what is in contrast with the measurement
of those complex IADL. Therefore, many systems
monitoring dementia-related behavior changes, de-
tect those changes in ADL/IADL such as cooking,
bathing or toileting as they require less invasive sen-
sors. In general, the sudden decrease or an increase
in the frequency of an ADL may be an indicator for
a dementia-related behavior change. Additionally, the
change of the time of the performance of an ADL may
be caused by dementia, as persons with dementia may
suffer from shifts in the circadian rhythm (Deuschl
et al., 2009).
To ensure the acceptance of an ADL-monitoring
system, the sensitivity of such a monitoring system
has to be high and the false alarm rate has to be low.
Therefore, the detection of changes requires a moni-
toring system that determines behavior patterns with
high precision and is not susceptible to false positives.
As each person performs different activities of daily
living and the apartments differ, an ADL monitoring
system should provide a statistic that can be calcu-
lated from different apartments/sensor setups. Conse-
quently, such a system should not depend on many ad-
justable parameters and (person specific-)thresholds
and give a single standardized output statistic rather
than several output parameters. This becomes espe-
cially challenging if the acquired data belongs to dif-
ferent ADL-categories. The system should be sensi-
tive to frequency or time shifts of all monitored activi-
ties that result in a change of the standardized statistic
regardless of the activity or the type of the change.
264
Gerka, A., Lins, C., Pfingsthorn, M., Eichelberg, M., Müller, S., Stolle, C. and Hein, A.
A Clustering-based Approach to Determine a Standardized Statistic for Daily Activities of Elderly Living Alone.
DOI: 10.5220/0007369302640271
In Proceedings of the 12th International Joint Conference on Biomedical Engineering Systems and Technologies (BIOSTEC 2019), pages 264-271
ISBN: 978-989-758-353-7
Copyright
c
2019 by SCITEPRESS – Science and Technology Publications, Lda. All rights reserved

Nevertheless, the system should allow caregivers to
determine the “source” of the change to provide ap-
propriate measures. To the best of our knowledge
there is no method that
• is sensitive to both, frequency and timeshifts of
ADL and provides only one standardized output
statistic,
• calculates a single standardized statistic for setups
of different sensors or even different sensor types,
• calculates a single standardized statistic with fre-
quency values that belong to different ADL-
categories.
Our three-step approach to analyze the data from
power plugs is structured as follows: First, the data is
clustered with the DBSCAN algorithm for one month.
In the second step, the data of the following months
is compared to the reference month clusters yielding
a comparison matrix. Finally, the comparison matrix
was analyzed with the χ
2
-test to check whether the
data of the months are stochastically independent. If
stochastic independence is stated, a change in behav-
ior is detected.
In a seven-month field study conducted in two
apartments with healthy subjects, we demonstrated
that this approach can be used to model usual behav-
ior. Additionally, we figured out which is the neces-
sary learning time for our system to provide a stable
model for the participants.
2 STATE OF THE ART
The focus of the state of the art is on related work in
sensor-based ADL detection. Chen et al. presented
an extensive review of sensor-based activity recogni-
tion, which describes many different ways to moni-
tor ADLs (Chen et al., 2012). They distinguished be-
tween “vision-based” and “sensor-based” approaches
as well as between “knowledge-driven” and “data-
driven” approaches. As ”vision-based” approaches
may provide issues with data protection, especially
considering the new general data protection regula-
tion (GDPR) (EU, 2018), and are not well accepted
in Germany (Weiß and Braeseke, 2013), where our
study was performed, they are not in focus of our
work.
2.1 Knowledge Driven Approaches
In 2006 Suzuki et al. determined atypical days of el-
derly living in a nursing home (Suzuki et al., 2006).
In a field study with three participants, they installed
motion detectors (one per room) and detected indoor
activities of daily living by calculating the overall sum
of detections. Thereby, days that had a total count
that differed more than two standard deviations from
a learned mean value were classified as unusual. They
verified whether each day indeed was unusual by a
questionnaire. Although their approach failed to de-
termine the physical issues of the participants their
results indicate that their approach can be useful to
determine mental issues such as dementia or sleeping
disorders. This work indicates that simple approaches
may be effective for the detection of ADL and unusual
behavior.
In the work of Steen et al., a more sophisticated
approach was presented (Steen et al., 2013). This
approach is based on reed contacts that were placed
on doors and light barriers that were placed in door
frames. The data of those sensors is analyzed in
timeslot- and duration-based models. In the timeslot-
based model, the probability of being present in a cer-
tain room or location of an apartment is calculated.
The duration-based model contains the probability of
presence for a certain duration at a specific location.
These models were tested in a field study with two
participants. They introduced a model quality thresh-
old, that ensured that only models with a sufficient re-
peatability were used to detect anomalies. The evalu-
ation yielded that 30-50 days were needed to train the
models, such that at least one of the two models was
able to detect anomalies. For the anomaly detection,
a static and a non-static approach was used. The au-
thors report that a static threshold may be chosen too
high or low, and, therefore, miss alarms or produce
false alarms while the non-static threshold may adapt
itself such that longterm changes in behavior cannot
be detected.
Recently, a power plug called “AmbiAct” was in-
troduced (Iatridis and Schroeder, 2016). This power
plug is connected to devices that are used regularly,
like water kettles or the television. The “AmbiAct”
transmits each activation of the connected device to
a social alarm system, where an alarm timer is reset
after each activation. If the alarm timer expires, the
social alarm system establishes a voice connection to
the alarm center which evaluates the situation in the
apartment by talking to the inhabitant. This example
shows that simple, one-sensor based approaches are
already used in the real world.
2.2 Data Mining an Machine Learning
Approaches
In recent years, many data mining approaches to de-
tect and analyze ADLs were introduced. As an exam-
ple, Lotfi et al. used organizing maps, K-means and
A Clustering-based Approach to Determine a Standardized Statistic for Daily Activities of Elderly Living Alone
265

fuzzy C-means to cluster data (activation time, dura-
tion) from motion detectors and door contact sensors
(Lotfi et al., 2012). Anomalies were detected by cal-
culating the euclidean distance between a new record
and the formerly learned clusters. They tested their
system in two case studies with one inhabitant and
stated that their approach works best if the inhabitant
had routine activities.
Fleury et al. used Support Vector Machines to
classify activities based on the data for different am-
bient sensors types (e.g. infrared detectors, door con-
tacts, microphones) and a wearable kinematic sensor
(Fleury et al., 2010). They identified activities such as
hygiene, toilet use, eating, resting, sleeping, commu-
nication and dressing/undressing. However, this setup
was tested in a study with young and healthy subjects
that lasted only one hour. As results, classification
rates of 75% for a polynomial kernel and 86% for a
Gaussian kernel were determined.
In the work of Chen et al. multiple different
sensors (e.g. motion detectors, temperature sensors,
power usage sensors) were used in a smart apartment
(Chen et al., 2010). Their framework allowed users
to extract features from the sensor data and to analyze
this data with different algorithms. In a case study, a
student lived in this smart apartment. Different ma-
chine learning algorithms (Bayes Belief Networks,
Artificial Neural Networks, Sequential Minimal Op-
timization, and LogitBoost) were applied to analyze
the gained data. As the most effective classifier in
this evaluation, the LogitBoost algorithm achieved a
classification rate of 90 %.
2.3 Limitations of the State of The Art
A common problem of the presented systems and
studies is that the number participant in the studies
was low, what in many cases prevents the presented
results to be accepted or trusted by real-world ac-
tors, such as caregivers, relatives and companies or
sponsors. However, the low number of participants in
field studies is often a natural consequence of the way
many research projects are structured. Additionally,
studies with many participants are more expensive.
Still, the scientific community benefits from these
studies, if the results are somewhat comparable and
allow for a somewhat generalized conclusion. How-
ever, this is not the case as most studies use differ-
ent models, specific sensor setups or person-specific
thresholds to detect changes in behavior. Addition-
ally, these thresholds are sometimes defined some-
what arbitrarily.
Another common issue with the presented systems
is the lack of usability for caregivers. For instance,
a system depending on multiple personalized thresh-
olds for different models or ADLs might be cumber-
some to work with. Additionally, “pure” machine
learning approaches may not allow caregivers to un-
derstand why a change was detected, which prevents
them to verify this information and therefore, develop
trust in the technical solution.
Finally, some of the presented systems simply are
either not accurate or unobtrusive enough to be used
in real-world applications. In some cases, the reason
for the lack of accuracy is that the analysis methods
are susceptible to real-world problems, such as short-
term loss of data.
3 APPROACH
The approach presented in this work is comprised of
three steps: The identification of reference clusters
that allow us to detect timeslots for the usage of ap-
pliances. The second step is the comparison between
the reference clusters and subsequently acquired data.
The third step is the analysis of stochastic indepen-
dence between the new data and reference clusters.
3.1 Clustering
The aim of the clustering is to determine timeslots,
where each appliance is regularly used by the inhab-
itants. Initially, we propose to use the data of one
month to find reference clusters as this duration was
reported to be sufficient to build a human behavior
model (Steen et al., 2013) even if this model was built
with other sensor data. The timestamps consisting of
the hour, minute and second of the day, are induced
into one vector for a whole month for each device that
is connected to a power plug.
As it is unclear how many clusters may be in the
data, density-based clustering should be used in this
approach. Therefore, we used the HDBSCAN algo-
rithm (Campello et al., 2013). This algorithm con-
tains two parameters that had to be adjusted: The min-
imum number of samples (minSamples) that a cluster
has to contain, which was set to 10. This means that a
device has to be used at least ten times a month(every
third day) at nearly the same time of day to form a
cluster, which suits our intuitive definition of regular-
ity. The second parameter is the maximum distance
(maxDistance) for two samples to be in the same clus-
ter, which was determined empirically to be 3000s
= 50 min.
The result of the clustering are the timestamps (t
a
a
)
for each cluster’s boundary points for each appliance
(a).
HEALTHINF 2019 - 12th International Conference on Health Informatics
266

3.2 Monthly Comparison
For the monthly comparison, the data of a subsequent
month to the reference month is used. Therefore, the
sum of the number of timestamps of a specific appli-
ance that can be found within the cluster boundaries
of the reference month is calculated as presented in
eq. 1, where the variable k denotes a specific cluster,
and j the respective month.
s
a
j,k
= ||t
a
j,k
|| (1)
Additionally, all the points that are outside of the
boundaries are summarized. The calculated values
are stored in a table as presented in Table 1.
Table 1: Monthly Comparison table for each participant
with J = Number of Months and K = Number of Clusters.
Month/
Cluster
k = 1 k = 2 ... k = K Outlier
j = 1 s
a
1,1
s
a
1,2
... s
a
1,K
s
out
1,K+1
j = 2 s
a
2,1
s
a
2,2
... s
a
2,K
s
out
2,K+1
... ... ... ... ... ...
j = J s
a
J,1
s
a
J,2
... s
a
J,K
s
out
J,K+1
3.3 Test for Stochastic Independence
To detect changes between two samples (two rows
of the comparison matrix), their stochastic indepen-
dence can be evaluated. If the data in the rows are
stochastically independent, then a change within the
inner structure of a row has occurred. This means that
a structural change of behavior of the participant may
have occurred. To compare rows of the comparison
matrix there are two possible approaches, which have
been described by Steen et al.: the static and the dy-
namic approach. The static approach is known to be
more efficient in the detection of long-term changes,
which suits better the behavior changes that we want
to detect. The final step of this approach is, therefore,
to test the stochastic independence between the refer-
ence data (row 1 in Table 1) each other row (month)
of Table 1. To test two variables (in our case, months
and quantities of appliance usages) with respect to
their stochastic independence we use the well-known
fact that two variables (A,B) are stochastically inde-
pendent if the following equation is fulfilled (Handl,
2018):
P(A ∩B) = P(A) ∗P(B) (2)
If we rewrite Table 1 to a 2xK + 1 matrix as pre-
sented in equation 3:
s
a
1,1
s
a
1,2
... s
a
1,K
s
out
1,K+1
s
a
J,1
s
a
J,2
... s
a
J,K
s
out
J,K+1
(3)
and define the probabilities for each element as well
as the rows and columns as follows:
P
jk
=
s
jk
∑
J
j=1
∑
K+1
k=1
s
jk
(4)
P
j.
=
∑
K+1
k=1
s
jk
∑
J
j=1
∑
K+1
k=1
s
jk
(5)
P
.k
=
∑
J
j=1
s
jk
∑
J
j=1
∑
K+1
k=1
s
jk
(6)
Then we can rewrite the independence assumption for
our case as
P
jk
= P
j.
·P
.k
=
∑
K+1
k=1
s
jk
∑
J
j=1
∑
K+1
k=1
s
jk
·
∑
J
j=1
s
jk
∑
J
j=1
∑
K+1
k=1
s
jk
(7)
If we multiple equation 7 with n we get the expecta-
tion value s
jk
:
s
jk
=
∑
K+1
k=1
s
jk
·
∑
J
j=1
s
jk
∑
J
j=1
∑
K+1
k=1
s
jk
=
s
j.
·s
.k
s
(8)
This expectation value can be rewritten as
s
jk
−
s
j.
·s
.k
s
≈ 0 (9)
In case the data of two months is stochastically in-
dependent we expect n
∗
jk
to be a very low value. To
define a significance threshold for this value the χ
2
-
distribution can be used. Therefore we define our χ
2
-
statistic as:
χ
2
=
m
∑
j=1
r
∑
k=1
(s
jk
−s
∗
jk
)
2
s
∗
jk
(10)
To have a high confidence that expectation values
s
∗
jk
=
s
j.
·s
.k
s
are indeed χ
2
-distributed two criteria are
widely accepted. (Z
¨
urich-University, 2018):
1. All s
∗
jk
should be greater than 1.
2. Maximum 20 % of the s
∗
jk
may be smaller than 5.
Some sources use the additional criteria that all
values in the comparison matrix have to be above 10
to apply the χ
2
-test, i.e. (Rinne, 2008). However, this
criteria was not applicable in our approach.
If the first two above mentioned criteria are met,
we expect the χ
2
value in eg. 10 to be χ
2
-distributed
with d f = (m −1) ·(r −1) degrees of freedom. The
decision threshold parameter α is 5 %, as this is the
most common critical value used to state a signifi-
cant difference between two test samples. Therefore,
our system detects a change of behavior if the calcu-
lated χ
2
-value is bigger than the looked up threshold
χ
2
d f ,1−α
:
χ
2
> χ
2
d f ,1−α
(11)
A Clustering-based Approach to Determine a Standardized Statistic for Daily Activities of Elderly Living Alone
267
4 FIELD STUDY
The field study was conducted with two participants
and lasted 7 months. It should be mentioned that the
study described in this article was part of a larger
study with a total of eight participants. However,
those other participants were not equipped with power
plugs or did not live alone and are, therefore, not
within the scope of this work.
During the field study, the participants were vis-
ited by so-called quarter managers that talked to
them about their well-being and filled out an observa-
tion questionnaire that aimed at detecting dementia-
related behavior changes. Both participants were not
affected by dementia. However, while participant
5 was described to be very structured in daily life,
participant 8 was described by the quarter manager
as person that does not follow a structured lifestyle.
Thus, these participants represent two extremes in be-
havior complexity.
At the beginning of the field study, we discussed
with the participants which devices they used regu-
larly as only those devices are the most interesting for
our approach. We collected the data from power plugs
that were connected to different devices as shown in
Table 2.
Table 2: Devices connected to power plugs for each partic-
ipant.
No. Devices Age Alone?
5
Water Kettle
Television
76-80 yes
8
Water Kettle
Toaster
Microwave
71-75 yes
At the end of the field study the participants were
again interviewed by the quarter managers. As no
change in behavior could be detected by the quarter
managers, we expect the χ
2
–results not to exceed the
threshold in general.
5 RESULTS
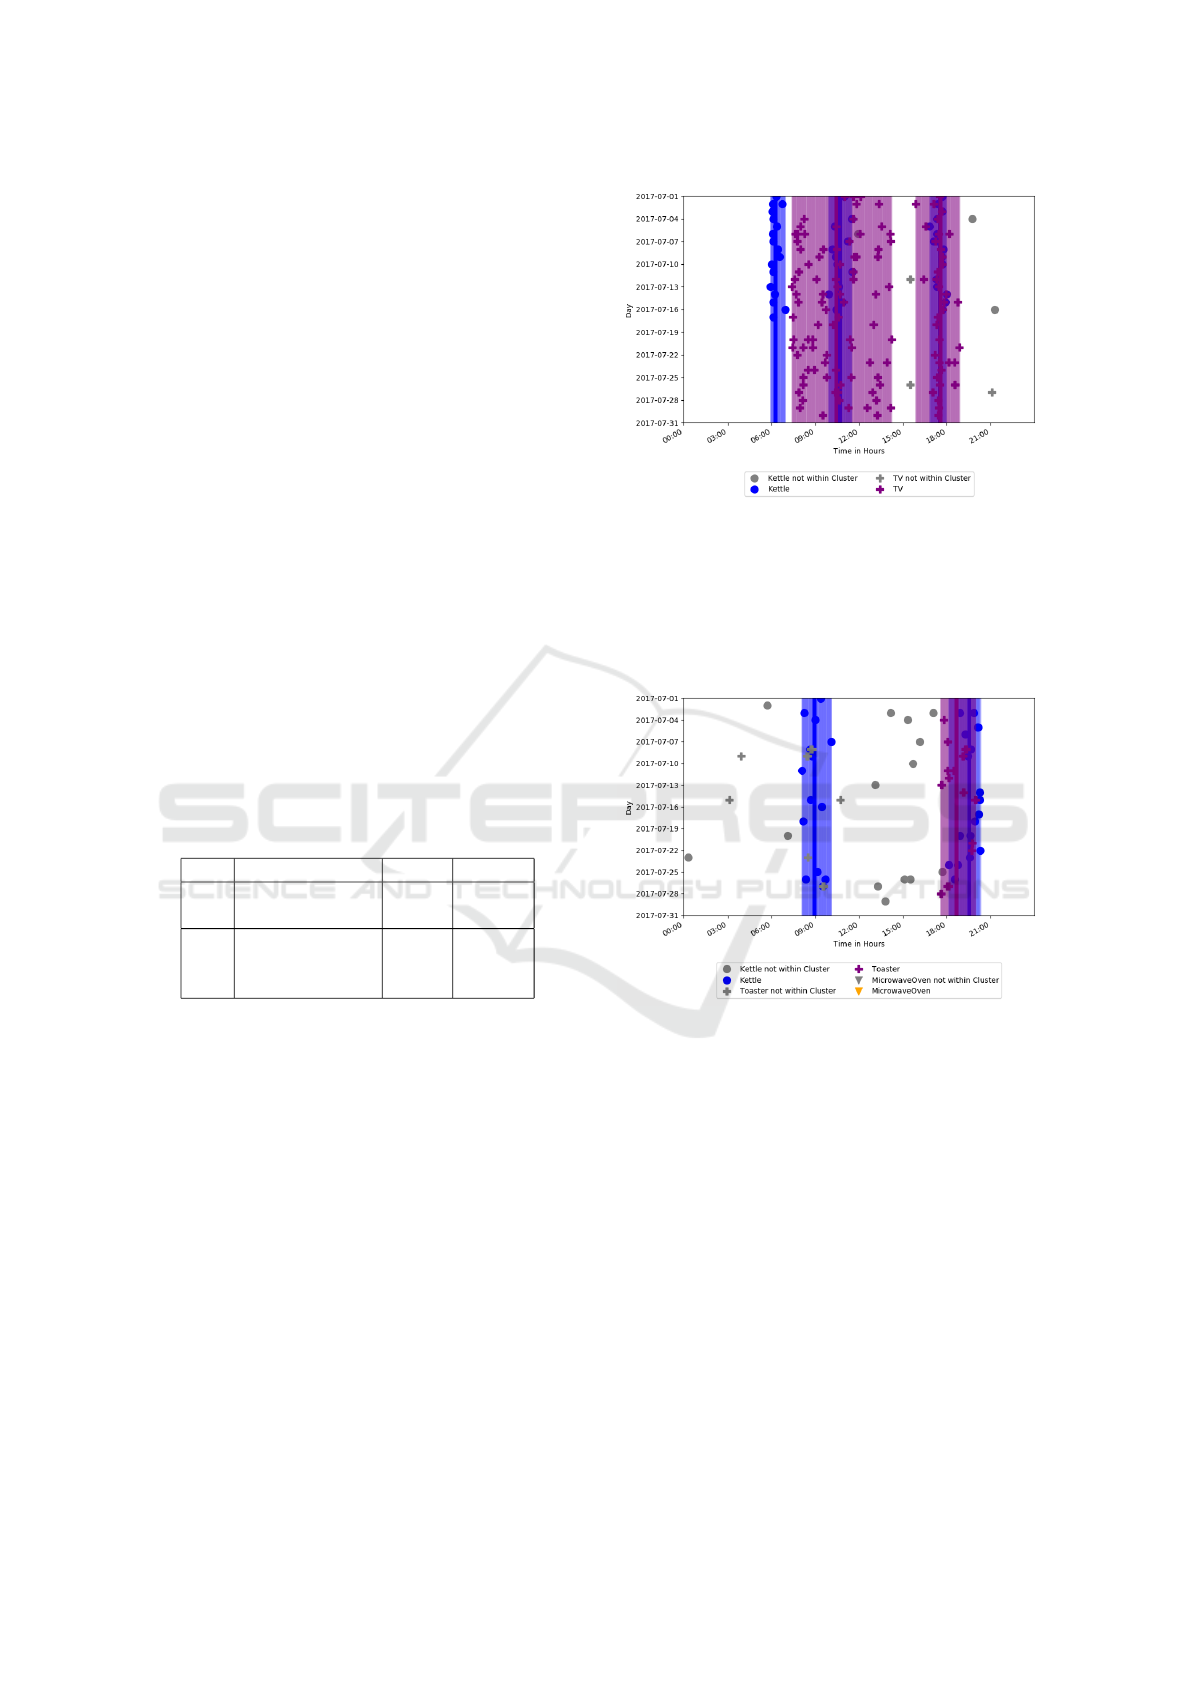
5.1 Finding Reference Clusters
The first step of our approach is the detection of clus-
ters as described in section 3.1. The resulting Clus-
ters are shown in the Figures 1 and 2. The clusters are
shown by the colored bars, with the thick line identi-
fying the center of each cluster.
Figure 1 shows the five detected clusters for par-
ticipant 5. Three clusters for the kettle (morning, mid-
Figure 1: Reference data and clusters for participant 5.
day and evening) and two clusters for the television
(midday and evening) were identified. The observa-
tion of the quarter manager that participant 5 follows
a structured lifestyle can clearly be seen, as there are
many data points close to the cluster’s center.
Figure 2: Reference data and clusters for participant 8.
Figure 2 shows the detected clusters for partici-
pant 8. For this participant, there is one device that
was not used often enough such that a cluster could be
recognized: the microwave. However, three clusters
have been identified: A morning and evening clus-
ter for the water kettle and an evening cluster for the
toaster. The quarter manager’s report that this person
is less structured can also be intuitively seen in the
data as there are many data points far off the cluster’s
center or even outside of the cluster.
With these clusters, we can analyze the other
months of the study and formulate a test table accord-
ing to Table 1, which results in Tables 3 and 4.
In Table 3 we see that there was data lost in the
month of November, as no usages of the water kettle
were detected. This was caused by a problem with a
power plug sensor.
HEALTHINF 2019 - 12th International Conference on Health Informatics
268

Table 3: Monthly Comparison table for participant 5 with
Cluster 1 = Morning Kettle, 2 = Midday Kettle, 3 = Evening
Kettle, 4 = Midday TV, 5 = Evening TV.
Month 1 2 3 4 5 Out
July 17 12 16 87 37 175
August 17 11 16 80 31 179
September 4 3 6 20 7 53
October 17 20 18 97 34 202
November 0 0 0 72 29 107
December 18 8 11 65 23 151
January 10 5 16 53 18 125
Table 4: Monthly Comparison table for participant 8 with
Cluster 1 = Morning Kettle, 2 = Evening Kettle, 3 = Evening
Toaster.
Month 1 2 3 Out
July 15 18 21 57
August 17 0 15 67
September 21 4 9 61
October 19 6 10 88
November 12 1 5 63
December 13 3 4 48
January 17 5 9 70
5.2 Test for Statistic Independence
The next step of our approach is to test the first row
of the tables 3 and 4 for statistic independence against
the other rows of each table. This was performed us-
ing eq.10. Additionally we calculated the expectation
values to verify how confident we can be that these
values are indeed χ
2
-distributed. The χ
2
-results and
the χ
2
-confidence are presented in the Tables 5 and 6.
Table 5: χ
2
-values for participant 5 (Reference: July) with
threshold χ
2
d f ,1−α
= 11.07.
Month χ
2
-value χ
2
> χ
2
d f ,1−α
χ
2
-conf.
August 0.76 no
√
September 2.26 no x
October 2.08 no
√
November 32.23 yes
√
December 2.54 no
√
January 4.05 no
√
Table 5 shows the χ
2
-values for participant 5. This
person was described by the quarter managers as very
structured and organized. Therefore, it is no surprise
to see that the χ
2
-threshold of χ
2
d f ,1−α
= 11.07 was
not exceeded in any month but November. In Novem-
ber we are missing all the data of the water kettle
power plug what let to this detection.
Additionally, the χ
2
-confidence was somewhat
low for September. This was also caused by data
loss, which can be seen in the comparison matrix,
as all values are significantly lower than in the other
months. However, as this data loss affected both sen-
sors the data is still somewhat “balanced” and the χ
2
-
value is under the threshold. This example shows, that
our approach is robust against the loss of data if this
loss is affecting all sensors equally.
Table 6: χ
2
-values for participant 8 (Reference: July) with
threshold χ
2
d f ,1−α
= 7.81.
Month χ
2
-value χ
2
> χ
2
d f ,1−α
χ
2
-conf.
August 19.31 yes
√
September 13.68 yes
√
October 16.43 yes
√
November 21.53 yes
√
December 13.65 yes
√
January 13.16 yes
√
In Table 6 the χ
2
-values for participant 8 are
shown. The threshold of χ
2
d f ,1−α
= 7.81 was ex-
ceeded constantly. This fits the description of the
quarter managers that this person has a less well
structured day than the other participants. The χ
2
-
confidence was high for all months in this evaluation.
5.3 Taking Two Months as Reference
As the previous results show, the χ
2
-values for partic-
ipant 8 exceed the χ
2
-threshold. Therefore, it is in-
teresting to evaluate whether the threshold is also ex-
ceeded if the data of two months is used to determine
the reference clusters. Additionally, it is interesting
to see if this increase in the amount of data used for
the clustering also affects the result for participant 5.
As we already found a suitable model for this partic-
ipant, which we showed in the previous subsection,
a further improvement of the χ
2
-values could mean
that our method is prone to overfitting if more than
the necessary amount of data is used.
Therefore we repeated the experiment using two
months (July and August) as reference months for
both participants.
In Table 7 the updated comparison matrix for par-
ticipant 5 is presented. Even though two months of
data were used for clustering (with parameters kept
constant) no additional clusters were formed. Besides
the first row, which has increased values as expected,
the values in the other did not change by much. This
means that the cluster boundaries did not shift by
much due to the increase of the amount of data used
for clustering. Therefore, we do not expect the χ
2
-
values to change significantly compared to those pre-
sented in the previous subsection.
A Clustering-based Approach to Determine a Standardized Statistic for Daily Activities of Elderly Living Alone
269

Table 7: Monthly comparison table for participant 5 (refer-
ence: July and August) with Cluster 1 = Morning Kettle, 2
= Midday Kettle, 3 = Evening Kettle, 4 = Midday TV, 5 =
Evening TV.
Month 1 2 3 4 5 Out
July+August 36 27 33 176 73 359
September 4 7 7 21 7 53
October 20 21 20 99 34 202
November 0 0 0 75 29 107
December 19 10 18 68 23 151
January 14 8 17 54 20 125
Table 8: Monthly comparison table for participant 8 (refer-
ence: July and August) with Cluster 1 = Kettle Morning, 2
= Kettle Afternoon, 3 = Toaster Morning, 4 = Toaster After-
noon, 5 = Toaster Evening.
Month 1 2 3 4 5 Out
July+August 37 18 10 37 23 150
September 24 4 4 9 4 66
October 21 6 3 10 6 75
November 15 1 2 6 2 59
December 14 3 2 4 0 41
January 20 5 3 10 6 63
The updated monthly comparison table for partici-
pant 8 (Table 8 ) shows that the number of clusters did
increase because of the usage of two months for clus-
tering. Therefore, we expect the χ
2
values to change
compared to the χ
2
values presented in Table 6 in the
previous subsection.
Table 9: χ
2
-values for participant 5 (Reference:
July+August) with threshold χ
2
d f ,1−α
= 11.07.
Month χ
2
-value χ
2
> χ
2
d f ,1−α
χ
2
-conf.
September 4.9 no x
October 2.15 no
√
November 37.01 yes
√
December 3.29 no
√
January 3.49 no
√
Table 9 shows the results for χ
2
-test for participant
5 with the updated comparison matrix. As expected
there is no significant change in the values compared
to those in Table 5 as some of the values increased
and others decreased insignificantly. Consequently,
all the months but November, are still clearly under
the χ
2
-threshold. Additionally, the χ
2
-confidence did
not change. Therefore we see, that our approach is not
prone to overfit the data if more data than necessary
is used.
The updated χ
2
-values for Participant 8 in Ta-
ble 10 do not exceed the threshold in the months
of September, October and January. However, the
Table 10: χ
2
-values for Participant 8 (Reference:
July+August) with threshold χ
2
d f ,1−α
= 11.07.
Month χ
2
-value χ
2
> χ
2
d f ,1−α
χ
2
-conf.
September 9.33 no
√
October 5.62 no
√
November 12.73 yes
√
December 11.19 yes x
January 4.11 no
√
threshold is still slightly exceeded in the months of
November and December. However, this example
shows that the resulting statistic in our approach is
close to the decision threshold for “irregular” partici-
pants if we use more than one month as a reference.
6 DISCUSSION
In this work, we presented a novel approach to model
the behavior of elderly persons living alone. Our
method worked well with data from power plugs that
were connected to devices which the participants re-
ported to use regularly. We think that this approach
is very unobtrusive as no interaction between the par-
ticipants and the installed technical system was nec-
essary. Although the real world observation that was
performed by the quarter managers was rather quali-
tative, a correlation between the calculated χ
2
-values
and the regularity of the performed ADL was de-
tected. We showed that the assumption to use one
month to “learn” the behavior of a person is suitable
for our approach but it can be necessary to use two
months in case the participant is less structured and
performs his or ADL less regular.
We could show that our method works in case of
sensor data loss if this loss is somewhat affecting all
sensors and not a particular sensor. Additionally, we
showed that χ
2
-confidence was high in most cases.
This confirmed the assumption that the χ
2
-test is a
well-suited approach for our data. However, in those
cases of lower χ
2
-confidence, we propose to raise
an alarm and to ask the caregiver to verify whether
a change in behavior occurred. As an alternative,
it is possible to “merge” two subsequent months to
one row in the comparison matrix, which would in-
crease the overall values and therefore, improve the
χ
2
-confidence.
The most important advantage of the presented
approach is the usage of the χ
2
-test as this test pro-
vides a standardized output and relies not on arbi-
trarily chosen parameters. In our method, the only
two parameters that were defined by us were the pa-
rameters for the clustering (minimum number of sam-
HEALTHINF 2019 - 12th International Conference on Health Informatics
270

ples in a cluster, maximum distance between two data
points). However, as the χ
2
-test would work with ev-
ery type of categorized quantities of ADL, it could be
used in approaches in which the clusters were defined
differently (i.e. arbitrarily) or data from other sensors
is used.
In future work, we aim at further improving the
presented approach. Therefore, we will further eval-
uate whether a dynamic method that uses an updated
reference month may be effective. Additionally, we
will evaluate this approach with other sensors, such
as motion detectors or smart meters.
ETHICAL CONSIDERATIONS
The field study presented in this article was ethically
evaluated and accepted by the Commission for Re-
search Impact Assessment and Ethics of the Univer-
sity Oldenburg (Drs.74/2016, Head: Prof. Dr. Chris-
tiane Thiel).
ACKNOWLEDGEMENTS
This work is funded by the Central Federal Asso-
ciation of the Health Insurance Funds of Germany
(GKV- Spitzenverband) in the context of the Quo-
Vadis research project.
REFERENCES
Campello, R. J., Moulavi, D., and Sander, J. (2013).
Density-based clustering based on hierarchical den-
sity estimates. In Pacific-Asia conference on knowl-
edge discovery and data mining, pages 160–172.
Springer.
Chen, C., Das, B., and Cook, D. J. (2010). A data mining
framework for activity recognition in smart environ-
ments. In Intelligent Environments (IE), 2010 Sixth
International Conference on, pages 80–83. IEEE.
Chen, L., Hoey, J., Nugent, C. D., Cook, D. J., and Yu,
Z. (2012). Sensor-based activity recognition. IEEE
Transactions on Systems, Man, and Cybernetics, Part
C (Applications and Reviews), 42(6):790–808.
Cooke, K. Z., Fisher, A. G., Mayberry, W., and Oakley, F.
(2000). Differences in activities of daily living pro-
cess skills of persons with and without alzheimer’s
disease. The Occupational Therapy Journal of Re-
search, 20(2):87–105.
Deuschl, G., Maier, W., et al. (2009). S3-leitlinie demenzen.
Deutsche Gesellschaft f
¨
ur Psychiatrie, Psychother-
apie und Nervenheilkunde (DGPPN) & Deutsche
Gesellschaft f
¨
ur Neurologie (DGN), pages 1–94.
EU (2018). European union - general data protection reg-
ulation. https://www.eugdpr.org, Accessed 2018-04-
09.
Fleury, A., Vacher, M., and Noury, N. (2010). Svm-based
multimodal classification of activities of daily living
in health smart homes: sensors, algorithms, and first
experimental results. IEEE transactions on informa-
tion technology in biomedicine, 14(2):274–283.
Gerka, A., Lins, C., L
¨
upkes, C., and Hein, A. (2017). Zu-
standserkennung von Beatmungsger
¨
aten durch Mes-
sung des Stromverbrauchs. 16. Deutscher Kongress
f
¨
ur Versorgungsforschung.
Handl, A. (2018). Unabh
¨
angigkeit und Homogenit
¨
at.
www.wiwi.uni-bielefeld.de/lehrbereiche/-emeriti/jfro
hn/Upload/unabh.pdf, Accessed 2018-09-24.
Iatridis, K. and Schroeder, D. (2016). Responsible research
and innovation in industry. Springer.
Lawton, M. P. and Brody, E. M. (1969). Assessment
of older people: self-maintaining and instrumen-
tal activities of daily living. The gerontologist,
9(3 Part 1):179–186.
Lotfi, A., Langensiepen, C., Mahmoud, S. M., and
Akhlaghinia, M. J. (2012). Smart homes for the el-
derly dementia sufferers: identification and prediction
of abnormal behaviour. Journal of ambient intelli-
gence and humanized computing, 3(3):205–218.
Rinne, H. (2008). Taschenbuch der Statistik, volume 4.
Harri Deutsch.
Steen, E.-E., Frenken, T., Eichelberg, M., Frenken, M., and
Hein, A. (2013). Modeling individual healthy behav-
ior using home automation sensor data: Results from a
field trial. Journal of Ambient Intelligence and Smart
Environments, 5(5):503–523.
Suzuki, R., Otake, S., Izutsu, T., Yoshida, M., and Iwaya,
T. (2006). Monitoring daily living activities of elderly
people in a nursing home using an infrared motion-
detection system. Telemedicine Journal & e-Health,
12(2):146–155.
Weiß, C. and Braeseke, G. (2013). Unterst
¨
utzung
Pflegebed
¨
urftiger durch technische Assistenzsysteme.
Accessed 2018-03-15.
Willis, S. L., Allen-Burge, R., Dolan, M. M., Bertrand,
R. M., Yesavage, J., and Taylor, J. L. (1998). Everyday
problem solving among individuals with alzheimer’s
disease. The Gerontologist, 38(5):569–577.
Z
¨
urich-University (2018). Methodenberatung - Pearson
Chi2 Test. https://www.methodenberatung.uzh.ch/de/
datenanalyse spss/unterschiede/proportionen/ pearso-
nuntersch.html, Accessed 2018-10-16.
A Clustering-based Approach to Determine a Standardized Statistic for Daily Activities of Elderly Living Alone
271
