
Deep Learning for Relevance Filtering in Syndromic Surveillance:
A Case Study in Asthma/Difficulty Breathing
Oduwa Edo-Osagie
1
, Beatriz De La Iglesia
1
, Iain Lake
2
and Obaghe Edeghere
3
1
School of Computing Sciences, University of East Anglia, Norwich, United Kingdom
2
School of Environmental Sciences, University of East Anglia, Norwich, United Kingdom
3
National Infection Service, Public Health England, Birmingham, United Kingdom
Keywords:
Syndromic Surveillance, Machine Learning, Text Classification, Deep Learning.
Abstract:
In this paper, we investigate deep learning methods that may extract some word context for Twitter mining for
syndromic surveillance. Most of the work on syndromic surveillance has been done on the flu or Influenza-
Like Illnesses (ILIs). For this reason, we decided to look at a different but equally important syndrome,
asthma/difficulty breathing, as this is quite topical given global concerns about the impact of air pollution.
We also compare deep learning algorithms for the purpose of filtering Tweets relevant to our syndrome of
interest, asthma/difficulty breathing. We make our comparisons using different variants of the F-measure as
our evaluation metric because they allow us to emphasise recall over precision, which is important in the
context of syndromic surveillance so that we do not lose relevant Tweets in the classification. We then apply
our relevance filtering systems based on deep learning algorithms, to the task of syndromic surveillance and
compare the results with real-world syndromic surveillance data provided by Public Health England (PHE).We
find that the RNN performs best at relevance filtering but can also be slower than other architectures which
is important for consideration in real-time application. We also found that the correlation between Twitter
and the real-world asthma syndromic surveillance data was positive and improved with the use of the deep-
learning-powered relevance filtering. Finally, the deep learning methods enabled us to gather context and word
similarity information which we can use to fine tune the vocabulary we employ to extract relevant Tweets in
the first place.
1 INTRODUCTION
Syndromic surveillance can be described as the real-
time (or near real-time) collection, analysis, interpre-
tation, and dissemination of health-related data to en-
able the early identification of the impact (or absence
of impact) of potential human or veterinary public
health threats that require effective public health ac-
tion (Triple, 2011). The systems collect health data in
real or near real-time to track trends in the occurrence
of disease conditions of public health importance in
a defined population. For example, these systems use
emergency department attendances or general prac-
tice consultations to track specific syndromes like
influenza-like illness. Expanding access to communi-
cations and technology makes it increasingly feasible
to implement syndromic surveillance systems in Low
and Middle Income Countries (LMIC) and early ex-
amples in Indonesia and Peru have indicated reasons
for optimism (Chretien et al., 2008). The expansion
in digital technology and increasing access to online
user-generated content like social media has provided
another source of data for syndromic surveillance pur-
poses.
Our aim is to investigate the use of additional
data sources such as social media activity to estimate
the burden of disease, detect outbreaks and monitor
trends over time. The use of web and social media
data for disease surveillance has been gaining mo-
mentum and may be able to capture a population that
does not seek medical help via the more established
means. The use of Twitter data in particular has
also shown a lot of promise for disease surveillance
(Charles-Smith et al., 2015). The real-time-stream
nature of Twitter data could provide a time advantage
for syndromic surveillance activities aimed at early
detection of disease outbreaks. In addition to this,
the low cost of utilisation of this data means that it
could be used in LMIC where access to medical ser-
vices and laboratory confirmation may be restricted
Edo-Osagie, O., De La Iglesia, B., Lake, I. and Edeghere, O.
Deep Learning for Relevance Filtering in Syndromic Surveillance: A Case Study in Asthma/Difficulty Breathing.
DOI: 10.5220/0007366904910500
In Proceedings of the 8th International Conference on Pattern Recognition Applications and Methods (ICPRAM 2019), pages 491-500
ISBN: 978-989-758-351-3
Copyright
c
2019 by SCITEPRESS – Science and Technology Publications, Lda. All rights reserved
491

but the population has access to social media. De-
spite this, there are still some issues with Twitter and
social media mining which researchers have identi-
fied such as difficulties in dealing with relevance of
Tweets to mining tasks and leveraging contextual in-
formation (Hripcsak and Rothschild, 2005). In addi-
tion, it requires interdisciplinary efforts and also re-
quires clearly defined performance measures because
of the fact that much of it is conducted in an appli-
cation scenario (Zeng et al., 2010). It is with these
motivations and ideas in mind that we set about our
work.
We begin by developing a framework for the
purpose of monitoring asthma/difficulty breathing in
England over Twitter in the context of syndromic
surveillance. A lot of attention has been put into syn-
dromic surveillance for influenza-like illnesses so we
decided to look at a different but equally important
syndrome, asthma/difficulty breathing, as this is quite
topical given global worry about the impact of air pol-
lution on respiratory health (Requia et al., 2018). In
order to do this, we will need to make use of the
following methodology: (a) collect Tweets; (b) fil-
ter by location (e.g. England); (c) identify and ex-
tract Tweets expressing the occurrence of, or concern
related to our syndrome of interest (i.e. health con-
ditions arising from exposure to air pollution); (d)
produce a signal from the extracted relevant Tweets.
We intend to extend the application of our research
to other syndromes in the future but this seems like a
reasonable case study to develop the methodology.
Twitter offers millions of Tweets per day so key-
word filtering can be used for Tweet collection to
achieve some relevance. Most of the Tweets col-
lected, however, may mention keywords such as
“asthma”, “air pollution” or “wheeze” but may not
necessarily be relevant in that they do not represent
a user expressing discomfort. For some context, ex-
amples of Tweets containing the keyword “asthma”
include “oh I used to have asthma but I managed
to control it with will power” or “Does your asthma
get worse when you exercise?”. However, we do not
consider these Tweets relevant. On the other hand,
Tweets such as “why is my asthma so bad today?”
express a person currently affected and we would like
to consider such a Tweet as relevant. Classification
of relevant Tweets requires an automated approach.
Hence we investigate text mining algorithms that en-
able this. However, an intelligently chosen initial
set of keywords would increase the relevance of the
Tweets collected in the first place so we also look at
how we may improve on our choice of keywords.
2 BACKGROUND AND RELATED
WORK
Google Flu Trends (GFT), which was introduced in
2009 was a highly influential paper in digital disease
detection and inspired a lot of work in the field (Gins-
berg et al., 2009). It illustrated that data which was
not necessarily organised or collected for health re-
lated purposes could be used for health analysis. In
our current age of big data, this is an important find-
ing. In recent years, social media, especially Twitter,
has been used for health analysis with positive results
(Cassandra Harrison et al., ; Lamb et al., 2013; Li and
Cardie, 2013; Broniatowski et al., 2013). Many of the
papers detailing this sort of Twitter analysis make use
of a TF-IDF representation for Tweets. These feature
vector representations do not consider word seman-
tics and are limited by the vocabulary of the dataset.
One way to get around this issue is the application of
deep learning. Deep learning is a branch of machine
learning that has seen a lot of interest lately, having
displayed state-of-the-art performance in many diffi-
cult tasks. In recent literature, deep learning has been
widely applied to Twitter for sentiment analysis and it
has shown promising results (Severyn and Moschitti,
2015a; Severyn and Moschitti, 2015b). In America, it
has been used for the surveillance of flu trends ([Plea-
seinsertintopreamble]erban et al., 2018).
However, in addition to the lack of context and
semantics, there could be a problem with the ini-
tial choice of keywords for searching and collecting
Tweets. To tackle this, we want to employ deep learn-
ing methods for the exploration of an adaptive auto-
matic keyword system. In such a system, an initial
set of keywords is chosen and used to stream Tweets.
The keywords most associated with relevance (i.e.
the keywords that are observed to exist in the text
of Tweets that are relevant) can be promoted. Words
that are similar in meaning to these keywords could
potentially bring in more relevant Tweets, which are
currently not being collected. Semantic information
obtained from deep learning would enable us to find
such words. We use deep learning to find semantic in-
formation encoded in word vectors learned from deep
embeddings and we use the semantic information to
automatically generate alternative keywords based on
word similarity. Additionally, deep neural word mod-
els are learned in an unsupervised manner. They do
not require expensive labelling, but can be derived
from large unannotated corpora that are easily obtain-
able. This means that these algorithms are prime can-
didates for tasks with small amounts of labelled data.
We have a double objective: (i) to robustly and ac-
curately classify Tweets for the purpose of syndromic
ICPRAM 2019 - 8th International Conference on Pattern Recognition Applications and Methods
492
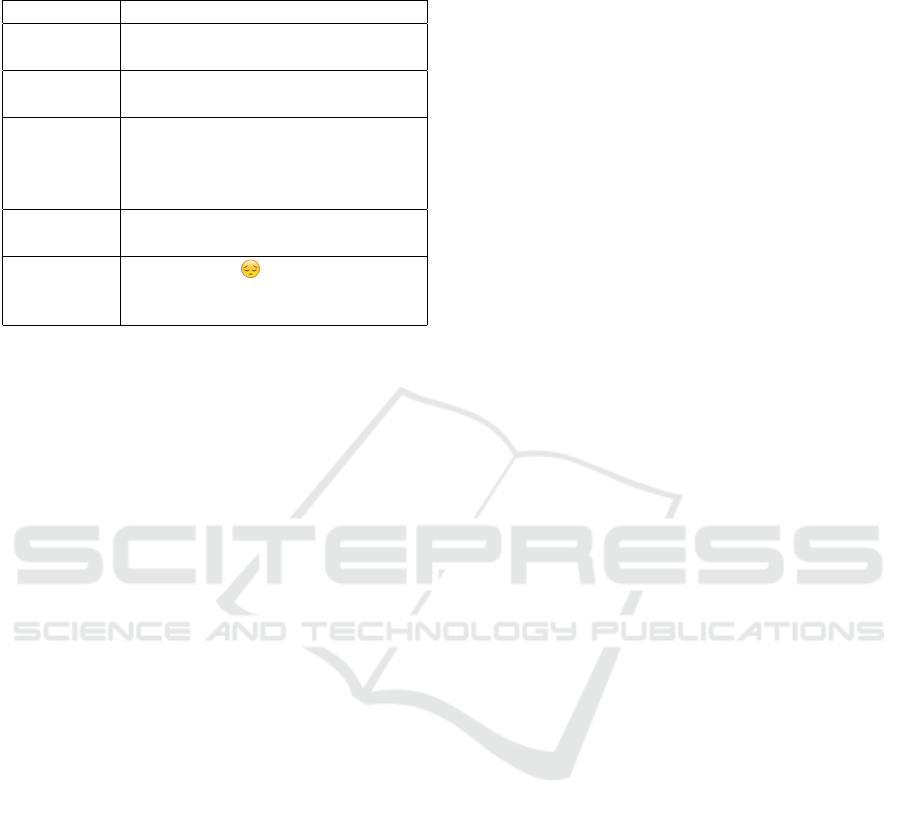
Table 1: A random sample of words and their 8 most similar
words as computed from a Twitter dataset using Skipgram
embeddings.
Word Similar Words
china tourists, demonstration, descent,
247, germany, octobers, hgv, round
kids lowest, action, syrup, w, birth,
tapped, 43, till
controversy breathenncos, againlol, #hypocrite,
weightlifter, maseratis, #wemiss-
boris, #americasnexttopmodel, de-
fended
fit mad, sext, 2hrs, blurred, ellen,
helped, impotent, blocked
obese #londonsair, , cops, #euref, in-
cluded, choking, scientifically, suf-
fer
surveillance even in the context of few labelled exam-
ples (ii) to investigate how to adaptively select key-
words used for streaming Tweets.
3 APPLYING DEEP LEARNING
TO TWITTER DATA
3.1 Context and Semantic Learning
Word embeddings (sometimes referred to as word
vectors) learned using neural networks have been
shown to perform well in similarity tasks (Jin and
Schuler, 2015). While estimating a neural net-
work’s weights and biases, we also implicitly want to
learn/estimate embeddings for words in a vocabulary.
In this embedding space, similar words are close to
each other. For example, the vector for ‘dog’ should
be close to the vector for ‘puppy’. This means that se-
mantic information can be inferred from the vectors
as opposed to merely syntactical or count-based in-
formation. In addition to this, such vectors are a fixed
size, independent of the vocabulary size. A vector
can have a length of 200 or some other arbitrary num-
ber selected by the programmer based on trial and er-
ror. This reduces dimensionality and saves significant
computational and memory overheads.
There are two algorithms which have seen
widespread use for computing word vectors. The first
is word2vec (Mikolov et al., 2013) which has two pos-
sible architectures namely Skipgram and Continuous
Bag-Of-Words (CBOW). The second is Global Vectors
for Word Representation (GloVe) (Pennington et al.,
2014). We built our word vectors on a set of 5 million
unlabelled Tweets collected without any keyword re-
strictions over different periods. We tested our imple-
mentations on similarity by using a random sample of
words, converting them to word vector space and de-
termined the words most similar to each of them as
the words whose vectors were closest to the vectors
of the query words. Table 1 shows the results of our
Skipgram word vector model. For some of the words
(e.g. China and demonstration or China and hgv or
hypersonic glide vehicle) the connection is somehow
obvious whereas for others it is more opaque. We can
also see that this approach can establish connections
between words and hashtags or emojis giving more
possibilities for expanding vocabularies.
In Tweet classification, we deal with collections
of words. This means that we still need to combine
the word vectors in a Tweet in a meaningful way, to
preserve the useful semantic relationships such that
we obtain a powerful understanding of the Tweet as a
whole. This can be achieved by computing the mean
of the word vectors in a text and using that to repre-
sent the text as a whole. However, we lose some of
the positional information of the text. An alternative
is to concatenate the vectors but this does not repre-
sent the complex relationships between the different
words particularly well. A more complex solution
would be to learn vectors for entire documents. From
an NLP point of view, we can view a Tweet as a doc-
ument. For the construction of vector representations
for documents, there are models which are extensions
to the word embedding models that we can adopt. A
popular example of such a model is paragraph2vec
(Le and Mikolov, 2014) which is an extension of the
word2vec model. While word2vec has the Skipgram
and CBOW variants, paragraph2vec extends them to
the Distributed Memory Paragraph Vectors (PV-DM)
and the Distributed Bag of Words Paragraph Vector
(PV-DBOW). We implemented both variants of the
paragraph2vec model, building them from the same
Twitter dataset that the word2vec models were built
from. We tested our constructed paragraph2vec mod-
els by way of similarity as before. Table 2 shows
the results obtained from our PV-DM paragraph2vec
model. Again, we can observe that some meaning
and semantic similarities are being captured by this
approach.
3.2 Classification
We propose deep neural networks for our tasks which
along with other neural networks, are universal func-
tion approximators. The universal approximation the-
orem states that a feed-forward network with a sin-
gle hidden layer containing a finite number of neu-
rons (i.e. a multilayer perceptron), can approximate
Deep Learning for Relevance Filtering in Syndromic Surveillance: A Case Study in Asthma/Difficulty Breathing
493

Table 2: A random sample of Tweets and their 2 most simi-
lar Tweets as computed using PV-DM embeddings.
Tweet Similar Tweets
do you know an
elderly person with a
bad cough trouble
breathing a cold or
sore throat get advice
from nhs direct
before it gets worse
might go to casualty
and see if i can get
an inhaler worth a try
anyway
<usermention> i
know a few with
asthma and peanut
allergies
usermention but
what is that i cant
even breathe
i cant breathe what
even
usermention hannah
im wheezing i dont
even need the transla-
tion
continuous functions on compact subsets of R
n
, under
mild assumptions on the activation function (Haykin,
1994). It has been shown that it is not the specific
choice of the activation function, but rather the multi-
layer feedforward architecture itself which gives neu-
ral networks the potential of being universal approx-
imators (Hornik, 1991). In addition to the multi-
layer perceptron (MLP) architecture, we also experi-
mented with Convolutional Neural Networks (CNNs)
(Krizhevsky et al., 2012) as well as Recurrent Neural
Networks (RNNs) (Mikolov et al., 2010).
CNNs are a category of neural networks that have
proven very effective in image classification. CNNs
introduce one or more convolutional layers (often
with pooling layers) which are then followed by one
or more fully connected layers as in a standard mul-
tilayer neural network. This architecture is designed
to receive 2D input and is typically applied to images.
We can represent a Tweet (or body of text) using a
two-dimensional matrix if the first dimension stores
the constituent words’ positions and the second di-
mension stores the vector representations for the con-
stituent words. This means a Tweet is represented by
a matrix of size n × v where n is the number of words
in the text and v is the size of the word vector. In
practice, Tweets and sentences have different lengths.
We workaround this problem by defining some fixed
upper bound for a sentence and adding padding vec-
tors to texts with fewer words than the upper bound.
Our CNN was built with three convolution and pool-
ing layers followed by one fully connected layer. Our
convolution layers had window sizes 2,4 and 6 and
a learning rate of 0.01. The cost function was mini-
mized using an Adaptive Moment Estimation (Adam)
optimizer.
RNNs are a category of neural networks that in-
corporate sequential information. That is to say, while
in a traditional neural network, inputs are indepen-
dent, in an RNN, each node depends on the output
of the previous node. This is particularly useful for
sequential data such as texts, where each word de-
pends on the previous one. We make use of Long
Short Term Memory networks (LSTMs) (Graves and
Schmidhuber, 2005) in our experiments as they are
better at capturing long-term dependencies than sim-
ple RNNs. Our RNN was built with two LSTM layers
with 256 neurons each and a learning rate of 0.01. The
cost function was minimized using Root Mean Square
Propagation (RMSProp).
Finally, we also constructed a simple MLP neural
network. Our MLP was built with three hidden layers
with 256 neurons each and a learning rate of 0.001.
The cost function was also minimized using an Adam
optimizer.
4 EXPERIMENTS AND RESULTS
We apply the deep learning concepts described in the
previous section to our scenario of syndromic surveil-
lance for asthma/difficulty breathing. First, we ex-
periment with different deep embedding representa-
tions of Tweets and deep learning models in relation
to how they perform as a relevance filter for discov-
ering symptomatic Tweets. We then apply our rele-
vance filter to Twitter data for a continuous period in
order to generate a signal representing Twitter activ-
ity for asthma/difficulty breathing. We compare this
signal to data from real-world syndromic surveillance
systems for evaluation. Finally, we look at leverag-
ing the semantic information learned for the purpose
of intelligent keyword selection for the data collection
process.
4.1 Relevance Filtering
Tweets were collected using the official Twitter
streaming Application Programmer’s Interface (API).
The streaming API has a number of parameters that
can be used to restrict the Tweets obtained (e.g. key-
word search, where only Tweets containing the given
keywords are returned). In conjunction with epidemi-
ologists from Public Health England (PHE), we built
a list of keywords that may be connected to the symp-
toms for asthma/difficulty breathing syndrome, and
expanded on this initial list using various synonyms
from regular thesauri as well as from the urban dic-
tionary in order to capture some of the more collo-
quial language used on Twitter. We then used these
keywords to restrict our Tweet collection. We also
ICPRAM 2019 - 8th International Conference on Pattern Recognition Applications and Methods
494

only collected Tweets we found to be geolocated to
the UK or marked as originating from a place in the
UK. We make the effort with filtering location like
this and reducing the amount of Tweets we have to
work with because of the fact that we are looking at
natural language on social media which will involve
a lot of slang and internet vernacular. UK slang can
be similar to slang from some regions of the world
(e.g. parts of Toronto), but it can also be very differ-
ent (e.g. the U.S. and South America). Because this
might change the way people complain about their
symptoms and the context of our relevance filtering is
syndromic surveillance in England, we choose to fil-
ter out Tweets based on geographical origin. The col-
lected Tweets then had to be cleaned with the removal
of duplicates and Retweets and replacing URLs and
user mentions with the tokens “<URL>” and “<MEN-
TION>” respectively. We considered implementing
measures to prevent a false amplification of the sig-
nal due to one user tweeting multiple times but af-
ter further inspection, found that this was not neces-
sary. This is because Twitter users tend not to tweet
the same thing more than once and especially not in
a short period of time. Such behaviour is discour-
aged and penalised both by Twitter and by peers on
the platform as it is classified as spam-like behaviour
by the website, and as unoriginal, boring or tiresome
by peers (Fennell, 2017). A similar concern exists for
a single user posting Tweets across their multiple ac-
counts but this is also handled by Twitter’s anti-spam
efforts (Roeder, 2018).
3500 Tweets were collected from the time period
September 23, 2015 - November 30, 2015, our first
collection period. These Tweets were labelled and
used for development and experimentation. A Tweet
was labelled as relevant if it announced or hinted at an
individual displaying symptoms pertaining to respira-
tory difficulties. The labelling was done by three vol-
unteers. A first person initially labelled the Tweets.
A second person checked the labels and flagged up
any Tweets with labels that they did not agree with.
These flagged Tweets were then sent to the third per-
son who made the decision on which label to use.
Otherwise, it was labelled as irrelevant. 23% of the
labelled Tweets were labelled as relevant while 77%
were labelled as irrelevant. We then partitioned this
dataset into a 70:30 training-test split.
To measure model fit, accuracy is a misleading
measure as it may only be reflecting the prevalence of
the majority class which is especially problematic as
our dataset is quite unbalanced. Our aim is to detect
Tweets which might suggest cases of a syndrome un-
der surveillance (which for the purposes of this study
was symptoms of asthma/difficulty breathing). The
signal for some syndromes is quite weak as not many
cases may occur at a national level and even less may
be discussed on Twitter. Because of this, we need to
ensure that relevant Tweets are kept. We would like
to reduce the number of irrelevant Tweets but not at
the expense of losing the relevant Tweets in the sig-
nal. This means that, for our classifier, errors are not
of equal cost. Relevant Tweets that are classified as
irrelevant or False Negative (FN) errors should have
a higher cost and hence be minimised; we can have
more tolerance of irrelevant Tweets classified as rel-
evant or False Positive (FP) errors. Those subtleties
are well captured by alternative measures of model
performance such as Recall, which can be interpreted
as the probability that a relevant Tweet is identified by
the model and Precision, which is the probability that
a Tweet predicted as relevant is indeed relevant. The
F-measure (sometimes referred to as F-score) com-
bines these two metrics together. The formula for pos-
itive real β is defined as:
F
β
= (1 + β
2
) ×
Precision × Recall
(β
2
× Precision) + Recall
. (1)
The traditional F-measure or balanced F-score
(Hripcsak and Rothschild, 2005) uses a value of β =
1. A variation of this, the F
2
measure, with β = 2, is
more suited to our purpose as it weighs recall higher
than precision. Note that all our results are computed
from the test partition.
We present the results of applying deep learn-
ing approaches to classification for the relevance fil-
tering task. We experimented with using features
constructed via deep learning (i.e. word and doc-
ument embeddings) as well with different neural
classification models. We first sought to determine
which of our feature embeddings worked best and
then used this feature embedding to determine which
neural classification model filtered our Tweets best.
To do this, we constructed Multilayer Perceptron
(MLP) neural networks using Skipgram word vec-
tors, CBOW word vectors, GloVe word vectors, PV-
DM document vectors and PV-DBOW document vec-
tors as feature representations of Tweets. When using
word vectors for feature representations of Tweets, we
considered the feature vector of each Tweet to be the
mean of the embeddings for the words in the Tweet.
Table 3 shows the results we observed. We found
that taking the mean of the GloVe vectors of the words
in a Tweet gave us the best performance. Because of
this, we decided to use GloVe to represent words and
Tweets in our experiments moving on. Next we built
and applied a CNN and RNN to our relevance filter-
ing task. We compared the results of these classifiers
with each other as well as against the best perform-
ing MLP model from the earlier Tweet feature em-
Deep Learning for Relevance Filtering in Syndromic Surveillance: A Case Study in Asthma/Difficulty Breathing
495
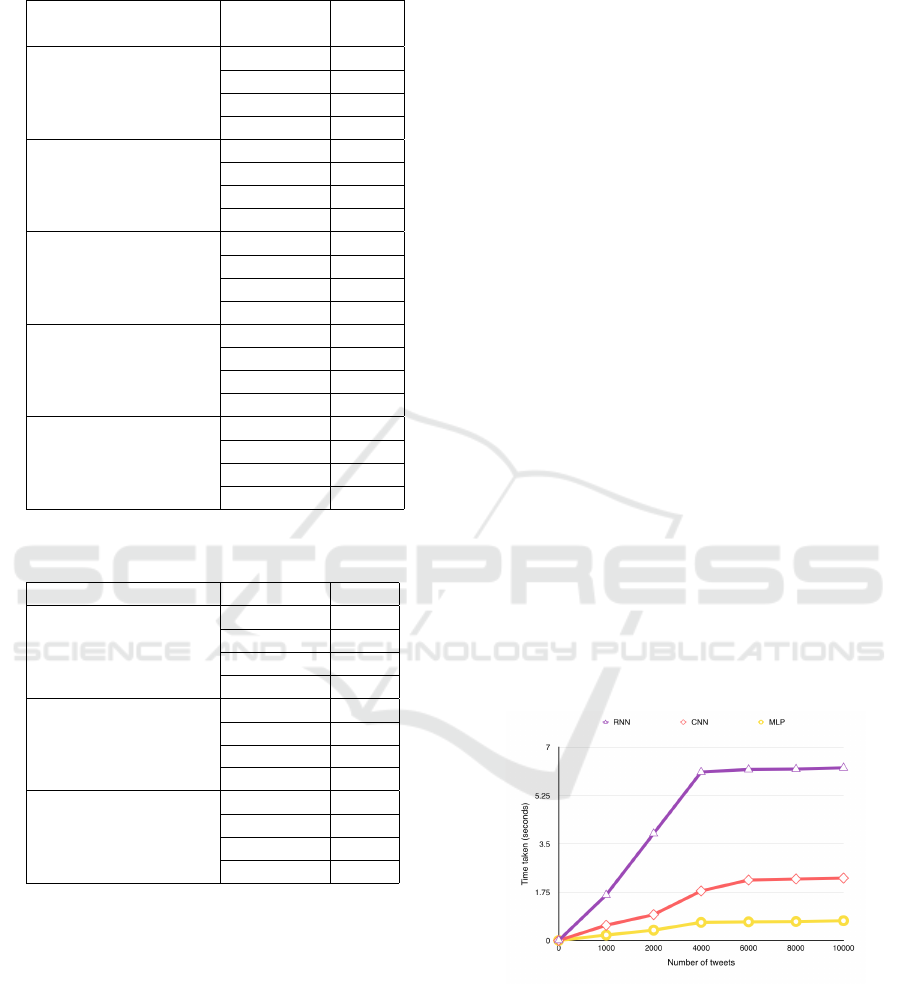
Table 3: Classification performance of different Tweet fea-
ture representations obtained from deep embeddings.
Tweet Embedding
Algorithm
F-Measure
Skipgram Mean
Precision 0.775
Recall 0.720
F 0.747
F2 0.732
CBOW Mean
Precision 0.675
Recall 0.647
F 0.661
F2 0.652
GloVe Mean
Precision 0.729
Recall 0.765
F 0.747
F2 0.757
PV-DM
Precision 0.588
Recall 0.625
F 0.606
F2 0.618
PV-CBOW
Precision 0.675
Recall 0.718
F 0.670
F2 0.708
Table 4: Performance of different deep classifiers on rele-
vance filtering task.
Deep Classifier F-Measure
Multilayer Perceptron
Precision 0.729
Recall 0.765
F 0.747
F2 0.757
Convolutional Neural
Network
Precision 0.521
Recall 0.779
F 0.625
F2 0.709
Recurrent Neural
Network (LSTM)
Precision 0.638
Recall 0.841
F 0.726
F2 0.791
bedding experiment (i.e. MLP built on GloVe mean
shown in table 3). We present the results of this exper-
iment in table 4. We found that the RNN performed
best, yielding the highest F
2
score, our preferred mea-
sure. RNNs take advantage of the sequential nature
of text which is also exhibited by Tweets (which are
short-texts). CNNs on the other hand are good at ex-
tracting position-invariant features in space. Because
of the short nature of Tweets, even when they are
represented in 2D space, CNNs do not have a lot of
salient spatial information to work with and are out-
performed by the MLP as well. Because our syn-
dromic surveillance system is intended to be used in
real-time, we also considered the time taken to per-
form the relevance classification. We measured and
plotted the times taken for the MLP, RNN and CNN
to perform the relevance filtering on up to 10,000
Tweets. For this experiment, we used unlabelled
Tweets from a second collection period June 21, 2016
- August 30, 2016. This plot is shown in figure 1.
From the plot, we can see that the RNN takes the
most time while the MLP takes the least time. We
also observed that the time taken for relevance filter-
ing rises steadily with the number of Tweets up until
about 4000 Tweets. After this, the time taken changes
very little as the number of Tweets rises. This is due
to the fact that all Tweets get classified at once (at
the cost of increased memory usage) by making use
of the batch processing of TensorFlow. In the cases
with 4000 Tweets and above, it would appear that the
computer could not manipulate all of the data together
at once with its available RAM, so larger ROM or
swap space is used which eliminates the need for in-
cremental processing (as more space is available in
that scenario). Nonetheless, this does not change the
fact that the different neural networks spend differ-
ent amounts of time on the relevance classification,
despite the RAM or ROM memory conditions. The
bulk of the difference in time spent on classification
is down to the architecture of the network and the
amount of setup required. From figure 1, we find that
the relatively simple architecture of the MLP perfoms
much quicker than that of the RNN and CNN and the
RNN sees more drastic jumps in time taken for rele-
vance filtering as the number of Tweets increase.
Figure 1: Time taken to perform relevance classification on
a collection of Tweets.
4.2 Syndromic Surveillance
As we discussed earlier, the purpose of our rele-
vance filtering is a syndromic surveillance applica-
tion. While we found that RNNs performed well
at the task of relevance filtering, it does not nec-
ICPRAM 2019 - 8th International Conference on Pattern Recognition Applications and Methods
496

essarily confirm that they will allow us to achieve
our main goal of observing the health situations and
trends of the general UK public. For this, we will
need to compare our deep-learning-powered Twit-
ter surveillance system with recorded public health
data. PHE runs a number of syndromic surveillance
systems across England. For this experiment, we
needed more Tweets outside of our labelled dataset
used for building the relevance filters. We used the
collection of unlabelled Tweets from our second col-
lection period, June 21, 2016 - August 30, 2016,
used earlier in our timing experiments. We per-
formed comparisons with relevant anonymised data
from PHE’s syndromic surveillance systems. These
systems work using primary care (general practitioner
in hours and out of hours) consultations, emergency
department (ED) attendances and telehealth (NHS
111) calls (Elliot et al., 2016). We performed a
retrospective analysis comparing the signals gener-
ated by these systems to the signal generated by our
deep-learning-powered Twitter surveillance system.
For this analysis, a number of ‘syndromic indica-
tors’ monitored by PHE’s syndromic surveillance sys-
tems were selected based upon their potential sensi-
tivity to air pollution and its related health complica-
tions. These indicators were “difficulty breathing”
and “asthma/wheeze/difficulty breathing”. We also
made use of “diarrhoea” as a control indicator. Dif-
ficulty breathing and diarrhoea were generated from
NHS 111 calls while asthma/wheeze/difficulty breath-
ing was generated from GP Out-of-hours (GPOOH)
consultations. For both indicators, daily counts of
consultations for relevant syndromic indicators, to-
gether with daily counts of the consultations over-
all were used to compute daily proportions of con-
sultations related to the indicators. We also did the
same for our Twitter surveillance system and com-
puted daily proportions of Tweets filtered through by
the deep learning classifiers relative to the number of
Tweets collected for filtering each day. We used these
daily proportions to plot time series shown in figure 2.
The time series signals were smoothed using a 7-day
average in order to reduce the irregularities caused by
the differences between weekend and weekday activi-
ties for GP out-of-hours services. Figure 2 shows that
the signals for asthma/wheeze/difficulty breathing and
Twitter with RNN filtering follow similar trends and
have similar shapes. The signal for diarrhoea on the
other hand, does not appear to relate to any others.
We also drew up a time series for the Twitter system
without filtering. To do this, we used the daily counts
of collected and preprocessed Tweets and normalised
each day’s count by the average Tweet count for that
week. We see in figure 2 that this raw Twitter signal
does not match well with the asthma/wheeze/difficulty
breathing signal. However, it still seems to match bet-
ter than that of diarrhoea. Another point worth noting
is that by looking at the signals for Twitter without
filtering and Twitter with deep learning filtering, we
can see that the deep learning filtering removes spuri-
ous activity peaks, making the signal closer and more
similar to the ground truth asthma/wheeze/difficulty
breathing signal. In order to gain a clearer picture
of how well the signals matched, we calculated the
Pearson correlations between them without any lag.
Factoring in lag into the correlation did not improve
the results. The results of this are shown in table
5. Table 5 confirms that deep learning filter does in-
Table 5: Pearson correlations and P-Values for extracted
Twitter signals with syndromic surveillance signals.
Twitter
with RNN
filtering
Twitter
without
filtering
GPOOH
Asthma/
Wheeze/
Difficulty
Breathing
0.637(p <
0.001)
0.555(p <
0.001)
NHS 111
Difficulty
Breathing
0.586(p <
0.001)
0.361(p <
0.001)
NHS 111
Diarrhoea
0.125(p =
0.3)
0.027(p =
0.8))
deed perform well and displays a moderate correla-
tion (r = 0.637) with the recorded public health data
for asthma/wheeze/difficulty breathing signal. The
Twitter signal without this filtering shows a lower cor-
relation with the ground truth (r = 0.555), and is less
than that of the deep learning filtered signal.
4.3 Keyword Analysis
Having established how different deep learning ar-
chitectures work in terms of their ability to filter
Tweets by relevance, we look at whether the ad-
ditional semantic information from the deep learn-
ing approaches can help us to select keywords when
streaming Tweets in order for the Tweets we collect
to be more likely to be relevant. Recall in section 2,
we hypothesised that words that are similar in mean-
ing to the keywords which worked well, could po-
tentially be keywords that bring in (more) relevant
Tweets. Now that we have semantic information for
each word which we learned from context by way of
our deep word embeddings, we use our GloVe vec-
tors to determine similar words to all our keywords.
Deep Learning for Relevance Filtering in Syndromic Surveillance: A Case Study in Asthma/Difficulty Breathing
497
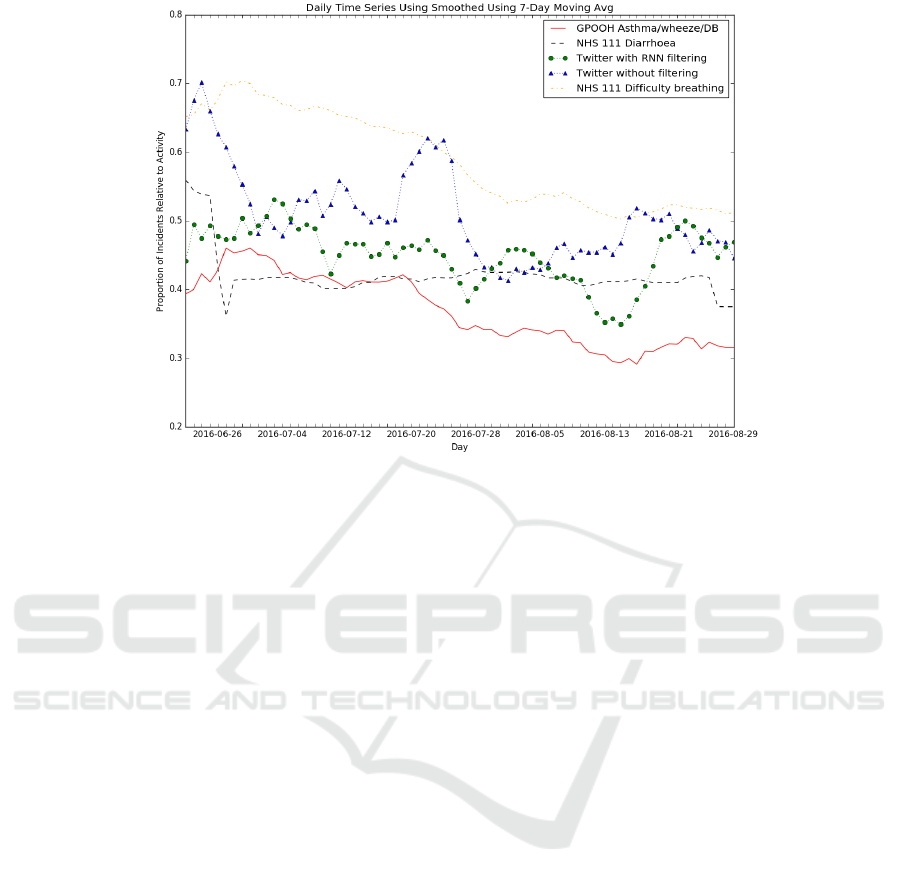
Figure 2: Comparison of PHE asthma/wheeze/difficulty breathing with Twitter systems.
We plot the word vectors for our keywords together
with the five words found to be closest. t-distributed
stochastic neighbour embedding (t-SNE) (Maaten and
Hinton, 2008) was used to reduce the dimensions of
the vectors to two to enable a 2D plot. Figure 3 shows
this plot. Distance within the plot represents distance
within the embedding space and as such, degree of
similarity. The plot shows that we are able to com-
putationally express semantics and in turn, similarity.
From figure 3, we see that for some keywords, the
words surrounding it are simply either misspellings or
singular or plural forms of the word. An example of
this is the keyword ‘breathe’ which has ‘breathing’
and ‘breath’ near it. Most of the time however, we
find that the words around them are similar but still
different enough to offer another perspective. Such
examples are the keywords ‘inhaler’ and ‘wheezing’.
From ‘inhaler’, we can come to the words ‘ventolin’
and ‘vicks’. Ventolin is a brand name for a drug
which can be present in inhalers used to treat breath-
ing problems while Vicks is an inhaler brand with
cough suppressants and topical analgesics. These are
both alternative words which an individual may use
when expressing potentially related issues to those
one might express using the word ‘inhaler’. Collect-
ing Tweets with these alternatives opens up access to
more relevant Tweets which would not have otherwise
been captured. From ‘wheezing’, we can come to the
words ‘coughing’, ‘shivering’ and ‘sniffling’. These
words describe additional symptoms one might find
in someone who was wheezing or suffering from res-
piratory problems. Because these additional words
are similar to our original keywords but not the same,
they could be used to collect more relevant Tweets
which may currently be missed. We believe this abil-
ity to enhance our understanding of keywords to be
an important contribution of the deep learning ap-
proaches.
5 DISCUSSION AND
CONCLUSION
We applied deep learning to Twitter for the surveil-
lance of asthma/difficulty breathing, reporting com-
parisons of different popular deep learning classi-
fiers and embeddings. We observed by comparing
F-measures that the RNN relevance filter was the
most accurate. This echoes numerous findings re-
porting the efficacy of RNNs for text classification
tasks (Yin et al., 2017). In this regard, our work con-
firms that their usefulness extends to Twitter and in
effect, short-text classification problems. However,
the RNN was also the slowest, so it may still be
worth using less complicated neural network architec-
tures for real-time processing required for syndromic
surveillance. Using the observed strongest method
from our comparisons, we were able to collect more
relevant data from Twitter by effectively removing
Tweets asymptomatic of asthma/difficulty breathing.
We found that a deep-learning-powered relevance fil-
tering system improved the quality of the detected
Twitter signal. Consequentially, a positive correla-
tion was found between Twitter activity concerning
ICPRAM 2019 - 8th International Conference on Pattern Recognition Applications and Methods
498
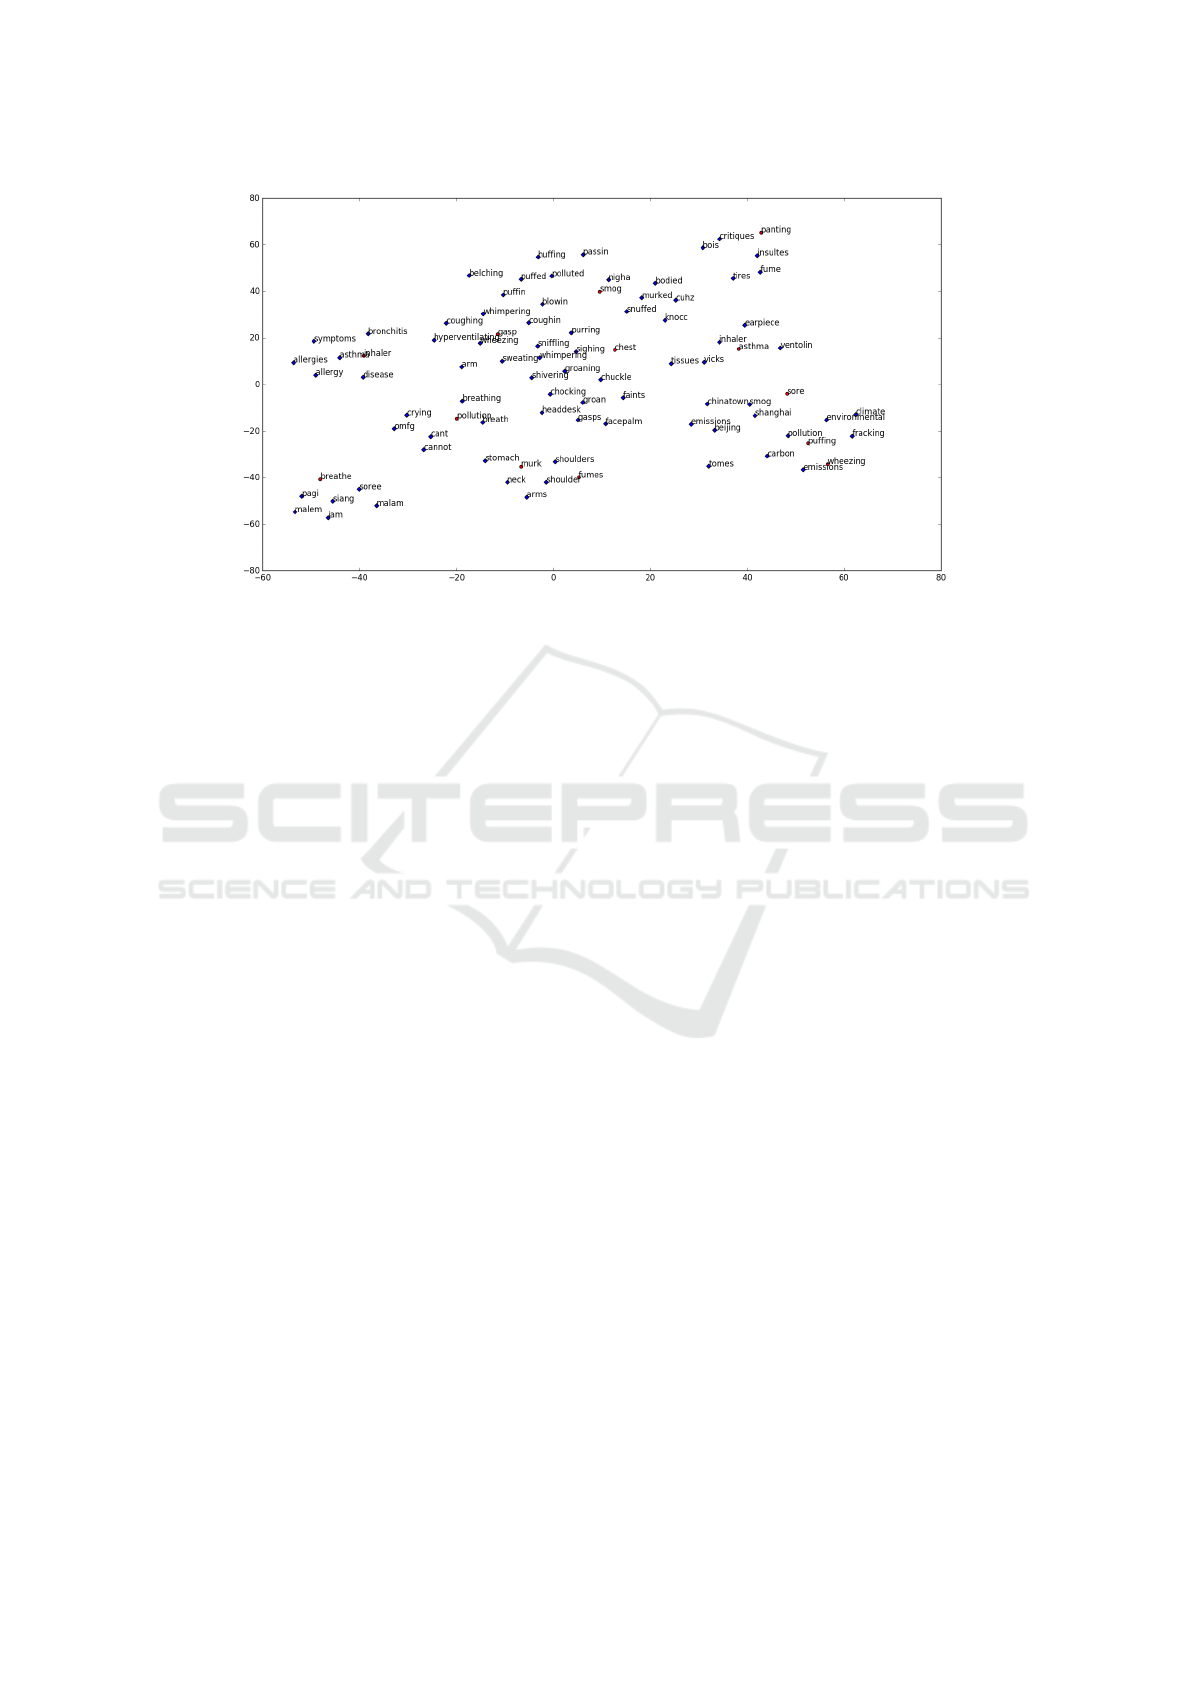
Figure 3: Plot of words representative of distances in embedding space. The axes represent t-SNE dimensional values. The
marker colour distinguishes keywords in red from similar words in blue.
asthma/difficulty breathing (which is quite noisy) and
syndromic surveillance data.
While we found moderate correlation between our
Twitter signal after deep learning filtering, we are yet
to assess the full detection capability of Twitter as
there were no real-world outbreaks or major incidents
while we performed our investigation and we only
had access to Twitter data from these periods. We in-
tend to repeat this analysis prospectively over a longer
time period, as this will allow us to determine whether
Twitter can detect any outbreaks. Another limitation
we consider stems from the fact that our syndromic
surveillance data was gathered with the geographical
scope of England. However, as described in section
4.1, due to the nature of the Twitter API, our tweet
collection process collects Tweets geolocated to the
UK or marked as originating from a place in the UK.
This makes the geographical scope of our Twitter data
(UK-level) larger than that of the syndromic surveil-
lance data (England-level). An additional investiga-
tion into Twitter location filtering needs to be carried
out in order to further fine-tune our syndromic surveil-
lance framework.
In addition, we found that by using deep learning
approaches, we could discern contextual/semantic in-
formation from our Twitter texts which we can use
to meaningfully expand our vocabulary for Tweet se-
lection. This could be a powerful feature in an adap-
tive system for Twitter data collection. We intend to
build on this by building an adaptive keyword selec-
tion system which intelligently and automatically de-
termines what keywords to use in requests when col-
lecting Tweets. The adaptive keyword system could
collect Tweets with an initial set of keywords and then
modify this set by including words it knows are simi-
lar to words that appear often in Tweets the relevance
filter finds relevant. It would also exclude words that
do not tend to appear in Tweets that the relevance filter
finds relevant. By repeatedly doing this over time, the
set of keywords used to collect Tweets will change.
This is a venture we will explore in our future work.
ACKNOWLEDGEMENTS
We acknowledge support from NHS 111 and NHS
Digital for their assistance and support with the NHS
111 system; Out-of-Hours providers submitting data
to the GPOOH syndromic surveillance and Advanced
Heath & Care. The authors also acknowledge sup-
port from the Public Health England Real-time Syn-
dromic Surveillance Team. Beatriz De La Iglesia and
Iain Lake receive support from the National Institute
for Health Research Health Protection Research Unit
(NIHR HPRU) in Emergency Preparedness and Re-
sponse.
REFERENCES
Broniatowski, D. A., Paul, M. J., and Dredze, M. (2013).
National and local influenza surveillance through twit-
ter: an analysis of the 2012-2013 influenza epidemic.
PloS one, 8(12):e83672.
Cassandra Harrison, M., Mohip Jorder, M., Henri Stern,
F. S., and Sharon Balter, M. Using online reviews
by restaurant patrons to identify unreported cases of
foodborne illness—new york city, 2012–2013.
Deep Learning for Relevance Filtering in Syndromic Surveillance: A Case Study in Asthma/Difficulty Breathing
499

Charles-Smith, L. E., Reynolds, T. L., Cameron, M. A.,
Conway, M., Lau, E. H., Olsen, J. M., Pavlin, J. A.,
Shigematsu, M., Streichert, L. C., Suda, K. J., et al.
(2015). Using social media for actionable disease
surveillance and outbreak management: a systematic
literature review. PloS one, 10(10):e0139701.
Chretien, J.-P., Burkom, H. S., Sedyaningsih, E. R.,
Larasati, R. P., Lescano, A. G., Mundaca, C. C.,
Blazes, D. L., Munayco, C. V., Coberly, J. S., Ashar,
R. J., et al. (2008). Syndromic surveillance: adapting
innovations to developing settings. PLoS medicine,
5(3):e72.
Elliot, A. J., Smith, S., Dobney, A., Thornes, J., Smith,
G. E., and Vardoulakis, S. (2016). Monitoring the
effect of air pollution episodes on health care con-
sultations and ambulance call-outs in england during
march/april 2014: A retrospective observational anal-
ysis. Environmental Pollution, 214:903–911.
S
,
erban, O., Thapen, N., Maginnis, B., Hankin, C., and Foot,
V. (2018). Real-time processing of social media with
sentinel: A syndromic surveillance system incorporat-
ing deep learning for health classification. Information
Processing & Management.
Fennell, K. (2017). Everything you need to know about
repeating social media posts. "[Online; posted 12-
March-2017]".
Ginsberg, J., Mohebbi, M. H., Patel, R. S., Brammer, L.,
Smolinski, M. S., and Brilliant, L. (2009). Detecting
influenza epidemics using search engine query data.
Nature, 457(7232):1012.
Graves, A. and Schmidhuber, J. (2005). Framewise
phoneme classification with bidirectional lstm and
other neural network architectures. Neural Networks,
18(5-6):602–610.
Haykin, S. (1994). Neural networks: a comprehensive foun-
dation. Prentice Hall PTR.
Hornik, K. (1991). Approximation capabilities of mul-
tilayer feedforward networks. Neural networks,
4(2):251–257.
Hripcsak, G. and Rothschild, A. S. (2005). Agreement,
the F-measure, and reliability in information retrieval.
Journal of the American Medical Informatics Associ-
ation, 12(3):296–298.
Jin, L. and Schuler, W. (2015). A comparison of word
similarity performance using explanatory and non-
explanatory texts. In Proceedings of the 2015 Con-
ference of the North American Chapter of the Associa-
tion for Computational Linguistics: Human Language
Technologies, pages 990–994.
Krizhevsky, A., Sutskever, I., and Hinton, G. E. (2012). Im-
agenet classification with deep convolutional neural
networks. In Advances in neural information process-
ing systems, pages 1097–1105.
Lamb, A., Paul, M. J., and Dredze, M. (2013). Separat-
ing fact from fear: Tracking flu infections on twitter.
In Proceedings of the 2013 Conference of the North
American Chapter of the Association for Computa-
tional Linguistics: Human Language Technologies,
pages 789–795.
Le, Q. and Mikolov, T. (2014). Distributed representations
of sentences and documents. In International Confer-
ence on Machine Learning, pages 1188–1196.
Li, J. and Cardie, C. (2013). Early stage influenza detection
from twitter. arXiv preprint arXiv:1309.7340.
Maaten, L. v. d. and Hinton, G. (2008). Visualizing data
using t-sne. Journal of machine learning research,
9(Nov):2579–2605.
Mikolov, T., Chen, K., Corrado, G., and Dean, J. (2013).
Efficient estimation of word representations in vector
space. arXiv preprint arXiv:1301.3781.
Mikolov, T., Karafiát, M., Burget, L.,
ˇ
Cernock
`
y, J., and
Khudanpur, S. (2010). Recurrent neural network
based language model. In Eleventh Annual Confer-
ence of the International Speech Communication As-
sociation.
Pennington, J., Socher, R., and Manning, C. (2014). Glove:
Global vectors for word representation. In Proceed-
ings of the 2014 conference on empirical methods in
natural language processing (EMNLP), pages 1532–
1543.
Requia, W. J., Adams, M. D., Arain, A., Papatheodorou, S.,
Koutrakis, P., and Mahmoud, M. (2018). Global asso-
ciation of air pollution and cardiorespiratory diseases:
a systematic review, meta-analysis, and investigation
of modifier variables. volume 108, pages S123–S130.
American Public Health Association.
Roeder, L. (2018). What twitter’s new rules mean for social
media scheduling. "[Online; posted 13-March-2018]".
Severyn, A. and Moschitti, A. (2015a). Twitter sentiment
analysis with deep convolutional neural networks. In
Proceedings of the 38th International ACM SIGIR
Conference on Research and Development in Infor-
mation Retrieval, pages 959–962. ACM.
Severyn, A. and Moschitti, A. (2015b). Unitn: Training
deep convolutional neural network for twitter senti-
ment classification. In Proceedings of the 9th inter-
national workshop on semantic evaluation (SemEval
2015), pages 464–469.
Triple, S. (2011). Assessment of syndromic surveillance in
europe. Lancet (London, England), 378(9806):1833.
Yin, W., Kann, K., Yu, M., and Schütze, H. (2017). Com-
parative study of cnn and rnn for natural language pro-
cessing. arXiv preprint arXiv:1702.01923.
Zeng, D., Chen, H., Lusch, R., and Li, S.-H. (2010). Social
media analytics and intelligence. volume 25, pages
13–16. IEEE.
ICPRAM 2019 - 8th International Conference on Pattern Recognition Applications and Methods
500
