
Egocentric Point of Interest Recognition in Cultural Sites
Francesco Ragusa
1,2
, Antonino Furnari
1
, Sebastiano Battiato
1
,
Giovanni Signorello
3
and Giovanni Maria Farinella
1,3
1
DMI-IPLab, University of Catania, Italy
2
Xenia Gestione Documentale s.r.l. - Xenia Progetti s.r.l., Acicastello, Catania, Italy
3
CUTGANA, University of Catania, Italy
Keywords:
Egocentric Vision, First Person Vision, Object Detection, Object Recognition.
Abstract:
We consider the problem of the detection and recognition of points of interest in cultural sites. We observe that
a “point of interest” in a cultural site may be either an object or an environment and highlight that the use of an
object detector is beneficial to recognize points of interest which occupy a small part of the frame. To study the
role of objects in the recognition of points of interest, we augment the labelling of the UNICT-VEDI dataset
to include bounding box annotations for 57 points of interest. We hence compare two approaches to perform
the recognition of points of interest. The first method is based on the processing of the whole frame during
recognition. The second method employs a YOLO object detector and a selection procedure to determine the
currently observed point of interest. Our experiments suggest that further improvements on point of interest
recognition can be achieved fusing the two methodologies. Indeed, the results show the complementarity of
the two approaches on the UNICT-VEDI dataset.
1 INTRODUCTION
The recognition of the points of interest observed by
the visitors of a cultural site can provide useful in-
formation to both the visitors and the site manager.
This information can be easily acquired by the visi-
tors by means of wearable devices equiped with a ca-
mera. The collected visual information can be pro-
cessed and used by the manager of the cultural site
to understand the visitors’ behaviour (e.g. How much
time did the visitors spend observing a specific point
of interest? What is the point of interest most viewed
by visitors?). Moreover, exploiting information rela-
ted to the visitors it is possible to suggest to them what
to see next, other points of interest related to what the
user is observing and to produce a personalized sum-
mary of the visit (Figure 1).
In this work, we focus on the recognition of points
of interest from egocentric images. A point of inte-
rest can be defined by the site manager as an entity
(e.g. object, architectural element, environment etc.)
for which it is interesting to estimate the attention of
visitors. Points of interest of a cultural site are those
elements which are usually provided with information
such that the visitors can understand what they are ob-
serving. As such, it can be an object or an area of an
environment, which increases variability in the recog-
nition. Figure 2 shows some examples of points of
interest such as paintings, environments or statues.
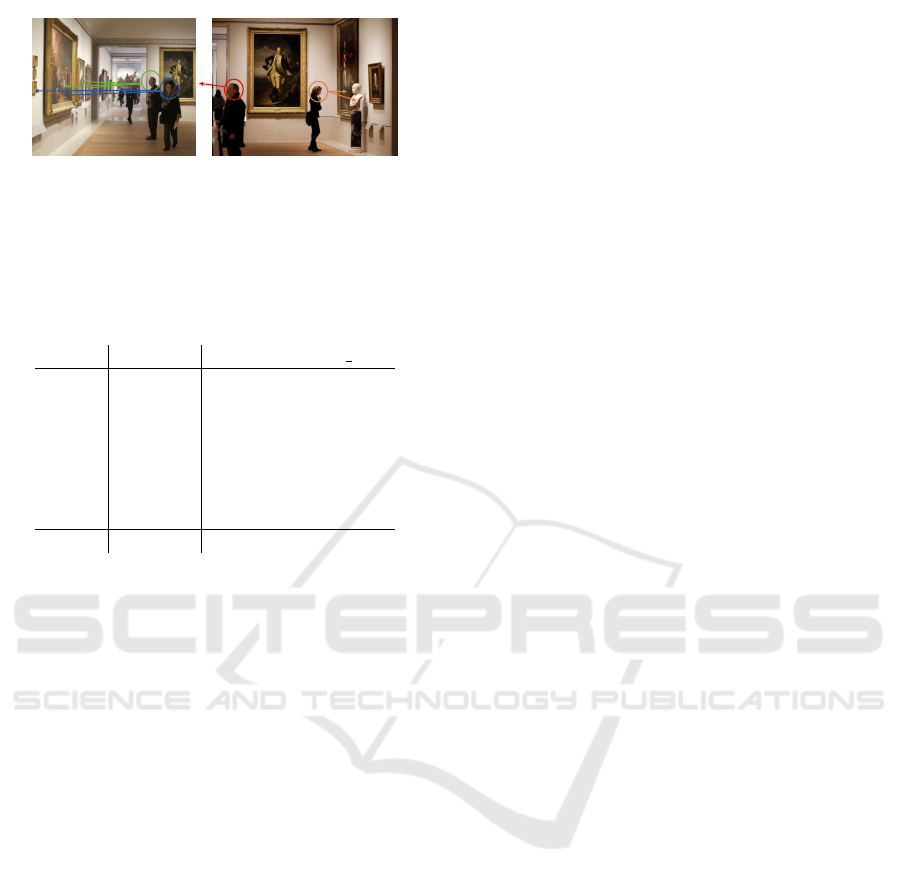
Past works have investigated the problem of esti-
mating the attention of visitors from fixed cameras.
However, this setup raises uncertainty about which
object the user is looking at when there are more neig-
hbouring objects. Figure 3 shows the constraints rela-
ted to third person vision with respect to this task. As
shown in the figure, there is ambiguity in understan-
ding what the visitors are looking at (left image) and
sometimes the point of interest observed by the user
is out of the scene (right image), due to the unconve-
nient position of the fixed camera.
To study the problem of detecting the points of in-
terest observed by the visitors of a museum, we consi-
der the UNICT-VEDI dataset (Ragusa et al., 2018a).
Despite the location of the user can be determined fee-
ding the image frame to a CNN and then performing
a temporal smoothing after a rejection procedure (Ra-
gusa et al., 2018a), in this paper we point out that the
exploitation of an object detector is key to obtaining
reasonable performance in the recognition of points
of interest. To study the role of objects in the recog-
nition of points of interest, we extended the UNICT-
VEDI dataset with bounding box annotation indica-
Ragusa, F., Furnari, A., Battiato, S., Signorello, G. and Farinella, G.
Egocentric Point of Interest Recognition in Cultural Sites.
DOI: 10.5220/0007365503810392
In Proceedings of the 14th International Joint Conference on Computer Vision, Imaging and Computer Graphics Theory and Applications (VISIGRAPP 2019), pages 381-392
ISBN: 978-989-758-354-4
Copyright
c
2019 by SCITEPRESS – Science and Technology Publications, Lda. All rights reserved
381
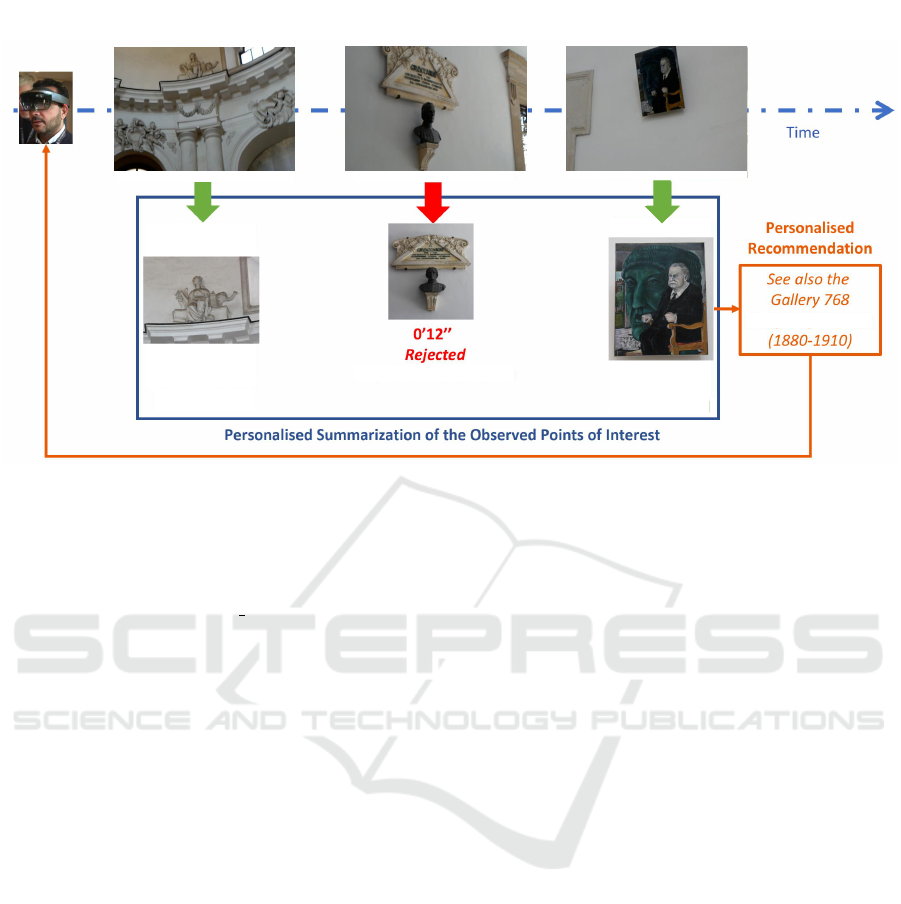
Wearable
Device
Acquired Images
Feedback to the Visitor
Observation Too Short
Images of Man
3’24’’ - Saved
6’16’’ - Saved
Figure 1: Example of recognition of points of interest from egocentric video and its use for summarization and recommenda-
tion.
ting the location of the points of interest in the image
frames. The dataset, along with the new annotation,
is publicy available for research purposes at the link:
http://iplab.dmi.unict.it/VEDI POIs/.
We compare two main approaches to detect points
of interest. The first one is based on scene recogni-
tion and consists in analyzing the whole frame trough
the method proposed in (Ragusa et al., 2018a), whe-
reas the second one employs a YOLO object detector
to recognize points of interest and a selection proce-
dure to determine the currently observed one when
more points of interest are in the scene at the same
time (Redmon and Farhadi, 2018). The results show
the clear advantages of using an object detector when
the points of interest to be recognized are elements
which occupy only part of the frame (e.g. paintings,
statues, etc.), whereas scene-based recognition works
best when the points of interest represent environ-
ments rather than objects. The contributions of this
work are the following:
• The observation of the dual nature of point of in-
terest in a cultural site, which include objects and
environments;
• The extension of the UNICT-VEDI dataset with
bounding box annotations;
• A comparison of approaches based on whole
scene processing whith respect to object detection
to recognize points of interest in cultural sites.
The rest of the paper is organized as follows. We
discuss the related work in Section 2. The details of
the extension of the UNICT-VEDI dataset are repor-
ted in Section 3. The two main approaches used in
this work are discussed in Section 4. The experimen-
tal settings and the results are presented in Section 5.
We give the conclusion and discuss future works in
Section 6.
2 RELATED WORK
Augmented Cultural Experience. Many previous
works investigated the use of Computer Vision to im-
prove visitor experience in cultural sites. The authors
of (Ragusa et al., 2018a; Ragusa et al., 2018b) per-
formed room-based localization in a museum to ana-
lyze the visitors’ behaviour with the aim to build sy-
stems able to provide services for the users (e.g. re-
commend what to see next, generate video memories
of the visit), as well as to produce information use-
ful for the manager of the cultural site (e.g. produce
statistics of the behaviour of the visitors in the cul-
tural site). Similar topics have also been studied in
(Kuflik et al., 2012). Past works investigated the use
of systems based on Computer Vision and wearable
devices (Cucchiara and Del Bimbo, 2014) to perform
object classification and artwork recognition (Taver-
riti et al., 2016) (Seidenari et al., 2017). These solu-
tions are useful to improve the visit and to assist tou-
rists through an augmented audio-guide (Portaz et al.,
2017) and to build context aware applications (Colace
et al., 2014). The authors of (Gallo et al., 2017) analy-
zed georeferenced images available on social media to
obtain detailed information of the visitors behavoiur.
VISAPP 2019 - 14th International Conference on Computer Vision Theory and Applications
382

Figure 2: Some examples of points of interest: paintings,
environments, statues and more. Note that the exhibited va-
riability makes recognition hard.
In (Signorello et al., 2015) it is proposed to explore
the fruition of protected natural sites starting from
multimodal navigation of multimedia contents. The
work of (Razavian et al., 2014) employed a system for
automatic detection of visual attention and identifica-
tion of salient items in museums and auctions. The
study in (Stock et al., 2007) explored the use of no-
vel techonologies for physical museum visits inside
the project “Personal Experience with Active Cultu-
ral Heritage” (PEACH). The authors of (Raptis et al.,
2005) reviewed mobile applications used in museums
focusing on the notion of context and its constituent
dimensions.
Localization of Visitors. Localization is one of the
desiderable component of an assistive system for cul-
tural sites. To assist the visitors, the users’ position
can be estimated using GPS in outdoor environments
and images in indoor environments. The additional
information to be provided to the user can be given in
the form of audio guides, illustrative panels, or holo-
grams in the case of augmented reality. The authors
of (Weyand et al., 2016) geolocalized photos captu-
red by tourists by training their model (PlaNet) on
millions of geotagged images. NavCog (Ahmetovic
et al., 2016) is a smarphone navigation system capa-
ble of assisting the users in complex indoor and out-
door environments using bluetooth low energy (BLE)
beacons. The authors of (Alahi et al., 2015) propo-
sed a novel representation of wireless data (emitted
by cell phones) embedded in the images to perform
localization. The authors of (Ragusa et al., 2018a)
considered the problem of localizing visitors in a cul-
tural sites from egocentric images to assist the user
during his visit and to provide behavioral information
to the manager of the cultural site.
Object Detection and Recognition. Different
works investigated how to detect and recognize
objects to describe an image, localize the objects
in the scene to enable a robot to assist a person
who suffers from some disorder, and to perform
tracking of a specific object. The authors of (Girshick
et al., 2014) and (Sermanet et al., 2014) proposed
deep model based for object recognition. Some
approaches classify image patches extracted from
region proposals (Girshick et al., 2014; Girshick,
2015; He et al., 2014), whereas others classify a
fixed set of evenly spaced square windows (Sermanet
et al., 2014). The authors of (Szegedy et al., 2014)
introduced the ideas of prior box and region proposal
network. As an evolution of (Girshick, 2015), the
authors of (Ren et al., 2015) replaced the heuristic
region proposal with RPN (Region Proposal Net-
work) inspired by MultiBox (Szegedy et al., 2014).
The authors of (Liu et al., 2016) leveraged RPN,
to directly classify objects inside each prior box.
(He et al., 2017) extended FasterRCNN by adding
a branch for predicting class-specific object masks,
in parallel with the existing bounding box regressor
and object classifier. The last version of YOLO
(Redmon and Farhadi, 2018), which is considered a
state-of-the-art real-time object detector, uses a novel
multi-scale training method and, following (Redmon
and Farhadi, 2016), proposes a technique to jointly
train on object detection and classification. A recent
work on optimization methods to train deep networks
for object detection and segmentation is reported in
(Wu and He, 2018). The approach proposed in (Law
and Deng, 2018) detects an object bounding box as
a pair of keypoints (top-left corner and bottom-right
corner) using a single CNN. An improvement to
bounding box localization has been proposed in
(Jiang et al., 2018) where IoU-Net is introduced. The
authors of (Koniusz et al., 2018) proposed a new
dataset (OpenMIC) that contains photos captured in
10 distrinct exhibition spaces of several museums
and explored the problem of artwork identification.
To the best of our knowledge object detection and
recognition in the context of cultural sites has been
less investigated. This is probably due to the absence
of large datasets in this context.
3 EXTENSION OF THE
UNICT-VEDI DATASET
We extended the UNICT-VEDI dataset proposed in
(Ragusa et al., 2018a) annotating with bounding
boxes the presence of 57 different points of interest in
a subset of the frames of the dataset. We only conside-
Egocentric Point of Interest Recognition in Cultural Sites
383
Third Person Vision
What are they looking at?
Third Person Vision
What are they looking at?
Where they are looking? - Point of View Ambiguity
Figure 3: The figure shows the constraints of using fixed ca-
meras to infer the attention of the visitors, such as ambiguity
on what the users see (on the left) and missing objects fal-
ling out of the scene (on the right).
Table 1: Total number of frames (second column) and num-
ber of frames annotated with bounding boxes for each test
video (third column) of the UNICT-VEDI dataset.
Name #frames # frames with b box
Test1 14404 444
Test2 7203 220
Test3 41706 929
Test4 22530 767
Test5 28195 786
Test6 7202 231
Test7 9923 296
Total 131163 3673
red data acquired using the head-mounted Microsoft
HoloLens device. The UNICT-VEDI dataset compri-
ses a set of training videos (at least one per point of in-
terest), plus 7 test videos acquired by subjects visiting
a cultural site. Each video of the dataset has been tem-
porally labeled to indicate the environment in which
the visitor is moving (9 different environments are la-
beled) and the point of interest observed by the visi-
tor (57 points of interest have been labeled). For each
of the 57 points of interest included in the UNICT-
VEDI dataset, we annotated approximately 1,000 fra-
mes from the provided training videos, for a total of
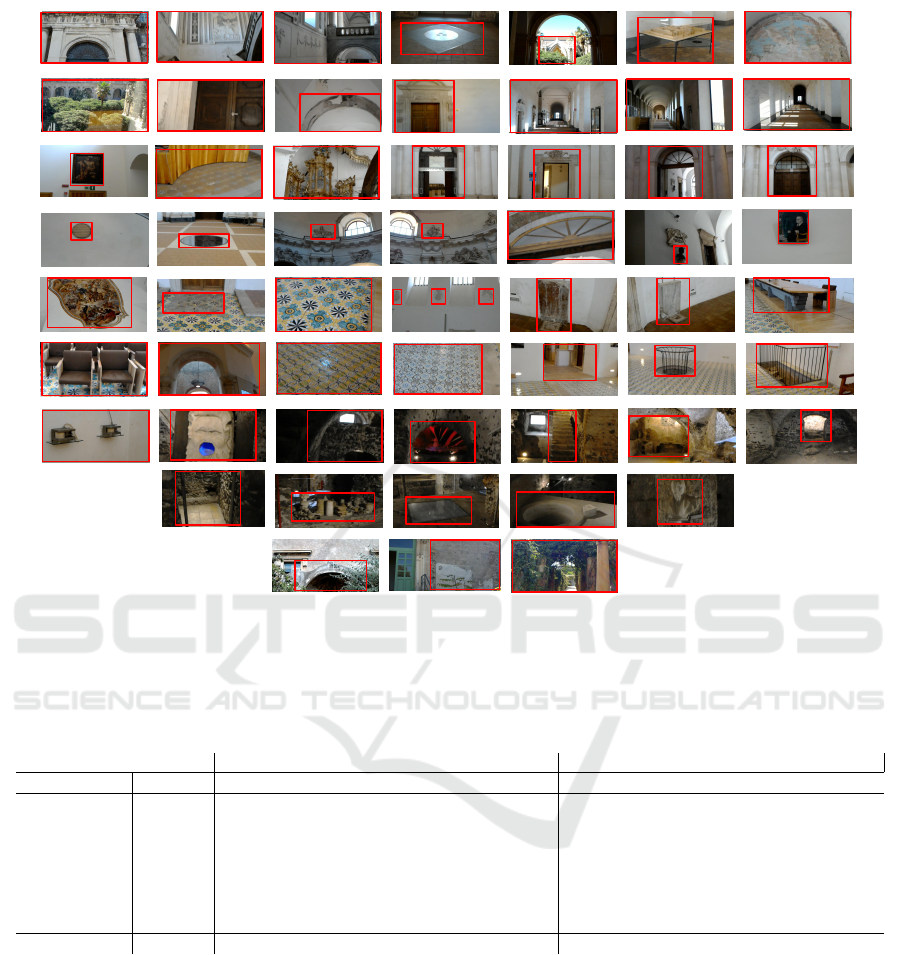
54, 248 frames. Figure 4 shows some examples of the
57 points of interest annotated with bounding boxes.
The test videos have been sub-sampled at 1 frame per
second and annotated with bounding boxes. Table 1
(third column) compares the number of frames anno-
tated with bounding boxes for each test video with re-
spect to the total numbers of frames (second column).
A frame is labeled as “negative” if it does not contain
any of the points of interest. Figure 5 shows the num-
ber of “negative” and “positive” frames belonging to
the 57 points of interest for each test video. The num-
ber of “negative” frames demonstrates that the user
often looks at something that is not a point of interest
and therefore it is important to correctly reject these
frames during the recognition procedure.
4 METHODS
Recognizing the points of interest observed by visi-
tors in a cultural site is the natural next step after vi-
sitor localization (Ragusa et al., 2018a). To this aim,
methods are required to predict, for each input frame,
the point of interest observed by the user or the occu-
rence of the “negative” class to be rejected. We com-
pare two approaches to recognize points of interest.
The first approach implements the method proposed
in (Ragusa et al., 2018a) for egocentric visitor locali-
zation based on a Convolutional Neural Network. It
consists of a pipeline composed by three main steps:
Discrimination, Rejection and Sequential Modelling.
It is worth to note that, with this approach, frames
are directly processed using a VGG 16 CNN and no
object detection is explicitly performed. The output
of this pipeline is a temporal segmentation of the in-
put egocentric video where each segment represents
one of the “positive” classes (one of the 57 points of
interest) or the “negative” one. We consider three dif-
ferent variants of this approach which are detailed in
the following.
57-POI: is the state-of-the-art method proposed in
(Ragusa et al., 2018a). The discrimination component
of the method is trained to discriminate between the
57 points of interest. No “negative” frames are used
for training. The rejection of negatives is performed
by the rejection component of (Ragusa et al., 2018a);
57-POI-N: is similar to the 57-POI method, with
the addition of a negative class. The discriminator
component of the method in (Ragusa et al., 2018a)
is trained to discriminate between 57 points of inte-
rest plus the “negative” class. In this case, negative
frames are explicitly used for training. The rejection
component of (Ragusa et al., 2018a) is further used to
detect and reject more negatives;
9-Classifiers: nine context-specific instances of the
method in (Ragusa et al., 2018a) are trained to recog-
nize the points of interest related to the nine different
contexts of the UNICT-VEDI dataset (i.e., one clas-
sifier per context). Similarly to 57-POI, no negatives
are used for training.
The second approach we consider in our study is
based on an object detector as described in the follo-
wing.
Object-based: A YOLOv3 object detector is used
to perform the detection and recognition of each of
VISAPP 2019 - 14th International Conference on Computer Vision Theory and Applications
384
2.1 2.2 3.1 3.2 3.3
3.4
3.5
3.6 3.7 3.8 3.9
3.10 3.11
4.1
4.2 4.3
5.1
5.2 5.3 5.4
5.5
5.6
5.7
5.8
5.9
5.10 6.1
6.2
6.3
6.4 6.5 6.6 6.7 6.8
6.9
7.1
7.2
7.3 7.4 7.5 7.6
7.7
8.1 8.2 8.3 8.4 8.5
8.6
8.7
8.8
8.9
8.10 8.11
9.1
9.2
9.3
1.1
Figure 4: Sample frames with bounding box annotations related to the the 57 points of interest of the UNICT-VEDI dataset.
Note that the annotations of some points of interest occupy the whole frame.
Table 2: Mean Average Precision (mAP) of YOLOv3 on the 7 test videos (2nd column). AP scores are reported for some
points of interest (POI) where the proposed method obtains high performances (3rd - 6th columns) and low performances (7th
- 10th columns). The last row shows the average of the mAP scores across the test videos. See Figure 4 for visual examples
of the considered points of interest.
High performance (AP) on POI x.y Low performance (AP) on POI x.y
mAP 4.2 5.5 5.10 6.2 2.1 2.2 3.9 3.11
Test1 35.04% 49.06% / / 100.00% 0.00% 55.81% 12.50% 78.00%
Test2 40.95% 55.41% / / / 56.25% / 11.96% /
Test3 47.01% 75.29% 100.00% 81.82% 79.67% 24.62% 12.50% 2.86% 25.74%
Test4 44.60% 66.33% 100.00% 71.43% / 19.44% 40.08% 12.33% 22.33%
Test5 45.92% 64.29% 100.00% / 94.74% 80.52% 0.00% 0.00% 10.17%
Test6 24.85% / / / / 27.47% 6.67% 14.29% 23.64%
Test7 28.84% / / 91.67% / 0.00% 63.21% 12.12% 8.75%
AVG (m)AP 38.17% 62.08% 100.00% 81.64% 91.47% 29.76% 29.71% 9.44% 28.11%
the 57 points of interest. At test time, YOLOv3 re-
turns the coordinates of a set of bounding boxes with
the related class scores for each frame. If no bounding
box has been predicted in a given frame, we reject the
frame and assign it to the “negative” class. If multi-
ple bounding boxes are found in a specific frame, we
choose the bounding box with the highest class-score
and assign its class to the frame. We have chosen
the YOLOv3 object detector (Redmon and Farhadi,
2018) because it is a state-of-the-art real-time object
detector.
5 EXPERIMENTS AND RESULTS
Table 2 reports the mean average precision (mAP) of
YOLOv3 trained on the considered dataset and tes-
ted on the labeled frames of the 7 test videos (2nd
column). By default, YOLO only displays objects
detected with a confidence score of 0.25 or higher.
We performed a validation procedure to optimize this
parameter testing the model on the validation video
“Test5” using 8 different threshold values (0.05, 0.1,
0.15, 0.2, 0.25, 0.3, 0.35, 0.4) . We found the best
Egocentric Point of Interest Recognition in Cultural Sites
385
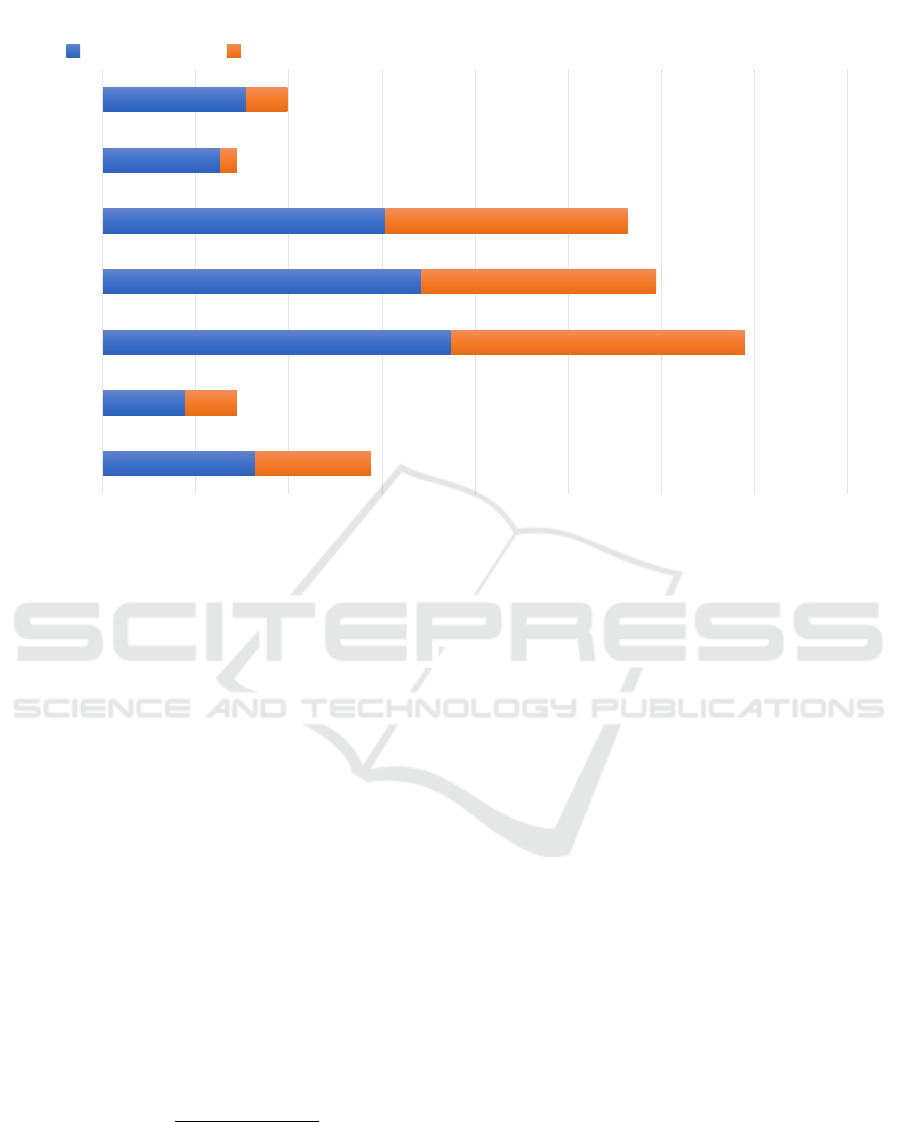
0 5000 10000 15000 20000 25000 30000 35000 40000
Test1
Test2
Test3
Test4
Test5
Test6
Test7
# frames
Ratio of positives/negatives frames
Positives Negatives
Figure 5: Number of positive frames belonging to the 57 points of interest compared to the number of negative frames (i.e.,
frames where there are not points of interest).
value to be 0.35 for which we obtain a F
1
-score
of 0.6751. Table 2 also reports the AP scores of
some points of interest on which the proposed method
obtains the highest performance (3rd - 6th columns)
and the lowest performance (7th - 10th columns). The
last row shows the average of the (m)AP scores across
the test videos. As can be noted from Table 2, de-
tecting points of interest is challenging in some ca-
ses. In particular, the detector achieves good results
for points of interests which represent objects occu-
pying a delimited part of the frame (e.g. see the point
of interest 5.5 in Figure 4). On the countrary, most of
the points of interest where the proposed method has
low performance are environments (see for instance
the point of interest 3.9 in Figure 4). Table 3 reports
the AP values obtained for each class in the 7 test vi-
deos. The last row shows the average of the (m)AP
scores for each test video.
To properly compare the approaches described in
Section 4 we use the F
1
score defined as follows:
F
1
= 2 ·
precision · recall
precision + recall
(1)
where precision and recall evaluate the proportion of
frames in which points of interest have been correctly
detected.
Table 4 compares the three temporal approaches
57-POI, 57-POI-N, 9-Classifiers with respect to the
approach based on object detection. The second co-
lumn of Table 4 (Discrimination) aims at assessing the
abilities of the methods to discriminate among points
of interest, in the absence of negatives. In this step,
negative frames have been excluded for the evalua-
tion. The rejection step is reported in the third column
and includes negative frames for the evaluation. The
last column represents the sequential modeling step
of (Ragusa et al., 2018a), where temporal smoothing
is applied. This evaluation was performed excluding
the “Test5” video which was used for parameter vali-
dation purposes.
Among the methods based on (Ragusa et al.,
2018a), the one named “9-Classifiers” achieves the
best performance in the rejection (F
1
-score of 0.64)
and sequential modeling steps (F
1
-score of 0.66).
This highlights the advantages of training separate
classifiers for each environment. Only minor im-
provements are obtained using negatives for training
(compare 57-POI with 57-POI-N in Table 4). Con-
sidering only the positive frames in the Discrimina-
tion phase (first column), the object-based method is
the best at discriminating the 57 points of interest (F
1
score of 0.78). Analysing the results obtained in the
other steps (considering the “negative” frames) the
performance obtained by the proposed method is bet-
ter than the one obtained by the 9-Classifiers appro-
VISAPP 2019 - 14th International Conference on Computer Vision Theory and Applications
386

Table 3: Mean Average Precision (mAP) of YOLOv3 on the 7 test videos. AP scores are reported for each point of interest
(POI) using a threshold of 0.35.
Class Test1 Test2 Test3 Test4 Test5 Test6 Test7 AVG
1.1 Ingresso 73,61% 40,00% 27,27% 53,85% 0,00% 37,50% 35,29% 38,22%
2.1 RampaS.Nicola 0,00% 56,25% 24,62% 19,44% 80,52% 27,47% 0,00% 29,76%
2.2 RampaS.Benedetto 55,81% / 12,50% 40,08% 0,00% 6,67% 63,21% 29,71%
3.1 SimboloTreBiglie 0,00% / 0,00% 0,00% 66,67% 0,00% 0,00% 11,11%
3.2 ChiostroLevante 0,00% / 0,00% 0,00% 35,14% 0,00% 0,00% 5,86%
3.3 Plastico / / / / 50,00% / / 50,00%
3.4 Affresco 0,00% / 22,73% 6,12% 36,84% 18,46% 0,00% 14,03%
3.5 Fin. ChiostroLev. 0,00% 0,00% / 0,00% 0,00% / / 0,00%
3.6 PortaCorodiNotte 8,89% 16,67% 15,91% 15,79% 7,50% 15,91% 35,90% 16,65%
3.7 TracciaPortone 0,00% / / 27,27% 50,00% 57,14% 14,29% 29,74%
3.8 StanzaAbate / / / / / / / /
3.9 Corr.DiLevante 12,50% 11,96% 2,86% 12,33% 0,00% 14,29% 12,12% 9,44%
3.10 Corr.CorodiNotte 58,93% 55,32% 61,08% 59,46% 35,77% 72,29% 64,58% 58,20%
3.11 Corr.Orologio 78,00% / 25,74% 22,33% 10,17% 23,64% 8,75% 28,11%
4.1 Quadro 80,65% 80,00% 47,62% 46,15% 66,67% / / 64,22%
4.2 Pav.OriginaleA. 49,06% 55,41% 75,29% 66,33% 64,29% / / 62,08%
4.3 BalconeChiesa 40,91% 52,94% 61,82% / 65,38% / / 55,26%
5.1 PortaAulaS.Mazz. 55,41% / 29,07% 36,36% 20,00% / / 35,21%
5.2 PortaIngr.MuseoF. 0,00% / 33,33% 36,67% 62,50% / / 33,13%
5.3 PortaAntirefettorio 0,00% / 40,91% 9,09% 0,00% / / 12,50%
5.4 PortaIng.Ref.Pic. 0,00% / 66,67% / / / / 33,34%
5.5 Cupola / / 100,00% 100,00% 100,00% / / 100,00%
5.6 AperturaPav. 88,89% / 100,00% 50,00% / / / 79,63%
5.7 S.Agata 100,00% / 45,83% 50,00% 88,89% / / 71,18%
5.8 S.Scolastica 0,00% / 25,00% 88,89% 97,62% / / 52,88%
5.9 ArcoconFirma / / 79,69% 100,00% 50,00% / 49,16% 69,71%
5.10 BustoVaccarini / / 81,82% 71,43% / / 91,67% 81,64%
6.1 QuadroS.Mazz. 90,00% / 76,92% / 92,31% / / 86,41%
6.2 Affresco 100,00% / 79,67% / 94,74% / / 91,47%
6.3 Pav.Originale 56,00% / 55,56% / 54,55% / / 55,37%
6.4 Pav.Restaurato 13,33% / 4,17% / 0,00% / / 5,83%
6.5 Bass.Mancanti 13,64% / 42,01% / 11,11% / / 22,25%
6.6 LavamaniSx 71,43% / 38,89% / 0,00% / / 36,77%
6.7 LavamaniDx 0,00% / 38,89% / 54,44% / / 31,11%
6.8 TavoloRelatori 0,00% / 62,02% / 0,00% / / 20,67%
6.9 Poltrone 39,25% / 15,54% / 25,00% / / 26,60%
7.1 Edicola / / 73,73% 53,85% 65,31% / / 64,30%
7.2 PavimentoA / / 7,84% 0,00% 15,38% / / 7,74%
7.3 PavimentoB / / 0,00% 0,00% 37,50% / / 12,50%
7.4 Passaviv.Pav.O. / / 53,57% 49,12% 43,59% / / 48,76%
7.5 AperturaPav. / / 28,57% 40,62% 44,74% / / 37,98%
7.6 Scala / / 70,00% / 60,00% / / 65,00%
7.7 SalaMetereologica / / 70,37% 86,21% 26,67% / / 61,08%
8.1 Doccione / / 23,53% 33,33% 42,59% / / 33,15%
8.2 VanoRacc.Cenere / / 87,50% / 100,00% / / 93,75%
8.3 SalaRossa / / 42,50% 45,24% 61,54% / / 49,76%
8.4 ScalaCucina / / 61,25% 42,11% 50,76% / / 51,37%
8.5 CucinaProvv. / / / 73,33% 82,61% / / 77,97%
8.6 Ghiacciaia / / 100,00% / 66,67% / / 83,34%
8.7 Latrina / / / 100,00% 50,00% / / 75,00%
8.8 OssaeScarti / / 68,33% 54,55% 63,16% / / 62,01%
8.9 Pozzo / / 80,00% 52,08% 85,71% / / 72,60%
8.10 Cisterna / / 13,89% 53,32% 25,00% / / 30,74%
8.11 BustoPietroT. / / 67,78% 70,59% 100,00% / / 79,46%
9.1 NicchiaePavimento / / 45,83% 31,94% 0,00% / / 25,92%
9.2 TraccePalestra / / 62,50% 70,59% 92,31% / / 75,13%
9.3 PergolatoNovizi / / / 60,05% 0,00% / / 30,03%
(m)AP 35,04% 40,95% 47,01% 44,60% 45,92% 24,85% 28,84% 38,17%
Egocentric Point of Interest Recognition in Cultural Sites
387

ach. Furthermore, the object-based method does not
employ any temporal smoothing and the latter is very
complex computationally, requiring the optimization
of several models in the training phase. It should be
noted that, in principle, the results of the object-based
method could be further improved introducing some
temporal smoothing mechanism, as well as a context-
specific approach and rejection mechanism.
Table 4: Comparison of the three scene-based approaches
and the proposed object-based approach using YOLOv3.
Discr. Reject. Seq. Modeling
57-POI 0.67 0.55 0.59
57-POI-N 0.53 0.56 0.62
9-Classifiers 0.61 0.64 0.66
Object-Based 0.78 0.68 /
We note that most of the improvement of the
object-based method is obtained for objects which
occupy only part of the frame, whereas most errors
are related to points of interest which occupy the
whole frame (e.g. points of interest which repre-
sent environments). Figure 6 compares some failure
cases for both 9-Classifier and object-based method.
The failure cases of the 9-Classifiers are represented
by the points of interest which occupy a part of the
frame and in the same frames the object-based met-
hod predicts the correct point of interest (first and se-
cond row). Instead, the failure cases of the object-
based method are represented by the points of inte-
rest which occupy the whole frame. In this case, the
9-Classifiers method predicts the correct labels (third
and fourth row). This observation is highlighted in
Table 5 and in Table 6. Specifically, Table 5 shows
the results after removing points of interest such as
“Ingresso” and “Sala Metereologica” which represent
environments. The best performance in this case is
obtained with the object detection both in the Discri-
mination phase (F
1
score of 0.82) and the in Rejection
phase (F
1
-score of 0.70), which outperforms the Se-
quential Modeling results of the other temporal met-
hods. Table 6 shows the results after removing points
of interest which represent objects (e.g. “Quadro”,
“Cupola”, etc.). In this case, the best perfomance is
obtained by the temporal method “9-Classifiers’ in the
Sequential Modeling phase (F
1
score of 0.71).
Table 5: Comparison of the three temporal approaches and
removing points of interest representing environments.
Discr. Reject. Seq. Modeling
57-POI 0.68 0.55 0.58
57-POI-N 0.52 0.56 0.61
9-Classifiers 0.60 0.64 0.66
Object-Based 0.82 0.70 /
Table 6: Comparison of the three temporal approaches and
the proposed object-based approach after removing points
of interest representing objects.
Discr. Reject. Seq. Modeling
57-POI 0.62 0.55 0.64
57-POI-N 0.55 0.57 0.66
9-Classifiers 0.65 0.66 0.71
Object-Based 0.58 0.56 /
Table 7 reports the performances for some points
of interest which represent objects (2nd - 6th co-
lumns), where the best results are obtained with the
objects-based method. The scores reported in Ta-
ble 7 are related to the sequential modeling step for
the 3 approaches based on (Ragusa et al., 2018a),
and to the negative rejection step for the object-based
method. Columns 7 - 11 of Table 7 show some
points of interest which represent environments. In
this case, the best performance is obtained using “9-
Classifiers” and the worst performance is obtained
using the object-based method. Table 8 reports the
performances of the all methods for all the 57 points
of interest. The table highlights the complementa-
rity of the 9-Classifiers and object-based methods. To
show which performance could be, in principle, obtai-
ned combining the different approaches, the last co-
lumn of Table 8 reports the maximum value for each
row. Such combination would obtain a mean F
1
score
of 0.75.
In sum, the approach based on object detection
allows to obtain results similar to the 9-Classifiers
approach (see Section 4) at a smaller computatio-
nal cost. Moreover, the results of the two met-
hods are in some cases complementary, which sug-
gest that further improvements can be achieved com-
bining the two methodologies. A video demo of the
object-based approach is publicy available at this link:
http://iplab.dmi.unict.it/VEDI POIs/ for a qualitative
analysis of the object detection based method.
6 CONCLUSION
We have investigated the problem of detecting and re-
cognizing points of interest in cultural sites. Starting
from the observation that a point of interest in a cultu-
ral site can be either an environment or an object, we
compared two different approaches to tackle the pro-
blem. The first approach is based on the processing
of the whole frame, while the second one exploits an
object detector to recognize points of interest in the
scene. To carry out the experimental analysis, we aug-
mented the UNICT-VEDI dataset by annotating with
bounding boxes the position of 57 points of interest
VISAPP 2019 - 14th International Conference on Computer Vision Theory and Applications
388
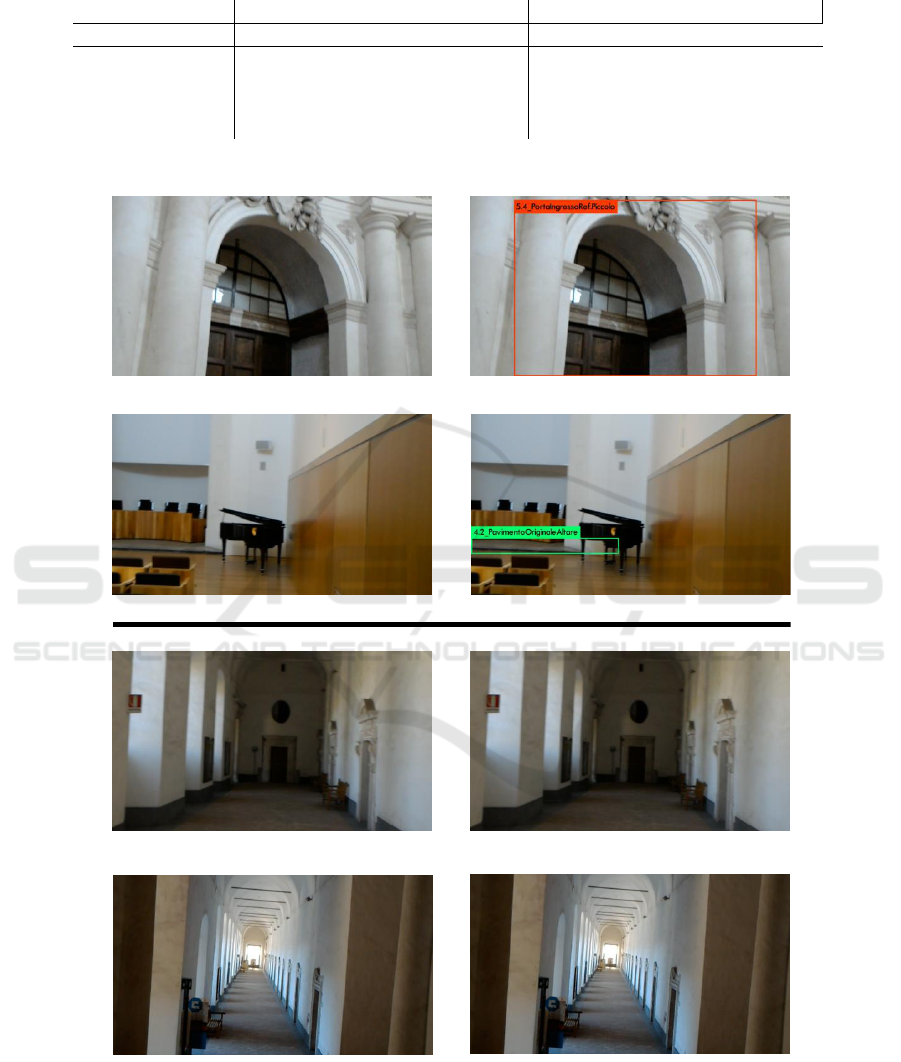
Table 7: Comparison of the three temporal approaches and YOLO considering some points of interest (POI) which represent
objects (2nd - 6th columns) and environments (7th - 11th columns).
Objects Environments
Point of Interest 4.2 5.1 5.3 5.4 8.10 2.1 3.9 3.11 7.7 8.3
57-POI 0.44 0.46 0.00 0.00 0.13 0.58 0.60 0.67 0.76 0.73
57-POI-N 0.64 0.59 0.00 0.00 0.00 0.57 0.49 0.67 0.75 0.81
9-Classifiers 0.46 0.48 0.40 0.00 0.00 0.64 0.81 0.81 0.98 0.84
Object-Based 0.69 0.75 0.79 0.86 0.44 0.47 0.23 0.44 0.82 0.57
9-Classifiers
Object-Based
Negative
Negative
3.9_CorridoiodiLevante
3.11_CorridoioOrologio
Negative
Negative
Figure 6: Comparison of the failure cases for both 9-Classifiers and object-based methods. The failure cases of the 9-
Classifiers are mainly points of interest which occupy a part of the frame (first and second row). Instead, the failure cases of
the object-based method are due to points of interest which occupy the whole frame (third and fourth row).
Egocentric Point of Interest Recognition in Cultural Sites
389
Table 8: Comparison of the three temporal approaches and object-based method considering the 57 points of interest. Best
results are in bold number.
Class 57-POI 57-POI-N 9-Classifiers object-based Per-row Max
1.1 Ingresso 0.70 0,68 0.68 0,50 0,70
2.1 RampaS.Nicola 0,58 0,57 0.64 0,47 0,64
2.2 RampaS.Benedetto 0,29 0,28 0.55 0,54 0,55
3.1 SimboloTreBiglie
0,00 0,00 0,00 0,00 0,00
3.2 ChiostroLevante / / / / /
3.3 Plastico / / / / /
3.4 Affresco 0,48 0,49 0.50 0,45 0,50
3.5 Finestra ChiostroLevante 0,00 0,00 0,00 0.02 0,02
3.6 PortaCorodiNotte 0,73 0,70 0.76 0,64 0,76
3.7 TracciaPortone 0,00 0,00 0.93 0,80 0,93
3.8 StanzaAbate / / / / /
3.9 CorridoioDiLevante 0,60 0,49 0.81 0,23 0,81
3.10 CorridoioCorodiNotte 0,76 0,88 0.92 0,78 0,92
3.11 CorridoioOrologio 0,67 0,67 0.81 0,44 0,81
4.1 Quadro 0,91 0,92 0,79 0,92 0,92
4.2 PavimentoOriginaleAltare 0,44 0,64 0,46 0.69 0,69
4.3 BalconeChiesa 0.87 0,82 0,86 0,68 0,87
5.1 PortaAulaS.Mazzarino 0,46 0,59 0,48 0.75 0,75
5.2 PortaIngressoMuseoFabbrica 0,37 0,42 0.91 0,53 0,91
5.3 PortaAntirefettorio 0,00 0,00 0,40 0.79 0,79
5.4 PortaIngressoRef.Piccolo 0,00 0,00 0,00 0.86 0,86
5.5 Cupola 0,91 0,49 0,87 0.99 0,99
5.6 AperturaPavimento 0,95 0,94 0,94 0.97 0,97
5.7 S.Agata 0,97 0,97 0,97 1.00 1,00
5.8 S.Scolastica 0,96 0.99 0,85 0,92 0,99
5.9 ArcoconFirma 0,72 0.83 0,77 0,77 0,83
5.10 BustoVaccarini 0,87 0.94 0,88 0,90 0,94
6.1 QuadroSantoMazzarino 0.96 0,81 0,68 0,81 0,96
6.2 Affresco
0,89 0,89 0,96 0.97 0,97
6.3 PavimentoOriginale 0,92 0,89 0,96 0.98 0,98
6.4 PavimentoRestaurato 0,48 0,60 0.74 0,33 0,74
6.5 BassorilieviMancanti 0,77 0,61 0.88 0,77 0,88
6.6 LavamaniSx 0,82 0,81 0.99 0,97 0,99
6.7 LavamaniDx 0,00 0,00 0.98 0,95 0,98
6.8 TavoloRelatori 0.88 0,69 / 0,75 0,88
6.9 Poltrone 0,56 0.87 0,47 0,28 0,87
7.1 Edicola 0,70 0,77 0.86 0,85 0,86
7.2 PavimentoA 0,00 0,00 0,42 0.58 0,58
7.3 PavimentoB 0,00 0,00 0,00 0.29 0,29
7.4 PassavivandePavimentoOriginale 0,57 0,58 0,68 0.80 0,80
7.5 AperturaPavimento 0.83 0,82 0,80 0,73 0,83
7.6 Scala 0,59 0,68 0,86 0.91 0,91
7.7 SalaMetereologica 0,76 0,75 0.98 0,82 0,98
8.1 Doccione 0,79 0,80 0.86 0,72 0,86
8.2 VanoRaccoltaCenere 0,35 0,40 0.47 0,44 0,47
8.3 SalaRossa 0,73 0,81 0.84 0,57 0,84
8.4 ScalaCucina 0,68 0.72 0,60 0,62 0,72
8.5 CucinaProvv. 0,66 0,62 0,81 0.83 0,83
8.6 Ghiacciaia 0,43 0.95 0,69 0,40 0,95
8.7 Latrina 0,98 0,98 0.99 0,75 0,99
8.8 OssaeScarti 0,64 0.77 0,72 0,69 0,77
8.9 Pozzo 0,41 0,90 0.94 0,87 0,94
8.10 Cisterna 0,13 0,00 0,00 0.44 0,44
8.11 BustoPietroTacchini
0,95 0,97 0.99 0,85 0,99
9.1 NicchiaePavimento 0,73 0,75 0.95 0,65 0,95
9.2 TraccePalestra 0,79 0.91 0,28 0,88 0,91
9.3 PergolatoNovizi 0.75 0,69 / 0,72 0,75
Negatives 0,46 0.62 0,60 0,55 0,62
mF
1
0.59 0.62 0.66 0.68 0.75
VISAPP 2019 - 14th International Conference on Computer Vision Theory and Applications
390

in several training and test frames. Experiments show
that the two methods achieve complementary perfor-
mance, which suggests that more improvement can be
obtained by combining the two approaches. Future
works will focus on integrating the two approaches to
improve point of interest recognition results.
ACKNOWLEDGEMENTS
This research is supported by PON MISE - Horizon
2020, Project VEDI - Vision Exploitation for Data
Interpretation, Prog. n. F/050457/02/X32 - CUP:
B68I17000800008 - COR: 128032, and Piano della
Ricerca 2016-2018 linea di Intervento 2 of DMI of
the University of Catania. The authors would like to
thank Francesca Del Zoppo and Lucia Cacciola for
the support in the labeling of the UNICT-VEDI data-
set.
REFERENCES
Ahmetovic, D., Gleason, C., Kitani, K. M., Takagi, H., and
Asakawa, C. (2016). Navcog: Turn-by-turn smartp-
hone navigation assistant for people with visual im-
pairments or blindness. In Proceedings of the 13th
Web for All Conference, W4A ’16, pages 9:1–9:2,
New York, NY, USA. ACM.
Alahi, A., Haque, A., and Fei-Fei, L. (2015). RGB-W:
When vision meets wireless. 2015 IEEE Internati-
onal Conference on Computer Vision (ICCV), pages
3289–3297.
Colace, F., De Santo, M., Greco, L., Lemma, S., Lombardi,
M., Moscato, V., and Picariello, A. (2014). A context-
aware framework for cultural heritage applications. In
Signal-Image Technology and Internet-Based Systems
(SITIS), 2014 Tenth International Conference on, pa-
ges 469–476. IEEE.
Cucchiara, R. and Del Bimbo, A. (2014). Visions for aug-
mented cultural heritage experience. IEEE MultiMe-
dia, 21(1):74–82.
Gallo, G., Signorello, G., Farinella, G., and Torrisi, A.
(2017). Exploiting social images to understand tou-
rist behaviour. In International Conference on Image
Analysis and Processing, volume LNCS 10485, pages
707–717. Springer.
Girshick, R. (2015). Fast r-cnn. In Proceedings of the IEEE
international conference on computer vision, pages
1440–1448.
Girshick, R., Donahue, J., Darrell, T., and Malik, J. (2014).
Rich feature hierarchies for accurate object detection
and semantic segmentation. In Proceedings of the
IEEE conference on computer vision and pattern re-
cognition, pages 580–587.
He, K., Gkioxari, G., Doll
´
ar, P., and Girshick, R. (2017).
Mask r-cnn. arXiv preprint arXiv:1703.06870.
He, K., Zhang, X., Ren, S., and Sun, J. (2014). Spatial
pyramid pooling in deep convolutional networks for
visual recognition. CoRR, abs/1406.4729.
Jiang, B., Luo, R., Mao, J., Xiao, T., and Jiang, Y. (2018).
Acquisition of localization confidence for accurate ob-
ject detection. In The European Conference on Com-
puter Vision (ECCV).
Koniusz, P., Tas, Y., Zhang, H., Harandi, M. T., Porikli, F.,
and Zhang, R. (2018). Museum exhibit identification
challenge for domain adaptation and beyond. CoRR,
abs/1802.01093.
Kuflik, T., Boger, Z., and Zancanaro, M. (2012). Analysis
and prediction of museum visitors’ behavioral pattern
types. In Ubiquitous Display Environments.
Law, H. and Deng, J. (2018). Cornernet: Detecting objects
as paired keypoints. In The European Conference on
Computer Vision (ECCV).
Liu, W., Anguelov, D., Erhan, D., Szegedy, C., Reed, S., Fu,
C.-Y., and Berg, A. C. (2016). Ssd: Single shot mul-
tibox detector. In European conference on computer
vision, pages 21–37. Springer.
Portaz, M., Kohl, M., Qu
´
enot, G., and Chevallet, J.-P.
(2017). Fully convolutional network and region pro-
posal for instance identification with egocentric vi-
sion. In Proceedings of the IEEE Conference on Com-
puter Vision and Pattern Recognition, pages 2383–
2391.
Ragusa, F., Furnari, A., Battiato, S., Signorello, G., and Fa-
rinella, G. M. (2018a). Egocentric visitors localization
in cultural sites. ACM Journal on Computing and Cul-
tural Heritage.
Ragusa, F., Guarnera, L., Furnari, A., Battiato, S., Signo-
rello, G., and Farinella, G. M. (2018b). Localiza-
tion of visitors for cultural sites management. In Pro-
ceedings of the 15th International Joint Conference
on e-Business and Telecommunications - Volume 2:
ICETE,, pages 407–413. INSTICC, SciTePress.
Raptis, D., Tselios, N. K., and Avouris, N. M. (2005).
Context-based design of mobile applications for mu-
seums: a survey of existing practices. In Mobile HCI.
Razavian, A. S., Aghazadeh, O., Sullivan, J., and Carlsson,
S. (2014). Estimating attention in exhibitions using
wearable cameras. 2014 22nd International Confe-
rence on Pattern Recognition, pages 2691–2696.
Redmon, J. and Farhadi, A. (2016). Yolo9000: Better, fas-
ter, stronger. arXiv preprint arXiv:1612.08242.
Redmon, J. and Farhadi, A. (2018). Yolov3: An incremental
improvement. CoRR, abs/1804.02767.
Ren, S., He, K., Girshick, R., and Sun, J. (2015). Faster R-
CNN: Towards real-time object detection with region
proposal networks. In Advances in neural information
processing systems, pages 91–99.
Seidenari, L., Baecchi, C., Uricchio, T., Ferracani, A., Ber-
tini, M., and Bimbo, A. D. (2017). Deep artwork de-
tection and retrieval for automatic context-aware au-
dio guides. ACM Transactions on Multimedia Com-
puting, Communications, and Applications (TOMM),
13(3s):35.
Sermanet, P., Eigen, D., Zhang, X., Mathieu, M., Fergus,
R., and Lecun, Y. (2014). Overfeat: Integrated recog-
Egocentric Point of Interest Recognition in Cultural Sites
391

nition, localization and detection using convolutional
networks. In International Conference on Learning
Representations (ICLR2014), CBLS, April 2014.
Signorello, G., Farinella, G. M., Gallo, G., Santo, L., Lo-
pes, A., and Scuderi, E. (2015). Exploring protected
nature through multimodal navigation of multimedia
contents. In International Conference on Advanced
Concepts for Intelligent Vision Systems, pages 841–
852.
Stock, O., Zancanaro, M., Busetta, P., Callaway, C., Krger,
A., Kruppa, M., Kuflik, T., Not, E., and Rocchi, C.
(2007). Adaptive, intelligent presentation of informa-
tion for the museum visitor in peach. 17:257–304.
Szegedy, C., Reed, S. E., Erhan, D., and Anguelov, D.
(2014). Scalable, high-quality object detection. CoRR,
abs/1412.1441.
Taverriti, G., Lombini, S., Seidenari, L., Bertini, M., and
Del Bimbo, A. (2016). Real-time wearable computer
vision system for improved museum experience. In
Proceedings of the 2016 ACM on Multimedia Confe-
rence, pages 703–704. ACM.
Weyand, T., Kostrikov, I., and Philbin, J. (2016). PlaNet
- Photo Geolocation with Convolutional Neural Net-
works, pages 37–55. Springer International Publis-
hing, Cham.
Wu, Y. and He, K. (2018). Group normalization. In The
European Conference on Computer Vision (ECCV).
VISAPP 2019 - 14th International Conference on Computer Vision Theory and Applications
392
