
Models of Learning to Classify X-ray Images for the Detection of
Pneumonia using Neural Networks
A. A. Saraiva
2,3 a
, D. B. S. Santos
2 b
, Nator Junior C. Costa
2 c
, Jose Vigno M. Sousa
1,2 d
,
N. M. Fonseca Ferreira
4,5 e
, Antonio Valente
3,6 f
and Salviano Soares
7 g
1
University Brazil, S
˜
ao Paulo, Brazil
2
UESPI-University of State Piau
´
ı, Piripiri, Brazil
3
School of Science and Technology, University of Tr
´
as-os-Montes and Alto Douro, Vila Real, Portugal
4
Department of Electrical Engineering, Institute of Engineering of Coimbra, Coimbra, Polytechnic Institute, Portugal
5
Knowledge Engineering and Decision-Support Research Center (GECAD) of the Institute of Engineering,
Polytechnic Institute of Porto, Portugal
6
NESC-TEC Technology and Science, Campus da FEUP, Rua Dr. Roberto Frias 378, 4200-465 Porto, Portugal
7
University of Tr
´
as-os-Montes and Alto Douro, Vila Real, Portugal
Keywords:
Pneumonia, CNN, MLP, Classification, k-Fold, Chest-X-Ray.
Abstract:
This article describes a comparison of two neural networks, the multilayer perceptron and Neural Network, for
the detection and classification of pneumonia. The database used was the Chest-X-Ray data set provided by
(Kermany et al., 2018) with a total of 5840 images, with two classes, normal and with pneumonia. to validate
the models used, cross-validation of k-fold was used. The classification models were efficient, resulting in an
average accuracy of 92.16% with the Multilayer Perceptron and 94.40% with the Convolution Neural Network.
1 INTRODUCTION
According to the World Health Organization report,
pneumonia killed 920,136 children under 5 years old
in 2015, accounting for 16% of all pediatric deaths
(Organization, 2015). Pneumonia is an acute respira-
tory infection that affects the lungs and can be caused
by bacteria, viruses or fungi .
Pneumonia is the leading cause of infectious
disease-related mortality in Western countries. How-
ever, the diagnosis of pneumonia is usually difficult in
the emergency setting, since clinical, biological and
imaging signs are not specific.
The unavailability of low-cost (Saraiva et al.,
2018a), field-deployable rapid diagnostic technol-
a
https://orcid.org/0000-0002-3960-697X
b
https://orcid.org/0000-0003-4018-242X
c
https://orcid.org/0000-0001-5636-424X
d
https://orcid.org/0000-0002-5164-360X
e
https://orcid.org/0000-0002-2204-6339
f
https://orcid.org/0000-0002-5798-1298
g
https://orcid.org/0000-0001-5862-5706
ogy (Saraiva et al., 2018d), (Saraiva et al., 2018g),
(Saraiva et al., 2018e), (Marques et al., 2018), is one
of the major challenges in combating pneumonia mor-
tality. Currently, there is an absence of gold stan-
dard for the diagnosis of pneumonia, even in hospitals
(Kosasih et al., 2015).
In this way, it inspired the design of an image
classifier (Saraiva et al., 2018b), in order to diag-
nose patients with pneumonia in an automated and
fast way. The method selected and implemented con-
stitutes a classification of chest X-ray images of pa-
tients, from which it is possible to identify whether or
not the patient has pneumonia. For the classification,
the Dataset Chest X-Ray was used in the total 5216
images provided by (Kermany et al., 2018).
The classification stage consists of two sub-
stages, where in the first classification is performed
by an artificial intelligence, consisting of a deep
learning known as Convolutional Neural Networks
(CNN) (Ponzio et al., 2018), (Mabaso et al., 2018),
(Lisowska et al., 2017), the second is to perform the
classification with a deep learning Multilayer Percep-
tron (MLP). The method covered ensures a robust
76
Saraiva, A., Santos, D., Costa, N., Sousa, J., Ferreira, N., Valente, A. and Soares, S.
Models of Learning to Classify X-ray Images for the Detection of Pneumonia using Neural Networks.
DOI: 10.5220/0007346600760083
In Proceedings of the 12th International Joint Conference on Biomedical Engineering Systems and Technologies (BIOSTEC 2019), pages 76-83
ISBN: 978-989-758-353-7
Copyright
c
2019 by SCITEPRESS – Science and Technology Publications, Lda. All rights reserved

coverage in image recognition (Saraiva et al., 2018f),
(Saraiva et al., 2018h), under certain assumptions that
will be clarified throughout the text.
The document is divided into 7 sections, in which
section 2 is characterized by the contextualization of
the work. It follows the methodology applied and the
validation metrics in section 3. The description of the
database is in section 4, the results after the applica-
tion of the proposal in section 5, section 6 deals with
the discussions and conclusion in the section 7.
2 CONTEXTUALIZATION OF
WORK
It is possible to observe in the work of (Lakhani
and Sundaram, 2017), the effectiveness of the use
of deep convolutional neural networks (DCNNs) for
the detection of Tuberculosis through four sets of
HIPAA data and two different DCNNs, AlexNet and
GoogLeNet.
(Rajpurkar et al., 2017), CheXNet is a 121-
layer convolutional neural network trained in ChestX-
ray14, capable of detecting pneumonia by checking
thoracic radiographs, which when compared to the
performance of four practicing academic radiologists,
CheXNet is able to overcome professionals.
In (Becker et al., 2018), evaluates the viability of
using Deep Learning and classification of pathologi-
cal patterns in a set of digital photographs of chest X-
ray images of patients with tuberculosis, using diag-
noses of the same it was possible to analyze patholog-
ical patterns in classes: cavity, consolidation, stroke,
interstitial changes, miliary pattern or normal exami-
nation.
(Xue et al., 2018), demonstrates a method of
sexual identification through frontal thoracic radio-
graphs, motivated by the need to determine missing
gender information in some datasets employing the
Deep Learning-based convolutional neural network
(CNN) technique and learning transfer, with an ac-
curacy of 86, 6 % and ROC area with 0.932 for 5-fold
cross-validation.
According to Becker, (Hooda et al., 2017) It points
out a potential method for the detection of tubercu-
losis using deep learning, which classifies RXT im-
ages into two categories, that is, normal and abnor-
mal. Using the CNN architecture with 7 convoluted
layers and 3 fully connected layers.
(Vajda et al., 2018), consists of an automatic anal-
ysis and classification of chest radiographs can be
used as a reliable alternative to more sophisticated
and technologically demanding methods (eg culture
or smear analysis), with a fully automatic TB screen-
ing system processing the CXRs of thorax) and apply-
ing image preprocessing techniques to improve image
quality, followed by adaptive segmentation based on
model selection.
The study of (Sivaramakrishnan et al., 2017), aims
to visualize salient network activations in a Deep
Learning model based on Convolutional Neural Net-
work (CNN), applied to the challenge of the chest
X-ray screening. Computer-aided detectio software
using machine learning approaches was developed to
analyze CXRs for abnormalities in order to reduce de-
lays in configurations with limited resources.
3 MATERIALS AND METHODS
In This Section, it will be presented the structure of
the adopted systems, to resolve the classification of
pneumonia, classifying them as normal or with pneu-
monia, will also be presented the entire structure of
the algorithms as well as the evaluation metrics.
3.1 Structure of the System
In Figure 1 it is possible to visualize the structure of
the system, in which the steps consists of the follow-
ing order: acquisition of the images, soon after k-fold
is used in order to divide the training and test data.
Preprocessing is about normalizing the data, ie past
grayscale images and all pixels are divided by 255 to
transform them into floating points. Finally, the clas-
sification of the images with the two proposed learn-
ing models is done.
Two learning models, neural networks known as
CNN and MLP, are described, described in the sec-
tions below. In Figures 3 and 5 it is possible to ob-
serve the structure of both neural networks. In the
step of predicting test data the input of the test im-
ages separated by the k-fold algorithm is performed
and the accuracy is collected. The process is repeated
5 times, changing the test and training images follow-
ing the calculation of k-fold.
Figure 1: Construct, training and validate of the model.
CNN and MLP processing was performed using a
6 GB NVIDIA GTX 1060 video card, which has 1280
Models of Learning to Classify X-ray Images for the Detection of Pneumonia using Neural Networks
77
CUDA cores and an Intel Core i7 processor with 12
Gigabytes of RAM, although most of the processing
is done per video card, since CNN and MLP can run
on GPUs, if available.
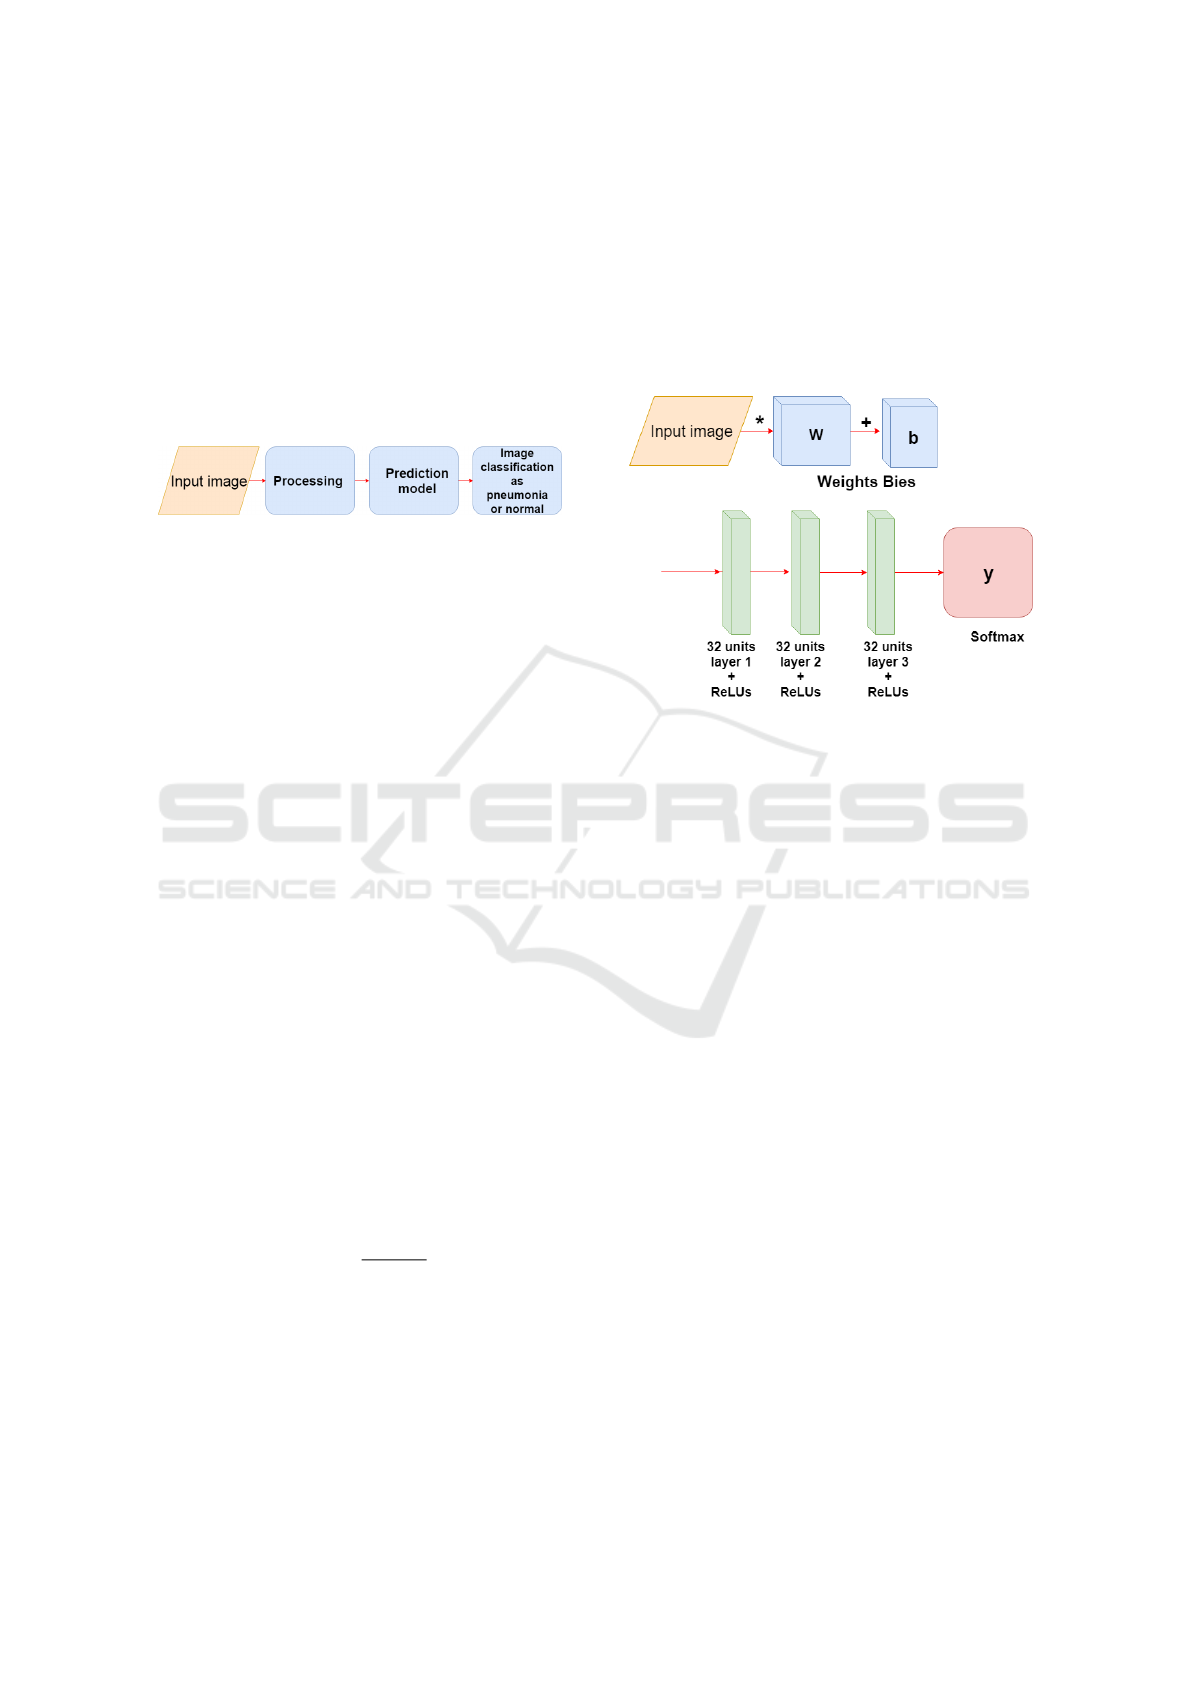
In Figure 2, one can observe the operation of the
models soon after the training, this process consists
of the input of the image, then the pre-processing is
done and finally the image is predicted with the model
(CNN or MLP ), where the image is classified as nor-
mal or pneumonia.
Figure 2: Image input and prediction.
3.2 MLP
MLP is an artificial feedforward neural network class,
consisting of at least three node layers, except for the
input nodes, each node is a neuron that uses a nonlin-
ear activation function (Tang et al., 2016). The MLP
uses a supervised learning technique called backprop-
agation for training (Pham et al., 2017).
Its multiple layers and non-linear activation distin-
guish MLP from a linear perceptron in this way one
can distinguish data that are not linearly separable.
(Pham et al., 2017). In Figure 3 a network composed
of five layers is presented, one layer being input, three
hidden layers with the function Rectified Linear Unit
(ReLU) and an output layer with the function Soft-
max.
In the equations 1 and 2 it is possible to verify the
function ReLU, responsible for calculating the output
of a node according to its input in a neuron.
f (x) = x
+
= max(0,x) (1)
f (x) =
(
0 for x < 0
x for x ≥ 0
(2)
In the equation 3 it is possible to see the softmax
function, where z is an input vector for output layer,
in this work if there are 2 output classes, then z is a
vector of two elements. E j indexes the output units.
σ(z)
j
=
e
z
j
∑
K
k=1
e
z
k
(3)
In the 4 equation we have the function responsible
for calculating the loss, called a cross-entropy, where
D represents the distance and receives two lists, p and
q. where the loss is calculated.
D(p,q) = −
∑
x
p(x) logq(x). (4)
The figure 3, consists of the structure of the model
of the MLP used, at the beginning one has the input
layer where the images are multiplied by the weights
and added to the bies, later the hidden layers of the
network are defined, three layers, with ReLUs activa-
tion functions. The first layer has 32 units the second
64 and the third 128, in the layer of output, last layer,
the softmax function is used.
Figure 3: Construction of the MLP training model.
3.3 CNN
CNNs are similar to traditional neural networks, both
are composed of neurons that have weights and bias
that need to be trained. Each neuron receives some in-
puts, applies the scalar product of inputs and weights
in addition to a non-linear function (Chen et al.,
2017).
A CNN consists of a sequence of layers Figure 5,
in addition to the input layer, which usually consists
of an image with width and height, there are three
main layers: convolutional layer, Pooling layer and
fully connected layer. In addition, after a convolu-
tional layer it is common an activation layer normally
a linear rectification unit function (ReLUs) equations
1, 2. These layers, when sequenced (or stacked), form
an architecture of a CNN (Salamon and Bello, 2017).
3.3.1 Convolutional Layer
This layer is composed of a set of filters (kernels) ca-
pable of learning according to a training (Ustinova
et al., 2017). The kernels are small matrices that in
this case was used the size 3x3 to obtain a better pre-
cision in the time to go through the matrix of the im-
ages, composed by real values that can be interpreted
as weights.
Given a two-dimensional image, I, and a small ar-
ray, K of size h x w (kernel), the convoked image, I
* K, is calculated by overlapping the kernel at the top
BIOIMAGING 2019 - 6th International Conference on Bioimaging
78
of the image of all possible shapes, and recording the
sum of the elementary products between the image
and the kernel equation 5.
(I ∗ K)
xy
=
h
∑
i=1
w
∑
j=1
K
i j
.I
x+i−1,y+ j−1
(5)
The kernels are convolved with the input data to
get a feature map. These maps indicate regions in
which specific features in relation to kernels. The ac-
tual values of the kernels change over the course of
the training causing the network to learn to identify
significant regions to extract characteristics from the
data set (Maggiori et al., 2017), so each filter results in
an output of a three-dimensional array. In the convo-
lution results matrices the ReLU activation function,
equations 1, 2 are applied. in each element of the con-
volution result.
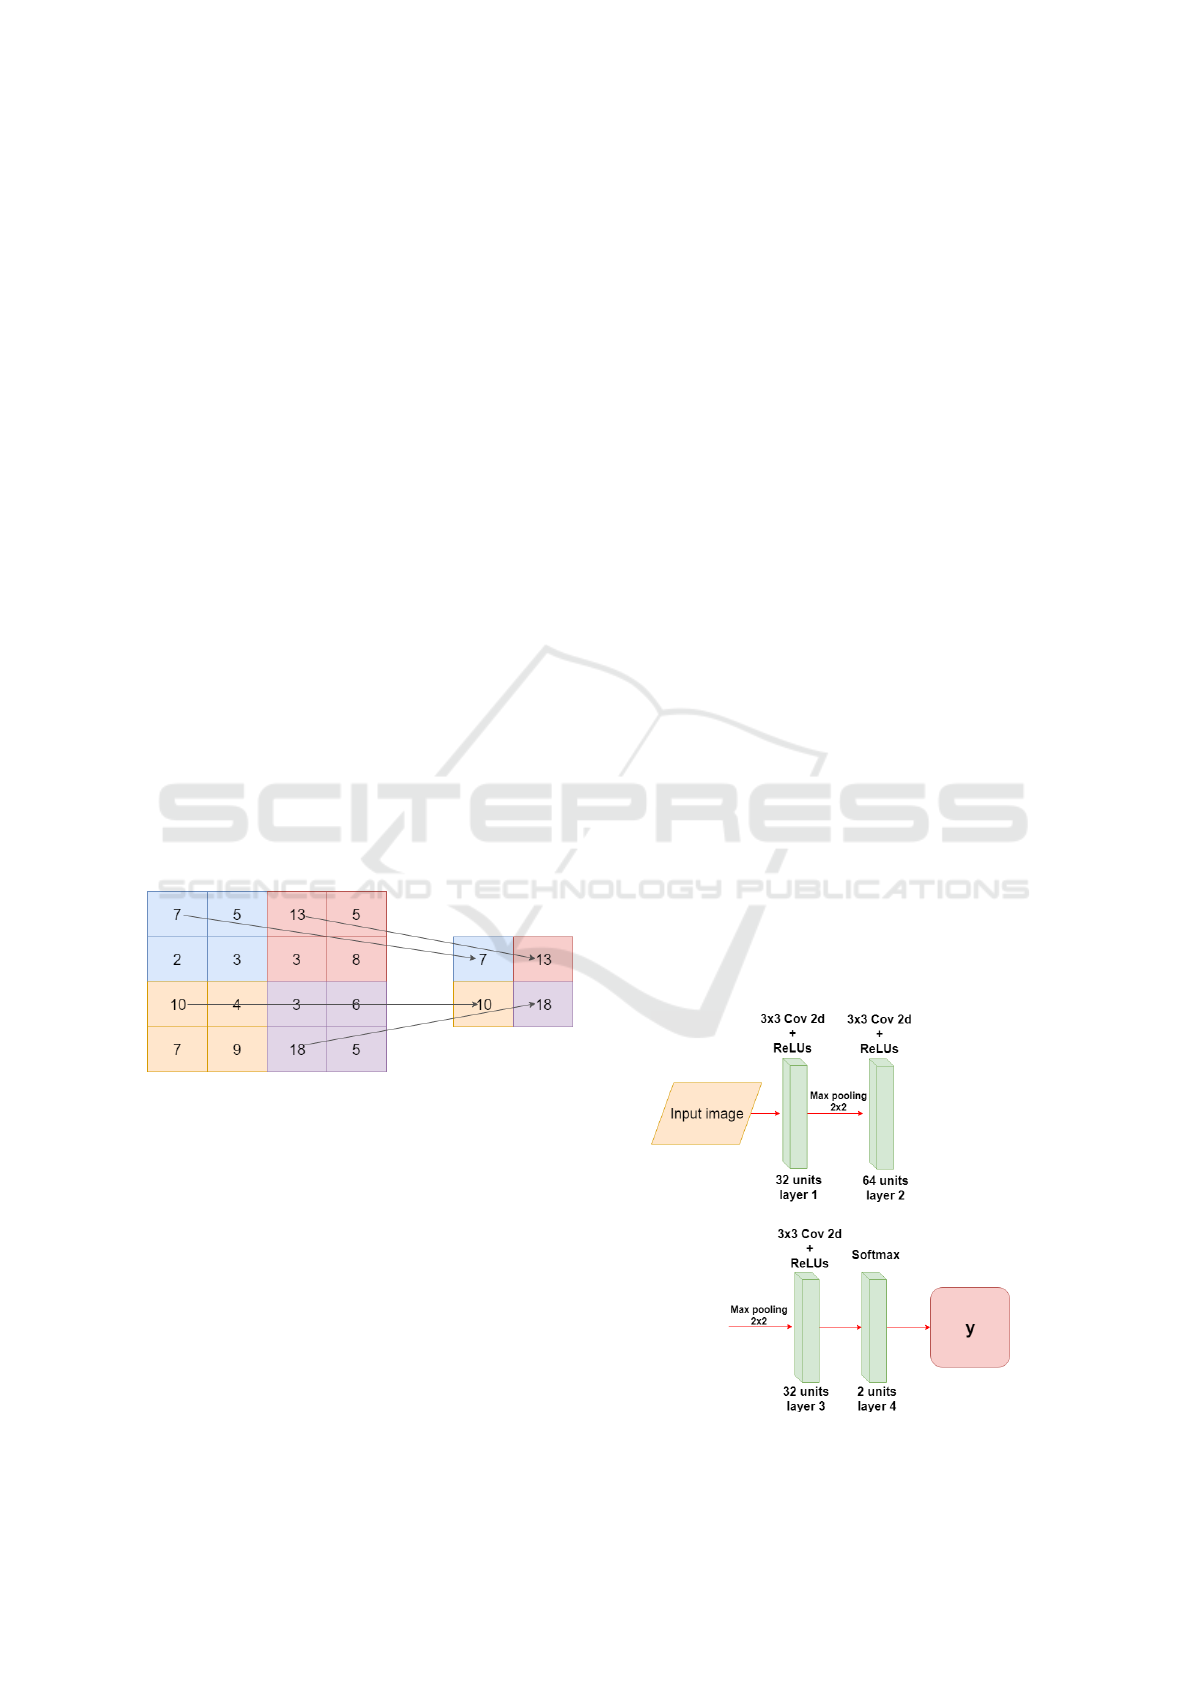
3.3.2 Pooling Layer
After a convolution layer exists a pooling layer, the
pooling technique is used to reduce the spatial size of
the resulting convolution matrices, according to the
figure 4. Consequently, this technique reduces the
amount of parameters to be learned in the network,
contributing to the control of overfitting, ie avoiding
the condition when a trained model works very well
in training data, but does not work very well in test
data (Yu et al., 2017).
Figure 4: Example max-pooling with a 2x2 image.
The maximum pool operation reduces the size of
the resource map, this operation can be described by
the equation equation 6. Let S be the value of the
passed and Q x Q the shape of the feature map before
the maximum grouping and p determines the cluster-
ing max-pooling size (Havaei et al., 2017). The output
of the max-pooling operation would be D x D size.
D = (Q − p)/S + 1 (6)
3.3.3 Fully Connected Layer
The fully connected layer comes after a convolutional
or pooling layer, it is necessary to connect each ele-
ment of the convolution output matrices to an input
neuron. The output of the convolutional and pooling
layers represent the characteristics extracted from the
input image.
The last layer of the network uses softmax as the
activation function, equation 3. This function receives
a vector of values as input and produces the
The technique known as dropout is also used in
the fully connected layer to reduce training time and
avoid overfitting. This technique consists in randomly
removing a certain percentage of neurons from a layer
at each training iteration, re-adding them to the next
iteration (Kov
´
acs et al., 2017).
3.3.4 CNN Architecture
In Figure 5 the CNN architecture is displayed, it has
three convolution layers and the last one is fully con-
nected, the input of the network receives a 150x150
pixel image, each convolution layer has the ReLUs
activation function. For the convolution kernel, the
3x3 size was adopted, because this way it is possible
to have a greater precision in the time to go through
the entire image.
After each convolutional layer a Max-pooling
layer is used, in this way the size of the matrices re-
sulting from the convolution is reduced. With this
layer it is possible to reduce the amount of parame-
ters that will be learned by the network, this way it is
done overfitting control.
In the fully connected layer the sorftmax activa-
tion function is used, this function is responsible for
making the probabilistic distribution of the input im-
age belong to each of the classes in which the network
was trained. To reduce the training time and to avoid
Figure 5: Construction of the CNN training model.
Models of Learning to Classify X-ray Images for the Detection of Pneumonia using Neural Networks
79
overfitting is used dropout in the layer, ie it is ran-
domly removed at each training interaction, a certain
percentage of the neurons of a layer, re-adding them
in the following iteration.
4 DESCRIPTION OF THE
DATASET
The set of images contains 5863 X-ray (JPEG) images
and 2 categories (Pneumonia / Normal) provided by
the (Wang et al., 2017).It is possible to visualize in
the figures 6 e 7.
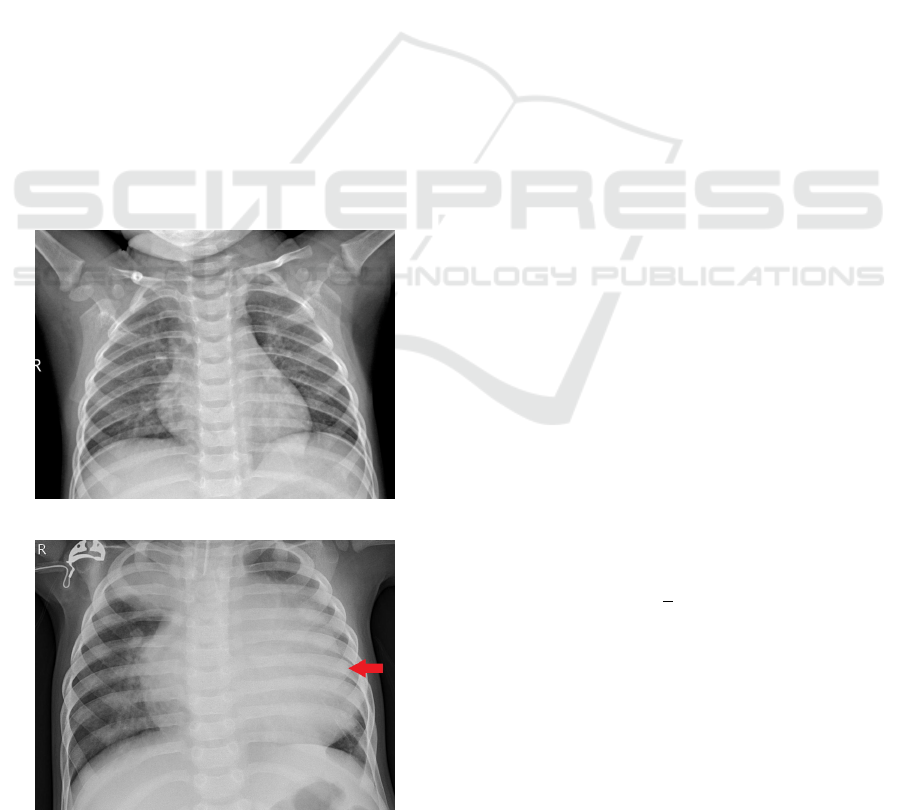
Chest x-ray images (anteroposterior) were se-
lected from pediatric patients aged one to five years.
The image comes from Guangzhou Women and Chil-
dren’s Medical Center. All chest X-ray images were
performed as part of the routine clinical care of the
patients (Wang et al., 2017).
The dataset still has quality control, where illegi-
ble and low-quality images have been removed. The
diagnosis was classified by two specialist doctors and
checked by a third expert in order to extinguish the
errors (Wang et al., 2017).
The dataset consists of 5863 images, being 1575
images of normal patients and 4288 of patients with
Figure 6: Normal.
Figure 7: Pneumonia.
pneumonia. To create the learning model, it was nec-
essary to balance the images.
Pneumonia causes pulmonary consolidation, this
means that the pulmonary alveoli are filled with in-
flammatory fluid, this fluid replaces the air in the
alveoli, so that the affected part of the lung does not
contain air (Iorio et al., 2018). In the radiographic,
pulmonary consolidation corresponds to an opacity
(whitish area).
The identification of the existence of pneumonia
is based on the opacities of the radiography, that is,
the radiograph shows the darker part near the spine
that corresponds to the bronchi (Kunz et al., 2018).
The air contained in the bronchi gives this color to
the radiograph, while the outside of the lung is lighter
(opaque) because the alveoli are filled with fluid Fig-
ure 7.
5 METRICS OF THE
EVALUATION
5.1 Cross Validation
Cross-validation is an evaluation technique on the
ability of generalization models, from a dataset, is
widely used in problems where the object is the mod-
eling and prediction (Vehtari et al., 2017). With this it
is possible to estimate how precise the model is, that
is, its accuracy with data that it does not know.
The k-fold cross-validation method consists of di-
viding the total set into k subsets of the same size, one
subset is used for testing, and the other k-1 subsets
for training. This process is repeated by k times, if
circularly changing the subset of tests (Grimm et al.,
2017).
The final precision of the model is estimated by
equation 7, at where Ac
f
is the sum of the differences
between the actual value y
i
and the predicted value ˆy
i
and k is the amount of k-fold divisions. With this it
is possible to infer the generalization capacity of the
network.
Ac
f
=
1
k
k
∑
i=1
(y
i
− ˆy
i
) (7)
5.2 Confusion Matrix
As a statistical tool we have the confusion matrix that
provides the basis for describe the accuracy of the
classification and characterize the errors, helping re-
fine the ranking (Saraiva et al., 2018c).
The measures derived from the confusion ma-
trix are: the total accuracy being that chosen by the
BIOIMAGING 2019 - 6th International Conference on Bioimaging
80
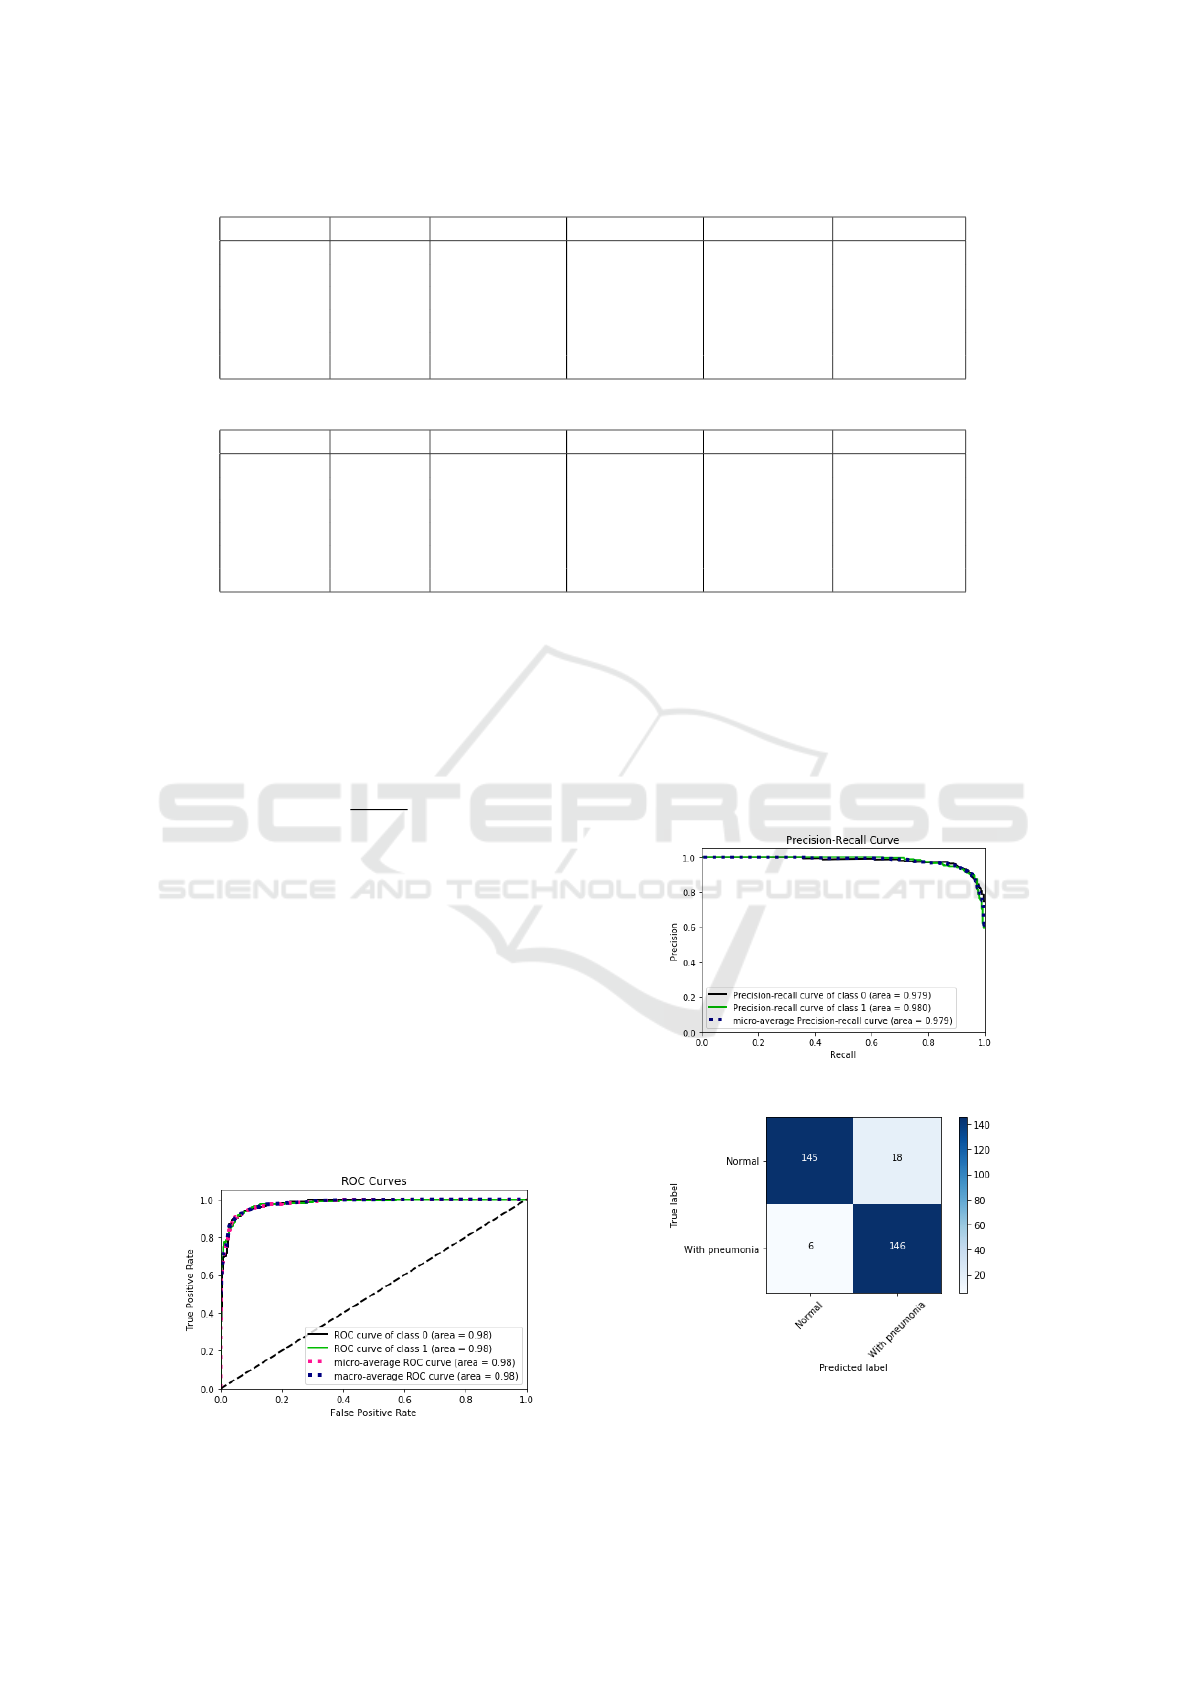
Table 1: Table of MLP Network Interaction Results Table.
Interaction Accuracy True Negative False negative True Positive False positive
1 92.38 % 277 38 305 10
2 93.68 % 267 25 325 13
3 90.15 % 286 23 282 39
4 91.90 % 322 13 257 38
5 92.69 % 299 25 285 21
Average 92.16 % 290.2 24.8 290.9 24.2
Table 2: Table of CNN network interaction results.
Interaction Accuracy True Negative False negative True Positive False positive
1 94.44 % 286 23 309 12
2 94.76 % 298 18 299 15
3 95.07 % 286 17 313 14
4 94.28 % 303 14 291 22
5 93.49 % 316 14 273 27
Average 94.40 % 297.8 17.2 297 18
present work, accuracy of individual class, producer
precision, user precision and Kappa index, among
others. The total accuracy is calculated by dividing
the sum of the main diagonal of the error matrix x
ii
,
by the total number of samples collected n. Accord-
ing to the equation 8.
T =
∑
a
i
=
1
x
ii
n
(8)
6 RESULTS
In this section will be presented the performance re-
sults of both neural networks. The metrics used to
evaluate the results are: Mean of cross validation ac-
curacy, mean number of false positive and false nega-
tive, of both models.
In the table 2 the results obtained by the MLP net-
work are presented, the data are: iteration, test data
accuracy, true negative, false negative, true positive,
false positive. The mean accuracy obtained by the
Figure 8: Curve roc MLP interaction 5(table 2).
network was 92.16 %, with an average of 24.2 false
positive, 24.8 false negative.
In the figure 8 it is possible to verify the ROC
curve and the error precision curve in the figure 9 re-
ferring to the interaction 5 of the table 2, in it it is
possible to verify the specificity and sensitivity of the
model. In the figures 10 and 11 the confusion matri-
ces for iteration 5 of the table 2.
Figure 9: Precision Recall curve interaction 5(table 2).
Figure 10: Confusion matrix, without normalization, MLP
interaction 5 (table 2).
Models of Learning to Classify X-ray Images for the Detection of Pneumonia using Neural Networks
81

Figure 11: Normalized confusion matrix, interaction 5 (ta-
ble 2).
7 CONCLUSIONS
In this work we have demonstrated comparative of
two classification models, for the diagnosis of pneu-
monia. For the validation of the models, cross val-
idation was performed, where it is possible to ver-
ify the generalization capacity. The artificial neural
networks used were: CNN and MLP. The proposed
classification models proved to be efficient in classi-
fication, with CNN obtaining 94.40 % accuracy and
MLP with 92.16%.
As future work, it is suggested to increase the
number of diseases that are also diagnosed through
radiographic thoracic, and to use other classifiers.
ACKNOWLEDGMENTS
This work is financed by National Funds through the
FCT - Fundac¸
˜
ao para a Ci
ˆ
encia e a Tecnologia (Por-
tuguese Foundation for Science and Technology) as
part of project UID/EEA/00760/2019.
REFERENCES
Becker, A., Bl
¨
uthgen, C., Sekaggya-Wiltshire, C., Castel-
nuovo, B., Kambugu, A., Fehr, J., Frauenfelder, T.,
et al. (2018). Detection of tuberculosis patterns in
digital photographs of chest x-ray images using deep
learning: feasibility study. The International Journal
of Tuberculosis and Lung Disease, 22(3):328–335.
Chen, Y.-H., Krishna, T., Emer, J. S., and Sze, V. (2017).
Eyeriss: An energy-efficient reconfigurable acceler-
ator for deep convolutional neural networks. IEEE
Journal of Solid-State Circuits, 52(1):127–138.
Grimm, K. J., Mazza, G. L., and Davoudzadeh, P. (2017).
Model selection in finite mixture models: A k-fold
cross-validation approach. Structural Equation Mod-
eling: A Multidisciplinary Journal, 24(2):246–256.
Havaei, M., Davy, A., Warde-Farley, D., Biard, A.,
Courville, A., Bengio, Y., Pal, C., Jodoin, P.-M., and
Larochelle, H. (2017). Brain tumor segmentation
with deep neural networks. Medical image analysis,
35:18–31.
Hooda, R., Sofat, S., Kaur, S., Mittal, A., and Meriaudeau,
F. (2017). Deep-learning: a potential method for
tuberculosis detection using chest radiography. In
Signal and Image Processing Applications (ICSIPA),
2017 IEEE International Conference on, pages 497–
502. IEEE.
Iorio, G., Capasso, M., Prisco, S., De Luca, G., Mancusi, C.,
Lagan
`
a, B., Piscopo, M. A., and Comune, V. (2018).
Lung ultrasound findings undetectable by chest radio-
graphy in children with community-acquired pneumo-
nia. Ultrasound in medicine & biology.
Kermany, D., Zhang, K., and Goldbaum, M. (2018). La-
beled optical coherence tomography (oct) and chest
x-ray images for classification. Structural Equation
Modeling: A Multidisciplinary Journal.
Kosasih, K., Abeyratne, U. R., Swarnkar, V., and Triasih, R.
(2015). Wavelet augmented cough analysis for rapid
childhood pneumonia diagnosis. IEEE Trans. Biomed.
Engineering, 62(4):1185–1194.
Kov
´
acs, G., T
´
oth, L., Van Compernolle, D., and Ganapathy,
S. (2017). Increasing the robustness of cnn acoustic
models using autoregressive moving average spectro-
gram features and channel dropout. Pattern Recogni-
tion Letters, 100:44–50.
Kunz, W. G., Patzig, M., Crispin, A., Stahl, R., Reiser,
M. F., and Notohamiprodjo, M. (2018). The value of
supine chest x-ray in the diagnosis of pneumonia in
the basal lung zones. Academic radiology.
Lakhani, P. and Sundaram, B. (2017). Deep learning at
chest radiography: automated classification of pul-
monary tuberculosis by using convolutional neural
networks. Radiology, 284(2):574–582.
Lisowska, A., Beveridge, E., Muir, K., and Poole, I. (2017).
Thrombus detection in ct brain scans using a con-
volutional neural network. In Proceedings of the
10th International Joint Conference on Biomedical
Engineering Systems and Technologies - Volume 2:
BIOIMAGING, (BIOSTEC 2017), pages 24–33. IN-
STICC, SciTePress.
Mabaso, M., Withey, D., and Twala, B. (2018). Spot detec-
tion in microscopy images using convolutional neu-
ral network with sliding-window approach. In Pro-
ceedings of the 11th International Joint Conference
on Biomedical Engineering Systems and Technologies
- Volume 2: BIOIMAGING, (BIOSTEC 2018), pages
67–74. INSTICC, SciTePress.
Maggiori, E., Tarabalka, Y., Charpiat, G., and Alliez, P.
(2017). Convolutional neural networks for large-scale
remote-sensing image classification. IEEE Transac-
tions on Geoscience and Remote Sensing, 55(2):645–
657.
Marques, J. F., das Chagas, Fontenele, A. A., Costa, J.
V. M., De Araujo, N. F., and Valente, A. (2018). Ma-
nipulation of bioinspiration robot with gesture recog-
nition through fractional calculus. IEEE LARS 2018 –
15th Latin American Robotics Symposium.
BIOIMAGING 2019 - 6th International Conference on Bioimaging
82

Organization, W. H. (2015). The Selection and Use of Es-
sential Medicines: Report of the WHO Expert Com-
mittee, 2015 (including the 19th WHO Model List
of Essential Medicines and the 5th WHO Model List
of Essential Medicines for Children). Number 994.
World Health Organization.
Pham, B. T., Bui, D. T., Prakash, I., and Dholakia, M.
(2017). Hybrid integration of multilayer perceptron
neural networks and machine learning ensembles for
landslide susceptibility assessment at himalayan area
(india) using gis. Catena, 149:52–63.
Ponzio, F., Macii, E., Ficarra, E., and Cataldo, S. D.
(2018). Colorectal cancer classification using deep
convolutional networks. In Proceedings of the 11th
International Joint Conference on Biomedical En-
gineering Systems and Technologies - Volume 2:
BIOIMAGING, (BIOSTEC 2018), pages 58–66. IN-
STICC, SciTePress.
Rajpurkar, P., Irvin, J., Zhu, K., Yang, B., Mehta, H., Duan,
T., Ding, D., Bagul, A., Langlotz, C., Shpanskaya, K.,
et al. (2017). Chexnet: Radiologist-level pneumonia
detection on chest x-rays with deep learning. arXiv
preprint arXiv:1711.05225.
Salamon, J. and Bello, J. P. (2017). Deep convolutional neu-
ral networks and data augmentation for environmental
sound classification. IEEE Signal Processing Letters,
24(3):279–283.
Saraiva, A., Barros, M., Nogueira, A., Fonseca Ferreira, N.,
and Valente, A. (2018a). Virtual interactive environ-
ment for low-cost treatment of mechanical strabismus
and amblyopia. Information, 9(7):175.
Saraiva, A., Ferreira, N., and Valente, A. (2018b). New
bioinspired filter of dicom images.
Saraiva, A., Melo, R., Filipe, V., Sousa, J., Ferreira, N. F.,
and Valente, A. (2018c). Mobile multirobot manipu-
lation by image recognition.
Saraiva, A., Miranda de Jesus Castro, F., Ferreira, N.,
and Valente, A. (2018d). Compression of electro-
cardiographs comparative study between the walsh
hadamard transform and discrete cosine transform.
Saraiva, A. A., , N. F. F., Salviano F.S.P. Soares and, M. J.
C. S. R., and Antonio, V. (2018e). Filtering of cardiac
signals with mathematical morphology for qrs detec-
tion. Proceedings of ICAT’18, 7th International Con-
ference on Advanced Technologies.
Saraiva, A. A., Costa, N., Sousa, J. V. M., De Araujo, T. P.,
Ferreira, N. F., and Valente, A. (2018f). Scalable task
cleanup assignment for multi-agents. In Memorias de
Congresos UTP, volume 1, pages 439–446.
Saraiva, A. A., Nogueira, A. T., Ferreira, N. F., and Valente,
A. (2018g). Application of virtual reality for the treat-
ment of strabismus and amblyopia. In 2018 IEEE 6th
International Conference on Serious Games and Ap-
plications for Health (SeGAH), pages 1–7. IEEE.
Saraiva, A. A., SANTOS, D. S., JUNIOR, F. M., SOUSA,
J. V. M., FERREIRA, N. F., and Valente, A.
(2018h). Navigation of quadruped multirobots by ges-
ture recognition using restricted boltzmann machines.
In Memorias de Congresos UTP, volume 1, pages
431–438.
Sivaramakrishnan, R., Antani, S., Xue, Z., Candemir, S.,
Jaeger, S., and Thoma, G. (2017). Visualizing abnor-
malities in chest radiographs through salient network
activations in deep learning. In Life Sciences Confer-
ence (LSC), 2017 IEEE, pages 71–74. IEEE.
Tang, J., Deng, C., and Huang, G.-B. (2016). Extreme
learning machine for multilayer perceptron. IEEE
transactions on neural networks and learning systems,
27(4):809–821.
Ustinova, E., Ganin, Y., and Lempitsky, V. (2017). Multi-
region bilinear convolutional neural networks for per-
son re-identification. In Advanced Video and Signal
Based Surveillance (AVSS), 2017 14th IEEE Interna-
tional Conference on, pages 1–6. IEEE.
Vajda, S., Karargyris, A., Jaeger, S., Santosh, K., Candemir,
S., Xue, Z., Antani, S., and Thoma, G. (2018). Fea-
ture selection for automatic tuberculosis screening in
frontal chest radiographs. Journal of medical systems,
42(8):146.
Vehtari, A., Gelman, A., and Gabry, J. (2017). Prac-
tical bayesian model evaluation using leave-one-out
cross-validation and waic. Statistics and Computing,
27(5):1413–1432.
Wang, X., Peng, Y., Lu, L., Lu, Z., Bagheri, M., and Sum-
mers, R. M. (2017). Chestx-ray8: Hospital-scale chest
x-ray database and benchmarks on weakly-supervised
classification and localization of common thorax dis-
eases. In Computer Vision and Pattern Recogni-
tion (CVPR), 2017 IEEE Conference on, pages 3462–
3471. IEEE.
Xue, Z., Antani, S., Long, L. R., and Thoma, G. R. (2018).
Using deep learning for detecting gender in adult chest
radiographs. In Medical Imaging 2018: Imaging In-
formatics for Healthcare, Research, and Applications,
volume 10579, page 105790D. International Society
for Optics and Photonics.
Yu, S., Jia, S., and Xu, C. (2017). Convolutional neural
networks for hyperspectral image classification. Neu-
rocomputing, 219:88–98.
Models of Learning to Classify X-ray Images for the Detection of Pneumonia using Neural Networks
83
