
MedClick: Last Minute Medical Appointments No-Show Management
In
ˆ
es Ferreira
1
and Andr
´
e Vasconcelos
1,2
1
Instituto Superior T
´
ecnico, Lisbon, Portugal
2
Instituto de Engenharia de Sistemas e Computadores, Investigac¸
˜
ao e Desenvolvimento (INESC-ID), Lisbon, Portugal
Keywords:
No-show, MedClick, Health Care, Supervised Learning, Logistic Regression, Prediction.
Abstract:
A no-show is one of the phenomena that leads to an efficiency decrease in various sectors, including in the
health care sector. When a scheduled patient misses an appointment without cancelling, it will not only waste
the clinic’s resources, but it will also deny medical service to another patient who could have benefited from
the respective time slot. This paper describes the research that is being developed in the context of MedClick,
an online platform that aims to help medical service providers increase the efficiency of their practices. The
solution supports the reduction of no-shows by predicting their occurrence and finding replacements to fulfill
“last-minute” vacancy slots. A supervised learning algorithm (logistic regression) is being implemented and it
will be used to predict the probability of no-show for each patient. The system will run this algorithm 48 hours
before each appointment so that there is still enough time to find a replacement, if necessary. The prediction
is based on features related to the respective clinic and patient, which requires access to the database.
1 INTRODUCTION
The world is going through a phase of rapidly escalat-
ing costs which implies an efficient use of resources.
However, the efficiency of various sectors is increas-
ingly affected by no-shows. This research focuses
specifically in the health care sector, in which there
are at least two negative effects whenever a scheduled
patient misses an appointment without cancelling:
firstly, the clinic’s resources are wasted and secondly,
medical service is denied to patients who could have
benefited from the respective time slot. MedClick is
an online platform that aims to help medical service
providers increase the efficiency of their practices, by
providing tools that, among other features, reduces
no-shows and allows fulfilling “last-minute” vacancy
slots, by notifying patients whose needs and restric-
tions are best suited to the time slot. The implemen-
tation of this feature will be rewarding because it will
not only help the Portuguese health care providers but
also the patients. Furthermore, there are not many
systems using techniques based on machine learning
to reduce no-shows so if this project proves to be a re-
liable solution, it may be useful for other businesses.
1.1 Objectives
The goal of this research is to reduce no-shows from
patients in medical appointments in order to increase
the productivity and the resource usage in health care
services. To achieve the desired goal, the research is
divided into three distinct phases. The initial phase
is devoted to the study of patient behavior. The sys-
tem has access to the history of no-shows of several
patients and to some of their personal information.
The main goal of this phase is to select the data that
proves to be relevant in the study of no-shows. Dur-
ing the second phase, a supervised machine learning
algorithm is developed to calculate the probabilities
of no-shows and, based on the data collected in the
first phase, the algorithm is expected to predict the
probability of no-shows and cancellations for each pa-
tient. Finally, the system should try to find a solution
that minimizes each probability and, in the case of
detecting a future no-show, it is responsible for find-
ing a suitable replacement and notify the health care
provider about the change.
Those phases are expected to complement the no-
show algorithm structure that is already implemented
in the MedClick platform. In addition, to improve the
method used for selecting candidates, it will also be
added a new feature for allowing patients to add them-
selves in waiting lists. Finally, to observe the impact
of these strategies on the accuracy of the results, the
final system is evaluated and compared to the existing
solution.
In order to cover all the phases mentioned above,
this paper is structured as follows: Section 2 includes
206
Ferreira, I. and Vasconcelos, A.
MedClick: Last Minute Medical Appointments No-Show Management.
DOI: 10.5220/0007260702060215
In Proceedings of the 12th International Joint Conference on Biomedical Engineering Systems and Technologies (BIOSTEC 2019), pages 206-215
ISBN: 978-989-758-353-7
Copyright
c
2019 by SCITEPRESS – Science and Technology Publications, Lda. All rights reserved

a review of no-show literature, providing a context for
the research. Section 3 presents information on the
most common used algorithms for supervised learn-
ing which is the method used in this research. Section
4 describes the no-show approach currently used in
Medclick and reveals the respective major limitations.
Section 5 describes, in detail, the proposed solution
and section 6 presents the method chosen to evaluate
it. Finally, section 8 concludes the paper by summa-
rizing the work that is being done for this research.
2 LITERATURE REVIEW ON
NO-SHOWS
The efficient use of resources is increasingly impor-
tant, and as such, several studies have arisen, focused
on detecting the origin of no-shows and finding pos-
sible solutions to this problem. These include the fol-
lowing: a solution based on machine learning tech-
niques that served as an inspiration for this research
(Alaeddini et al., 2015), a structured and representa-
tive review of no-show literature up to 2011 (Turk-
can et al., 2013) and, finally, a research presenting a
no-show algorithm implemented in the context of the
MedClick application (Sousa, 2017). These are the
studies that most influenced this research, although
there are many others that left their mark and as such,
this chapter will mention some of them as it will cover
the main reasons reported for no-shows, some strate-
gies to reduce their occurrence and finally, some vari-
ables already considered as predictors.
2.1 Causes of No-Shows
Missing an appointment can be a voluntary or an in-
voluntary act. Involuntary no-shows, as their name
suggest, occur when the patient has no intention of
doing so and includes one of the most commonly re-
ported reason: forgetting the appointment (Neal et al.,
2005; Park et al., 2008). Several other reasons are re-
ported for no-shows including scheduling problems,
the patient’s health status and other personal or logis-
tical issues. Scheduling problems may be related to
service’s quality and include troubles getting an ap-
pointment, wrong information about the date and time
and difficulty in cancelling the appointment (Corfield
et al., 2008; Gany et al., 2011). Patient health status
include being physically or mentally ill (Gany et al.,
2011) and feeling better and not needing the appoint-
ment anymore (Corfield et al., 2008). Finally, the per-
sonal and logistical issues can include financial prob-
lems, lack of transportation or competing priorities,
like work schedules or family problems (Neal et al.,
2005; Gany et al., 2011).
2.2 Strategies to Reduce No-Shows
Healthcare providers struggle to reduce no-shows
and for that they use strategies including appoint-
ment reminders, patient’s education, follow-up after a
no-show appointment, overbooking and open-access
scheduling.
As discussed in section 2.1, forgetting the appoint-
ment is one of the most commonly reported reasons
for no-shows, and as such, appointment reminders are
used to prevent that situation, through text messages,
phone calls or letters (Leong et al., 2006; Liew et al.,
2009). Some health providers also focus on patient
education that consists of providing all the important
information in order to ensure that patients feel secure
about their appointment. However, it does not result
in a significant reduction of no-shows (Hardy et al.,
2001). In addition to the last two strategies, some
clinics use patient sanctions and methods of follow-
up after a no-show, such as sending messages ask-
ing to reschedule the missed appointment, as an at-
tempt to change patient’s behavior (Guse et al., 2003).
There are some scheduling systems aimed at reduc-
ing no-shows such as overbooking and open-access
scheduling. Overbooking involves scheduling more
patients than the actual number that the clinic and
staff can handle. This method is widely used to re-
duce no-shows since it manages to alleviate its nega-
tive effects. However, it is an imperfect solution, as
it can lead to a long waiting list and, consequently, to
decreased patient satisfaction. Open-access schedul-
ing allows patients to see their physician within a day
or two of scheduling the appointment. Unlike over-
booking, this method is used to minimize waiting time
(Cameron et al., 2010).
This specific project will be based on a strategy
that has been increasingly studied, which consists
of predicting no-shows based on prior patient’s be-
havior, using supervised learning techniques. These
predictions can also be used to determine the opti-
mal number of patients to schedule per clinic session
(Glowacka et al., 2009).
2.3 Predictors of No-Show
Ample literature is available discussing predictors of
no-shows, which can be divided into two categories:
patient’s characteristics and appointment’s character-
istics. The first includes patient’s age, gender, mari-
tal status and insurance status. The second includes
waiting time, the day of the scheduled appointment
MedClick: Last Minute Medical Appointments No-Show Management
207

and clinic’s proximity. Several studies have demon-
strated that no-show patients tend to be younger, un-
married (Daggy et al., 2010), uninsured (Bennett and
Baxley, 2009), with psychosocial problems and fi-
nally, with prior no-show history. Regarding gen-
der, although not a significant difference, some stud-
ies have shown that women are less likely to no-show.
Long waiting lists are one of the major problems in
healthcare services and cause patient’s dissatisfaction,
which in turn leads to a higher no-show rate (George
and Rubin, 2003). The day, time and season of the
scheduled appointment were also explored as pre-
dictor variables and it was concluded that no-shows
were slightly more likely during winter (Daggy et al.,
2010). Clinic’s proximity is also a factor to consider
since studies show that the greater the distance to the
clinic, the greater the probability of no-show. Al-
though there are several studies related to no-shows
that prove the impact of these features, it is important
to bear in mind that the results may vary depending
on the country where the study is done. In the context
of the MedClick application, some features have al-
ready been tested in order to find out if they affected
the patient’s behavior. However, after analyzing the
data, only two were considered relevant (patient’s age
and appointment’s day) since the remaining two (pa-
tient’s sex and distance) did not feature major patterns
(Sousa, 2017).
3 SUPERVISED LEARNING
In section 2.2 were mentioned several strategies
aimed at reducing no-shows, including some based on
patient’s no-show prediction. However, their effec-
tiveness will depend on the accuracy of the predicted
no-show’s probabilities. Regarding this prediction,
this project will use techniques based on supervised
learning.
Supervised learning is responsible for mapping
from an input to an output. The idea is to analyze
a set of training data and learn a function capable of
predicting the output given new input data. Super-
vised learning problems can be further divided into re-
gression and classification problems. A classification
problem is when the output variable is discrete. In this
type of problems, the function predicts the class for a
given observation. A regression problem is when the
output variable takes continuous values. A wide range
of algorithms are available, so when it comes time to
choose which algorithm to use, it must be considered
the type of problem that is being addressed. This sec-
tion will present some of the most widely used algo-
rithms in supervised learning problems.
3.1 Logistic Regression
Logistic regression model is used to describe data and
to measure the relationship between one dependent
variable, normally binary, and one or more indepen-
dent variables. In fact, logistic regression is very sim-
ilar to linear regression. The difference between the
two models is that the first one predicts whether some-
thing is True or False instead of predicting something
continuous and, as such, uses a logistic function, de-
scribed above, instead of using a linear equation.
p(x
1
,...,x
k
) =
1
1 + e
−(β
0
+β
1
x
1
+...+β
k
x
k
)
(1)
where:
• x
1
,. . . ,x
k
correspond to the set of features (or pre-
dictors)
• β
0
corresponds to the intercept term
• β
k
correspond to the coefficient associated to the
feature x
k
This function is advantageous because, regardless
of the variables it receives, the output always takes
values between 0 and 1, which can be interpreted as
the probability of the problem occurring. The algo-
rithm starts by building the model. In this phase, the
training data will be used to estimate the best coef-
ficients that will shape the logistic function to fit the
given problem. In order to predict the probabilities as
accurately as possible is crucial to build a cost func-
tion that quantifies the error by comparing the pre-
dicted probability with the correct answer. Then, it is
possible to estimate better values for the coefficients
and, consequently, minimize the error, using the gra-
dient descent. After the model is built, the system just
need to provide a set of features to predict the proba-
bilities using the logistic function and the previously
estimated coefficients. In addition to the output hav-
ing a straightforward probabilistic interpretation, this
algorithm reveals other advantages, such as the speed
of prediction and the ease in adding or removing fea-
tures. The prediction of the probabilities is extremely
fast because after the model has been built, the system
only need to apply the logistic function with the pre-
viously estimated coefficients. The model building is
a computationally expensive process, but it does not
have a great impact because it is only necessary at
the start of the algorithm or when the model is re-
built, which happens when features are added or re-
moved. However, the disadvantage of this model is
that to obtain accurate and stable results, it requires a
large dataset.
HEALTHINF 2019 - 12th International Conference on Health Informatics
208

3.2 k-Nearest Neighbors
The k-Nearest Neighbors (k-NN) is one of the sim-
plest machine learning algorithms and its output de-
pends on whether it is used for regression or classi-
fication, which will be our focus. The idea of this
algorithm is to predict the class of a new instance
by looking at the classes of the k most similar in-
stances (k nearest neighbors) and choosing the most
common. To find those k instances, there are several
distance metrics that can be used, such as, Euclidean
Distance, Hamming Distance, Manhattan Distance or
Minkowski Distance. The training data are repre-
sented as vectors and each of them is associated with
a label that indicates the class to which it belongs. As
such, the distance metric will have to calculate the dis-
tance from the new vector to every other vector in the
dataset and then, select the k nearest. Euclidean Dis-
tance uses the Pythagorean formula to calculate the
distance between two vectors and it is the most popu-
lar for continuous input variables. However, it works
better when those variables are similar in type, such as
widths, heights and lengths. In the case of no-show’s
problem, the input variables (such as gender, age and
distance) are not similar in type so the recommended
metric distance is Manhattan Distance, which calcu-
lates the distance between two vectors ~p and ~q, using
the sum of their absolute difference:
d(~p,~q) =
n
∑
i=0
|p
i
− q
i
| (2)
where:
• n corresponds to the number of attributes;
• p
i
and q
i
corresponds to the attribute i of p and q,
respectively;
After finding the k nearest neighbors, we can
use a common technique that consists in assigning
weight to the contributions of those neighbors, so that
the nearer have a greater impact (Hechenbichler and
Schliep, 2004). The better the choice of k parame-
ter, the greater the accuracy of the results. Choosing
a small value for k results in a higher influence of the
noise on the classification, however, choosing a large
value can be computationally expensive and it makes
boundaries between classes less distinct.
3.3 Decision Tree
Decision trees are commonly used for predictive mod-
eling machine learning. The goal is to use a tree to
represent all the possible outcomes given a set of fea-
tures. There are two types of tree models: classifica-
tion trees, where the output can take a discrete set of
values and regression trees, where the output can take
continuous values. The topmost node of a tree corre-
sponds to the root node. Each interior node represents
a feature of the problem and it splits into branches,
which correspond to the possible outcomes of the re-
spective feature. At the end of each branch there is a
leaf, whose value represents the respective outcome,
which is used to make a prediction. For example, in
figure 1, it is represented the tree resultant of a simple
problem where we want to decide whether we should
wait for a table at a restaurant or not, in a given sit-
uation. The attributes are the number of patrons in
restaurant, whether we are hungry or not, the type of
restaurant and the Fri/Sat which indicates if it is Fri-
day or Saturday. As we can see, each branch corre-
sponds to a possible outcome of a given attribute and
the leaves are labelled with yes or no, which repre-
sents whether we should wait or not, respectively.
Figure 1: Decision tree example (Russell and Norvig,
2002).
Despite being a simple model to understand, in-
terpret and visualize, one of the main concerns when
generating decision trees is that their complexity de-
pends on the order chosen for the attributes. As such,
to avoid over-complex trees, it is important to make
an extra computation to decide in advance which is
the best order for the attributes. This can be done by
using, for example, the information gain or pruning,
which is also a technique used to reduce the complex-
ity of the decision tree by removing sections that have
an insignificant impact on the classification. With this
extra computation, the system can become extremely
slow, depending on the complexity of the problem.
3.4 Bayesian Inference
The idea of Bayesian inference is to update the proba-
bility for a hypothesis, using Bayes theorem, as more
data becomes available. The Bayes theorem is used to
compute the posterior distribution, which is the dis-
MedClick: Last Minute Medical Appointments No-Show Management
209

tribution of the parameters after considering the ob-
served data:
p(θ|y) =
p(y|θ)p(θ)
p(y)
(3)
where:
• θ represents the parameters and y represents the
observed data;
• p(θ| y) corresponds to the posterior distribution;
• p(y| θ) corresponds to the prior distribution;
• p(θ) corresponds to the likelihood function
As demonstrated above, the posterior distribution
is computed as a consequence of two antecedents:
a likelihood function and a prior distribution, which
represents the distribution of the parameters before
observing any data. This method is already imple-
mented in MedClick application, by Daniel Sousa
(Sousa, 2017), and it is used to update the initial
probability of no-show, which is computed with a
population-based approach. To do this, Daniel ap-
plied the equation 4, which had previously been used
in another study for the same purpose (Alaeddini
et al., 2015). In this problem were considered three
different events (no-show, cancellation and show-up)
and as such, it was required to adapt Bayes theorem
as follows:
E(a
k
|y
1
,y
2
,..., y
k
) =
y
k
+ a
k
∑
K
k=1
y
k
+
∑
K
k=1
a
k
(4)
where:
• K corresponds to the number of events;
• a
k
corresponds to the e probability of the event k;
• y
k
) corresponds to the he number of occurrences
of the event k;
4 EXISTING NO-SHOW
APPROACH
A no-show algorithm structure was already imple-
mented in the context of MedClick platform, by
Daniel Sousa (Sousa, 2017). This section presents
that solution, describing the chosen approach and the
implemented algorithm. At the end, the major limita-
tions are also revealed.
4.1 Hybrid Approach
To compute the no-show probability for each patient,
MedClick is currently using a hybrid approach that
combines logistic regression, as a population-based
method, and Bayesian inference, as an individual-
based method (Sousa, 2017; Alaeddini et al., 2015).
Logistic regression is responsible for building a
model that computes an initial estimation of the no-
show probability for each patient, based on the gen-
eral behavior of the population. To train this model it
is used a dataset which consists in all the appointment
data available and some previously studied features,
which revealed a significant impact on the no-show’s
studies, such as sex, age, distance and day of the ap-
pointment. After that, the algorithm uses Bayesian
inference to adapt the initial probability to each spe-
cific patient using their appointment record, if any. A
simple query on the database it is used to get all the
appointments made by the specific patient and then,
the system counts his total number of appointments
and his number of no-shows. This information will
be required to apply the equation 4 which will give us
the final no-show probability for that patient.
In this type of systems, it is important to keep the
model up-to-date so that predictions are as accurate
as possible. Since new information is always arriv-
ing, it is necessary to update the coefficients of the
logistic regression, which is easily done by rebuilding
the model. However, that is a computationally expen-
sive process and as such, it is not viable to rebuild it
whenever new information arrives. Considering this,
MedClick implemented a strategy which consists in
rebuilding the model only after a certain number of
records have been inserted into the database.
4.2 Algorithm
The existing algorithm aimed to find patients inter-
ested in filling the ”last-minute” vacancy slots and
it starts when the system receives a no-show notifi-
cation. This may arise for three different reasons,
namely, the patient canceled his appointment, the pa-
tient failed to respond to the appointment confirma-
tion or the system detected, using patient’s location,
that the patient will not arrive on time.
The first step is to obtain the filtered list of can-
didate patients, from which two sub-lists are high-
lighted. The first one includes all patients that have
already scheduled an appointment at a later date in
the same health care center and with the same health
professional. The second list includes all patients
within a certain distance from the health care center.
These two lists will be considered separately and, as
such, the patients of the second list will only be no-
tified after all patients of the first list have been noti-
fied. Within each list, the patients will also be consid-
ered individually and consecutively, going from the
least likely to miss the appointment to the one with
the greatest probability of missing it. This requires a
prior computation of the no-show probability associ-
HEALTHINF 2019 - 12th International Conference on Health Informatics
210

ated with each candidate patient, using the approach
described in section 4.1.
After the patients have been ordered accordingly
to their no-show probabilities, the algorithm goes into
a loop until it finds an appropriate replacement or un-
til there are no more candidate patients. A notification
is always sent to the first person on the list, which cor-
responds to the patient with the lowest no-show prob-
ability, and the algorithm only moves on to the next
patient if the previous one rejects or if they do not re-
spond within 12 hours. At the end, if no replacement
was found, the system notifies the health care center
that the algorithm was unable to fulfill the time-slot.
4.3 Limitations
Despite the satisfactory results, there are some as-
pects that should be considered in order to improve
the quality of the system.
One of the major limitations of this solution is that
it is focused exclusively on finding patients interested
in filling the ”last-minute” vacancy slots and as such,
the algorithm that estimates the no-show probabilities
is only used to sort the candidate patients list, from the
least likely to miss the appointment to the one with the
greatest probability of missing it. Instead of looking
for a solution that is applied only after a no-show has
been detected, the algorithm should be leveraged to
detect no-shows, by predicting the time slots where
the patient is most likely to miss the appointment.
If the system was able to make that prediction, the
health care center would be able to overbook another
patient in that time-slot, reducing the occurrence of a
no-show.
Another problem that could have negative reper-
cussions not only for the platform but also for the
health care center is the method used to find a re-
placement which consists of sending numerous noti-
fications to patients that may not be interested. Re-
garding the features used in algorithms, the selection
was made based on foreign studies since the company
could not provide in time real world data. As such, it
was not possible to determine which features are best
suited to the Portuguese population.
After analyzing the data, only two features were
considered relevant (patient’s age and the day of the
appointment) since the remaining two (patient’s sex
and distance) did not feature major patterns. The ex-
isting system considers neither possible changes in
patient’s behavior over time nor the no-show rate of
the clinic, which is important since a high no-show
rate may be associated with a lack of quality in the
service, which in turn may lead to patient’s no-show.
5 PROPOSED SOLUTION
This section presents the proposed solution which
aims at improving the current algorithm implemented
in the MedClick application. In order to overcome
the major limitations mentioned in section 4.3, this
solution will use the no-shows algorithm to predict
when and if a patient will miss the appointment. The
logistic regression model will be maintained but the
bayesian inference will be discarded since there is no
need to separate individual features from remaining
features. To increase the accuracy of the results, this
solution adds some new features and makes some im-
provements that will be detailed below. Red and yel-
low boxes were used in the diagrams of this section in
order to clarify what is added and what is changed in
the current system, respectively.
5.1 Detecting a No-Show
The flow diagram in figure 2 represents how the sys-
tem will act in order to detect no-shows, which is the
main addition of this thesis. By default, the system
will run this algorithm 48 hours before each appoint-
ment so that there is still enough time to find a re-
placement, if necessary, using the algorithm described
in section 5.2. The sooner the no-show is detected,
the longer the system will have to find a replacement,
however, the prediction may be less accurate. As
such, this process may be anticipated in the future de-
pending on the priorities of the hosting clinic, since it
may lead to a higher risk of overbooking. Following,
there is a detailed description of each individual step.
1. Compute Patient’s Probability of No-show:
The algorithm uses a logistic regression model
to perform this computation. This requires ac-
cess to the database in order to obtain the infor-
mation about the appointment that we need to in-
put so that the model outputs the respective no-
show probability. The required information in-
cludes patient’s age, marital status, insurance sta-
tus, waiting time, day of the appointment, the ur-
gency of the appointment, the patient’s history
and finally, the clinic’s no show rate. Depend-
ing on their relevance, different weights will be
assigned to each of them.
2. , 3. Patient Answered to Appointment Confir-
mation?: 72 hours before the scheduled appoint-
ment, by default, the patient receives a notifica-
tion to confirm their presence. In order to com-
plete the computation of the no-show probability,
the system will act according to the patient’s an-
swer. First, the algorithm checks whether the no-
tification has been answered. If not, the algorithm
MedClick: Last Minute Medical Appointments No-Show Management
211
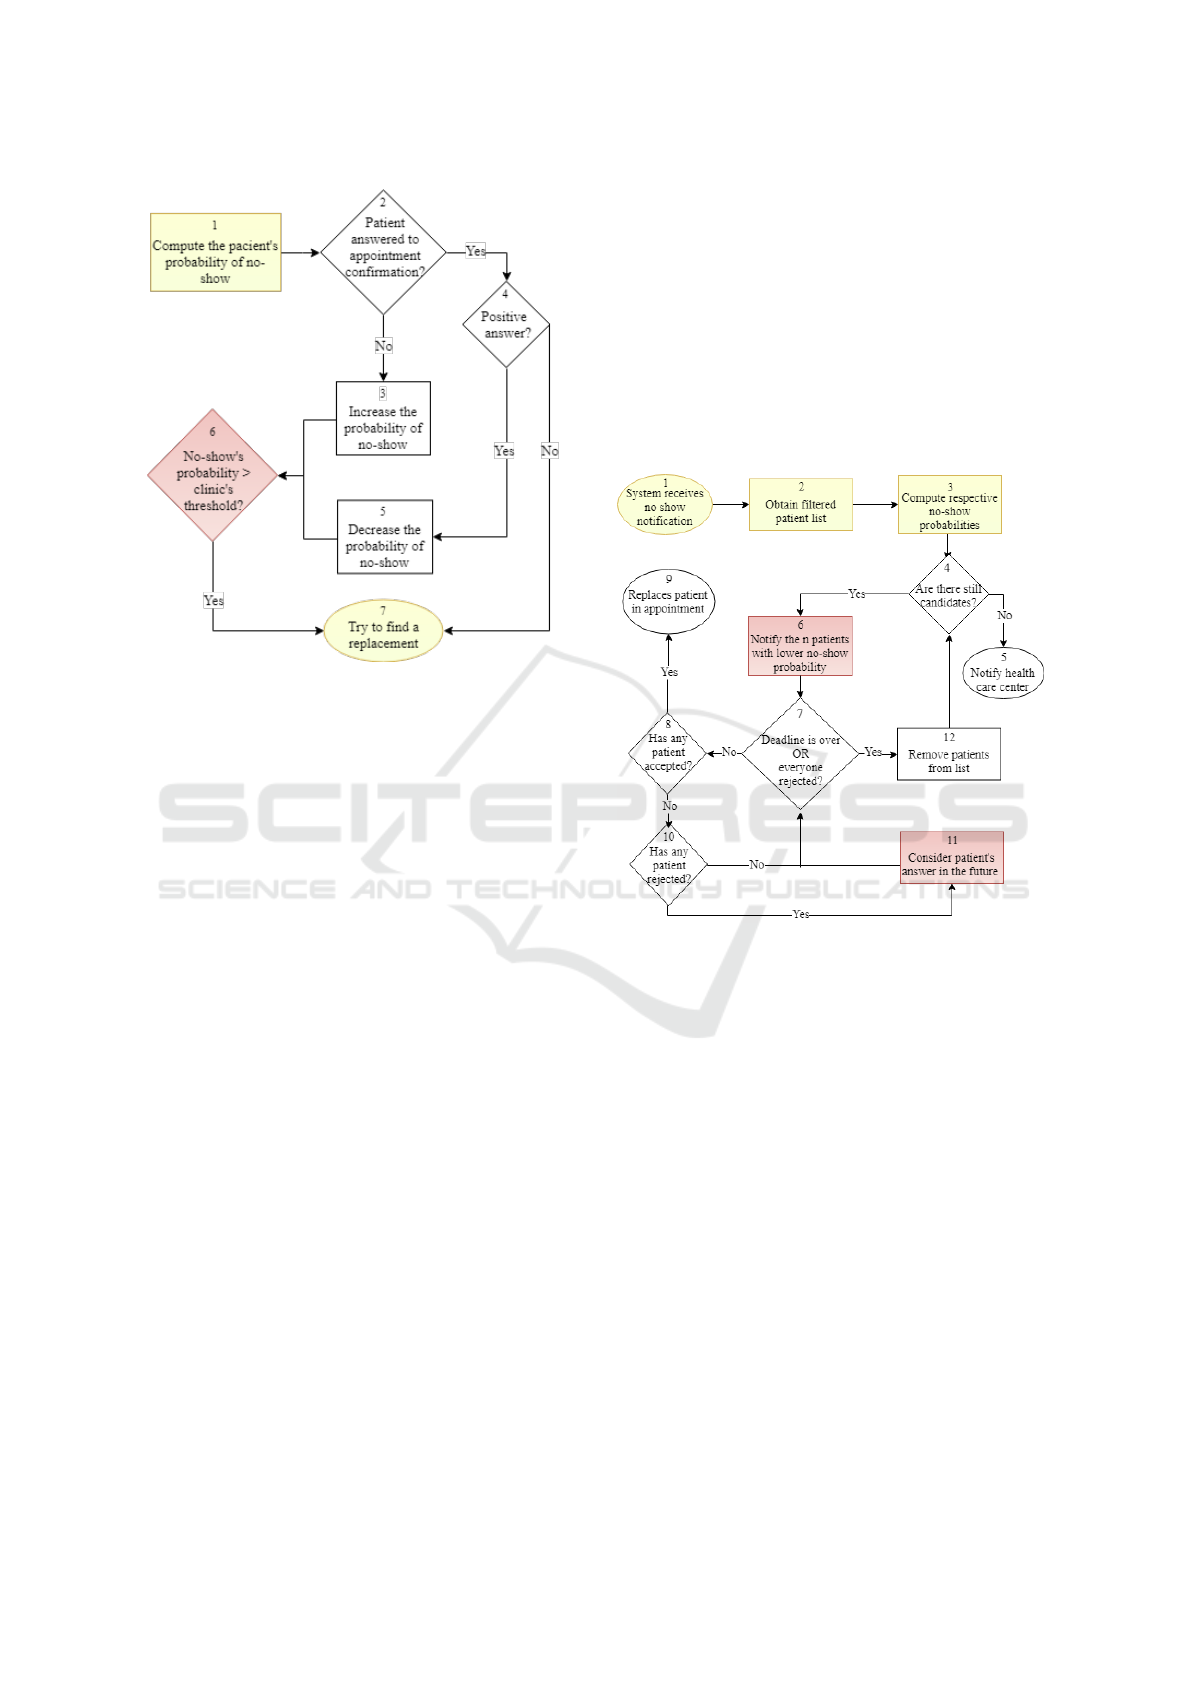
Figure 2: Detecting a no-show flow chart.
proceeds to step 3 and the patient’s probability of
no-show will increase. Otherwise, it proceeds to
step 4.
4. , 5. Positive Answer?: After confirming that the
patient answered to the notification, the question
remains as to whether the answer was positive or
not. If the patient confirmed their presence, the
algorithm proceeds to step 5, where the system
will greatly decrease the respective probability of
no-show. Otherwise, there is no further need to
calculate the no-show probability and as such, the
algorithm proceeds directly to step 7.
6. No-show’s Probability > Clinic’s Rhreshold?:
Once the computation of no-show’s probability is
completed, the system compares the result to the
clinic’s threshold, which corresponds to the max-
imum acceptable no-show’s probability for the
clinic. When the result exceeds the threshold, the
clinic assumes that the patient will miss the ap-
pointment and therefore the algorithm proceeds to
step 7. The threshold value is previously defined
and it will depend on the hosting clinic’s strategy.
7. Try to Find a Replacement: If the patient’s prob-
ability of no-show exceeds the clinic’s threshold,
the system will try to find another patient inter-
ested in scheduling an appointment for that time
slot. This process is described in detail in section
5.2. However, there is a possibility of the system
making a wrong prediction which will result in a
longer waiting list since both scheduled patients
will show up for the same time slot.
5.2 Finding a Replacement
As discussed in Chapter 4, an algorithm has already
been implemented in MedClick’s application to find
patients interested in filling the ”last-minute” vacancy
slots. That algorithm will be slightly changed in order
to get more accurate results. The flow chart in figure
3 represents the algorithm of this solution which is
based on the flow chart used by Daniel (Sousa, 2017).
The following list provides a detailed description of
each step.
Figure 3: Finding a replacement flow chart.
1. System receives No-show Notification: With
this solution, the algorithm will not only start
when it receives a cancellation notification but
also when the system detects that the patient will
not show up for the appointment, by applying the
algorithm described in section 5.1.
2. Obtain filtered Patient List: The list of candi-
date patients consists of two sub-lists. The first
one requires a new feature in the application for
allowing patients to add themselves in waiting
lists. All appointments will have associated a list
of patients interested in filling last minute vacan-
cies, which will correspond to the priority sub-list
of this algorithm. The second sub-list includes all
patients who are not on the waiting list but who
have already scheduled an appointment at a later
date in the same health care center and with the
same health professional.
3. Compute No-show Probabilities: The technique
used for computing the probability of no-show is
HEALTHINF 2019 - 12th International Conference on Health Informatics
212

exactly the same as the one used in the algorithm
described in step 1 of section 5.1. This computa-
tion is required because, in the second sub-list, the
candidates will be notified from the least likely to
miss the appointment to the one with the greatest
probability of missing it.
4. , 5. Are there still candidates?: In this step, the
algorithm will enter in a loop until it finds an ap-
propriate replacement or until there are no more
candidate patients. If there are no more candidate
patients to notify, the algorithm proceeds to step 5
and the health care center will be notified that the
system was unable to fulfill the time-slot. Other-
wise, it proceeds to step 6.
6. Notify the n Patients with Lower No-show
Probability: Contrary to what was implemented
in the MedClick’s application, this solution will
notify more than one candidate at a time in order
to optimize the remaining time. The default value
of n is 2 but it may be customized later according
to the preference or profile of each clinic.
7. Deadline is over OR Everyone Rejected?: Af-
ter notifying the n patients with lower probability
of no-show, the algorithm goes into a new loop
and waits until one of the patients accepts. The
loop lasts for a maximum of 12 hours but may
end earlier if all patients respond negatively. In
that case, the algorithm proceeds to step 12. Oth-
erwise, it will loop through steps 7, 8, 10 and 11.
As mentioned, the default value for the deadline
is 12 hours but it can be changed in the future.
8. , 9. Has any Patient Accepted?: Once one of the
patients accepts, the algorithm exits the loop and
proceeds to step 9, in which the system is respon-
sible for updating the appointment information,
for notifying the clinic of the replacement and fi-
nally, for informing previously notified patients
that the proposed time-slot is no longer available.
10. , 11. Consider Patient’S Rejection in the Fu-
ture: This step is applied exclusively to patients
on the second sub-list. The system should con-
sider which patients were not interested in antici-
pating their scheduled appointment so that in the
future the algorithm gives opportunity to other pa-
tients who may be more interested. If the patient
has already rejected more than once, the system
should also ask if they want to continue receiving
such suggestions.
12. Remove Patients from List: If patients rejected
or failed to respond to the notification, they will
not take the appointment and therefore the system
removes them from the list of candidates.
6 DISCUSSION
6.1 Assessment of Existing Solution
There is a no-show algorithm structure already im-
plemented in MedClick platform, as such, the initial
phase of this research is dedicated to becoming famil-
iar with it. A global evaluation was already performed
(Sousa, 2017) but despite the seemingly satisfactory
results, it is wrong to assume that the algorithm is
concluded since the features used are insufficient to
achieve accurate results in a real-world application.
Furthermore, the method used to evaluate the perfor-
mance of the system was not the most appropriate be-
cause it does not ensure that the model has low bias
and low variance.
Considering the above mentioned problem, the
next section presents the new method that was cho-
sen to evaluate the performance of the system.
6.2 Evaluation
Cross-validation is a well-known and widely used
technique to estimate how accurately a predictive
model will perform in practice. As such, this solution
will use k-fold cross validation to evaluate the logis-
tic regression model’s performance when predicting
if a patient will miss the appointment. This process
consists in partitioning the sample data into k sub-
samples, one of which will be used for testing the
model (validation data), and the remaining k-1 sub-
samples will be used to train the model (training data).
The chosen k value was 10 which is a typical num-
ber of folds in this type of problems since it provides
good results as has already been demonstrated in sev-
eral studies (Kohavi, 1995). As such, the data will be
divided in 10 folds and the process will be repeated 10
times so that each fold will be used once as a test set.
After the respective performance measures have been
calculated, the accuracy of the model will be revealed
by calculating the mean and the standard deviation of
the results. Accuracy, precision, recall and area under
ROC curve are the performance metrics that will be
used to evaluate the performance.
7 CONCLUSIONS
This research is focused on no-shows of the health
care sector and seeks to gather all the necessary infor-
mation to implement a solution capable of reducing
no-shows and, consequently, increase the efficient use
of clinic resources. The proposed solution is applied
MedClick: Last Minute Medical Appointments No-Show Management
213

in the context of the MedClick application and aims
to improve its system, using the following strategies:
• Simplify the existing algorithm: The existing so-
lution is based on a hybrid approach which uses
both logistic regression for population-based fea-
tures and bayesian inference for individual fea-
tures. The proposed solution maintains the logis-
tic regression model but discards the bayesian in-
ference since there is no need to separate individ-
ual features from remaining features.
• Add relevant features: in the existing solution,
only two features were considered relevant (pa-
tient’s age and the day of the appointment) since
the remaining two (patient’s sex and distance) did
not feature major patterns. In order to improve
the logistic regression model, this solution adds
the following features: patient’s marital status, pa-
tient’s insurance status, waiting time, the urgency
of the appointment, the patient’s history and fi-
nally, the clinic’s no show rate.
• Use the algorithm to detect no-shows: the previ-
ous solution is only using the no-show algorithm
to sort the candidates list, from the least likely to
miss the appointment to the one with the great-
est probability of missing it. This solution, in ad-
dition, uses the “same” algorithm to predict no-
shows.
• Improve the method of selecting candidates for
replacements: the previous method used to get
the list of candidates is not the most appropriate
since it sends numerous notifications to patients
who may not be interested. This solution allows
patients to add themselves in waiting lists and as
such, once the system detects a no-show, it will
start by notifying those patients.
A final evaluation is an ongoing task in order to ob-
serve the impact of these strategies on the quality of
system and find new relevant features in the no show
detection and replacement algorithm.
ACKNOWLEDGEMENTS
This work was supported by national funds through
Fundac¸
˜
ao para a Ci
ˆ
encia e a Tecnologia (FCT)
with reference UID/CEC/50021/2019 and European
funds through the H2020 framework programme
with reference 822404 (projects QualiChain – Decen-
tralised Qualifications’ Verification and Management
for Learner Empowerment, Education Reengineering
and Public Sector Transformation).
REFERENCES
Alaeddini, A., Yang, K., Reeves, P., and Reddy, C. (2015).
A hybrid prediction model for no-shows and cancella-
tions of outpatient appointments. 5:14–32.
Bennett, K. and Baxley, E. (2009). The effect of a carve-out
advanced access scheduling system on no-show rates.
In Family medicine, volume 41, pages 51–6.
Cameron, S., Sadler, L., and Lawson, B. (2010). Adop-
tion of open-access scheduling in an academic family
practice. Canadian Family Physician, 56(9):906–911.
Corfield, L., Schizas, A., Noorani, A., and Williams, A.
(2008). Non-attendance at the colorectal clinic: a
prospective audit. Annals of the Royal College of Sur-
geons of England, 90(5):377—380.
Daggy, J., Lawley, M., Willis, D., Thayer, D., Suelzer, C.,
DeLaurentis, P.-C., Turkcan, A., Chakraborty, S., and
Sands, L. (2010). Using no-show modeling to im-
prove clinic performance. Health Informatics Journal,
16(4):246–259.
Gany, F., Ramirez, J., Chen, S., and Leng, J. C. F. (2011).
Targeting social and economic correlates of cancer
treatment appointment keeping among immigrant chi-
nese patients. Journal of Urban Health, 88(1):98–103.
George, A. and Rubin, G. (2003). Non-attendance in gen-
eral practice: A systematic review and its implications
for access to primary health care. 20:178–84.
Glowacka, K. J., Henry, R. M., and May, J. H. (2009). A
hybrid data mining/simulation approach for modelling
outpatient no-shows in clinic scheduling. Journal of
the Operational Research Society, 60(8):1056–1068.
Guse, C. E., Richardson, L., Carle, M., and Schmidt, K.
(2003). The effect of exit-interview patient education
on no-show rates at a family practice residency clinic.
The Journal of the American Board of Family Prac-
tice, 16(5):399–404.
Hardy, K., O’Brien, S., and J Furlong, N. (2001). Qual-
ity improvement report: Information given to patients
before appointments and its effect on non-attendance
rate. 323:1298–300.
Hechenbichler, K. and Schliep, K. (2004). Weighted k-
nearest-neighbor techniques and ordinal classifica-
tion.
Kohavi, R. (1995). A study of cross-validation and boot-
strap for accuracy estimation and model selection. In
Proceedings of the 14th International Joint Confer-
ence on Artificial Intelligence - Volume 2, pages 1137–
1143. Morgan Kaufmann Publishers Inc.
Leong, K. C., Chen, W. S., Leong, K. W., Mastura, I., Mimi,
O., Sheikh, M. A., Zailinawati, A. H., Ng, C. J., Phua,
K. L., and Teng, C. L. (2006). The use of text messag-
ing to improve attendance in primary care: a random-
ized controlled trial. Family Practice, 23(6):699–705.
Liew, S., Tong, S. F., Lee, V., Ng, C. J., Leong, K., and
Teng, C. (2009). Text messaging reminders to reduce
non-attendance in chronic disease follow-up: A clini-
cal trial. 59:916–20.
Neal, R. D., Hussain-Gambles, M., Allgar, V. L., Lawlor,
D. A., and Dempsey, O. (2005). Reasons for and con-
sequences of missed appointments in general practice
HEALTHINF 2019 - 12th International Conference on Health Informatics
214

in the uk: questionnaire survey and prospective review
of medical records. BMC Family Practice, 6(1):47.
Park, W. B., Kim, J. Y., Kim, S.-H., Kim, H. B., Kim, N. J.,
Oh, M.-D., and Choe, K. W. (2008). Self-reported
reasons among hiv-infected patients for missing clinic
appointments. International Journal of STD & AIDS,
19(2):125–126.
Russell, S. J. and Norvig, P. (2002). Artificial Intelligence:
A Modern Approach (2nd Edition). Prentice Hall.
Sousa, D. (2017). Medclick: Last minute medical appoint-
ments no-show. Master’s thesis, Instituto Superior
T
´
ecnico, Lisbon.
Turkcan, A., Nuti, L., DeLaurentis, P.-C., Tian, Z., Daggy,
J., Zhang, L., Lawley, M., and Sands, L. (2013). No-
show modeling for adult ambulatory clinics. In Hand-
book of Healthcare Operations Management, pages
251–288.
MedClick: Last Minute Medical Appointments No-Show Management
215
