
Prediction of Malaria Vaccination Outcomes from Gene Expression Data
Ahmad Shayaan, Indu Ilanchezian and Shrisha Rao
International Institute of Information Technology Bangalore, Bengaluru, India
Keywords:
Malaria, Vaccine Trials, Gene Expression, Machine Learning, Statistical Analysis.
Abstract:
Vaccine development is a laborious and time-consuming process and can benefit from statistical machine
learning techniques, which can produce general outcomes based on the patterns observed in the limited avail-
able empirical data. In this paper, we show how limited gene expression data from a small sample of subjects
can be used to predict the outcomes of malaria vaccine. In addition, we also draw inferences from the gene ex-
pression data, with over 22000 columns (or features), by visualizing the data, and reduce the data dimensions
based on this inference for efficient model training. Our methods are general and reliable and can be extended
to vaccines developed against any pathogen. Given the gene expression data from a sample of subjects ad-
ministered with a novel vaccine, our methods can be used to test the outcome of that vaccine, without the
need for empirical observations on a larger population. By carefully tuning the available data and the machine
learning models, we are able to achieve greater than 98% accuracy, with sensitivity and specificity of 0.93 and
1 respectively, in predicting the outcomes of the malaria vaccine in developing immunogenicity against the
malaria pathogen.
1 INTRODUCTION
The testing phase of the vaccine development pro-
cess typically involves three stages. In the first stage,
the vaccine is administered only to a small sample
of subjects and provides empirical observations on
the outcomes of the vaccine. The second and third
stages involve randomized, single- or double-blinded
efficacy testing on larger populations, with appropri-
ate placebo controls (Sanford et al., 1993). However,
“phase 2 results can inaccurately predict safety and/or
effectiveness for medical products in a wide range of
diseases and patient populations” (US Food and Drug
Administration, 2017). These inaccuracies in predict-
ing the safety and effectiveness of vaccines can lead
to adverse outcomes.
The motivation for this work, therefore, is to al-
low data collected in the first stage, although limited,
to be processed by statistical machine learning meth-
ods to produce general observations applicable to a
larger population. In effect, the outcomes of the vac-
cine administration is estimated statistically with only
the data available from the first stage of testing. The
observations from the first stage can help improve the
timing and safety requirements in the second and third
phase trials by predicting the susceptibility of subjects
to a disease after vaccination.
Gene expression data have been previously used in
combination with statistical machine learning meth-
ods for medical diagnostics and risk analysis of
diseases—for example, the risk of acute myeloid
leukemia as studied by Wilson et al. (2006). Related
literature also describes the use of gene expression
data and statistical methods in the vaccine develop-
ment pipeline. Trtica-Majnaric et al. (2010) use neu-
ral networks to predict the outcomes of an influenza
vaccine. However, they use blood sample analysis to
predict the outcomes but not gene expression data.
Gene expression data are used for vaccine respon-
siveness prediction by Bucasas et al. (2011) for the
influenza vaccine. However, their work uses a re-
gression model to predict the antibody responses fol-
lowing vaccination. This approach can be problem-
atic: “While biomarkers have many important uses
in clinical practice and product testing, most have not
been shown to reliably predict clinical outcomes” (US
Food and Drug Administration, 2017).
Our methods, on the other hand, use classifica-
tion models to predict whether the malaria vaccine
RTS,S is effective in developing immune responses
in particular subjects. RTS,S is a malaria vaccine de-
veloped by GlaxoSmithKline (Malaria Vaccine Initia-
tive, 2017). These classification models can be used
to accurately predict vaccine outcomes with given ob-
Shayaan, A., Ilanchezian, I. and Rao, S.
Prediction of Malaria Vaccination Outcomes from Gene Expression Data.
DOI: 10.5220/0007260501550162
In Proceedings of the 12th International Joint Conference on Biomedical Engineering Systems and Technologies (BIOSTEC 2019), pages 155-162
ISBN: 978-989-758-353-7
Copyright
c
2019 by SCITEPRESS – Science and Technology Publications, Lda. All rights reserved
155

servations of the gene expression data collected at
particular times on a limited number of subjects. We
extensively analyze the gene expression data and dis-
cover the relationships between the features (i.e., gene
expression values) and the vaccine outcomes. Based
on these relationships, we reduce the dimensionality
of the data, choose appropriate model classes, and
evaluate their performances. Specifically, we use the
Logistic Regression (LR), Support Vector Machines
(SVMs) and Multi-Layer Perceptron (MLP) models.
We show that our methods are reliable in pre-
dicting the outcomes of the administered vaccine—
whether the vaccinated person is immunized against
the disease or not—with the high accuracy of ∼ 98%,
with specificity and sensitivity being 0.93 and 1 re-
spectively. These methods can be used to efficiently
train statistical models for vaccine testing with a lim-
ited number of data samples. The inferences made
by these statistical models can then be used to predict
the outcomes of possible vaccine trials, thus helping
design better trials.
1
The rest of this document describes our methods
in detail. Section 2 describes the materials and data
used for our study. It discusses in detail the data tun-
ing method to increase the generalization capability of
the model and the procedure for the selection of rel-
evant features for vaccine outcome prediction. Sec-
tions 3 briefly describes statistical machine learning
models suitable for this application and the reasons
for their suitability and the evaluation metrics used
for assessing the performance of our methods. 4 dis-
cusses the results. Section 5 presents the conclusion.
2 MATERIALS
The dataset is based on expression data from a malaria
vaccine trial collected by the Walter Reed Army Insti-
tute of Research (Vahey et al., 2010). The data were
originally collected in September 2009 and were up-
dated recently in August 2018. The gene expressions
are arranged in GeneChip HG-U133 Plus2.0 arrays.
The GeneChip Human Genome U133A Plus 2.0 Ar-
ray is a single array representing around 22,000 well-
characterized human genes that can be used to explore
human biology and disease processes (ThermoFisher,
2001). The dataset was downloaded from the Na-
tional Center for Biotechnology Information (NCBI),
series number GSE18323
2
.
1
Our code and dataset are available at
https://github.com/ashayaan/vaccine efficacy.
2
See https://www.ncbi.nlm.nih.gov/geo/query/acc.cgi?
acc=GSE18323.
The dataset contains gene expression data of 39
human subjects, who were assessed at different times
during the trial. The expression data were collected
on the day of the third vaccination, twenty-four and
seventy-two hours after vaccination, and two weeks
after the vaccination. Finally, the gene expression
data 5 days post-challenge with Plasmodium falci-
parum (the malaria pathogen) were also collected.
Out of the 39 subjects, 13 subjects showed pos-
itive vaccine outcomes and 26 showed negative vac-
cine outcomes. The dataset is arranged in the form of
individual files that contain the gene expression data
for each subject, for every stage of the study. Each
file has 22,278 rows, that contains the gene expres-
sion values normalized to base 2 logarithmic scale.
2.1 Data Tuning
The limited (precisely 39) available data points are
insufficient to train a generalizable machine learn-
ing model. To counter the problem of data scarcity
and to achieve generalizability, we use data aug-
mentation techniques to increase the number of data
points without significantly changing the data distri-
bution (Van Dyk and Meng, 2001).
We augment the dataset by sampling data points
from a normal distribution and adding a minuscule
amount of noise to each of the attributes as suggested
by Van Dyk and Meng (2001). This is repeated for
data available at every time instance: the day of vac-
cination, 24 hours, 72 hours and two weeks after vac-
cination. Noise is sampled from a uniform distribu-
tion in the range 0 to 0.01. The value of the noise
terms is small enough so that the attributes still corre-
spond to the class labels. The range for the uniform
distribution is empirically selected, so that the added
noise does not drastically change the data points and
the models do not overfit the data.
Adding noise does not affect the quality of the data
because real-world data has unavoidable noise from
the instruments that are used to collect the data. By
adding noise explicitly to our attributes, the model can
be made more robust and generalizable. The noise
term should avoid adding bias and should be indepen-
dent of other noise terms (Zhu and Wu, 2004).
A large number of data points should not be cre-
ated by adding noise. If a large number of synthetic
data points were created, these data points would sat-
urate the model, which would overfit the data. While
adding the noise term to the attributes, the ratio of the
protected vs. non-protected subjects should be pre-
served. This further ensures that the behavior of the
model trained on the augmented dataset remains sim-
ilar to a model trained on the actual dataset.
BIOINFORMATICS 2019 - 10th International Conference on Bioinformatics Models, Methods and Algorithms
156
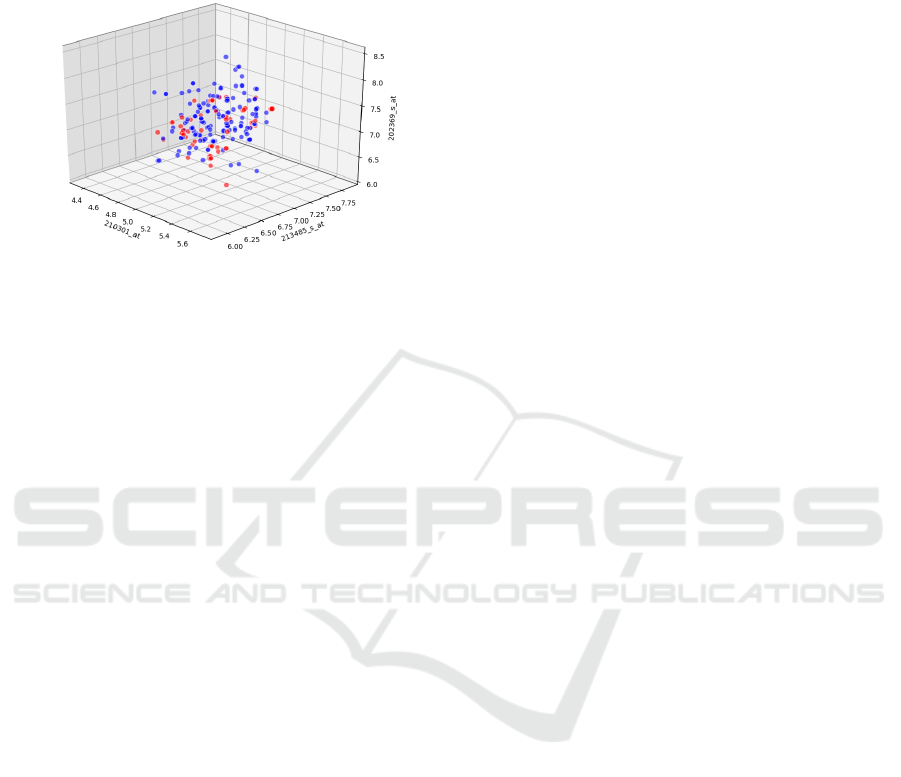
After adding the noise to the data, we plot the
data to see the class distribution. We select three
dimensions out of 22, 278 features to plot a three-
dimensional scatter plot.
Figure 1: Class Distribution.
Figure 1 shows feature clusters in a three-dimensional
subspace of the 22,278-dimensional feature space for
the two different classes—positive vaccine outcomes
and negative outcomes. Although plotted for three di-
mensions sampled uniformly, this plot is general in
nature and holds for any three features selected from
the distribution of all features. Red dots denote data
points showing positive outcomes and blue dots de-
note data points with negative outcomes. It is evident
from this figure that the feature clusters are highly
overlapping for the chosen set of three features. A
three-dimensional space is therefore not suitable for
further analysis, and statistical methods must employ
a larger number of dimensions to achieve separabil-
ity of classes. The feature space is extremely high-
dimensional and the separability in high-dimensional
space can only be analyzed using statistical methods.
We show that in a feature space of dimensions as high
as 700, the classes are linearly separable. The high
dimensionality of the data, with 22,278 attributes, in-
creases the training time and also increases the risk of
overfitting.
2.2 Feature Selection
Feature selection methods help with these problems
by reducing the dimensions without much loss of the
total information. They also help to better understand
the features and their relationship with the target vari-
able. Feature selection methods have also been shown
to increase the prediction accuracy of some models
(Guyon and Elisseeff, 2003).
Two schemes were used to select features from the
entire feature space: Principal Component Analysis
(PCA-features) and sampling of features based on a
normal distribution (sampled features).
PCA is used to reduce the dimensionality of a
large set of variables to obtain a smaller set that still
contains most of the information in the large set. It
works by finding the direction of maximum variances
in the dataset and then projecting the data points in
the space spanned by these directions (Jolliffe, 2011).
The feature sampling scheme works by sampling
features from a uniform distribution of the complete
set of features. For every feature, the scheme either
selects it or not, so the search space for the features is
exponential in the number of features (Dash and Liu,
1997). We use a sample of 719 features, this being
the minimum number of features required for class
separability. The number of features to be sampled
is a hyperparameter and is chosen empirically based
on training results. The model is then trained for ev-
ery set of sampled features and the accuracy score is
evaluated. The set of features that produced the best
accuracy score are then stored and used to train a new
model to make the necessary predictions.
The features are visualized in a pair plot as shown
in Figure 2. A pair plot is used to visualize both
the distributions of single variables and the relation-
ships between two variables. Pair plots can also help
identify trends in the dataset and find the set of fea-
tures that are highly correlated with the target vari-
able. From Figure 2 it can be observed that there ex-
ists a separation between the classes. The attributes
that were used to visualize the data were selected from
the feature space using the feature sampling scheme.
3 METHODS
To predict the outcomes of the malaria vaccination,
various machine learning models were explored. The
augmented gene expression values before the stage
where the subjects were challenged with Plasmodium
falciparum (Pf), were all combined to form the train-
ing set for the model. This was done so that the mod-
els that were being trained can also learn how the out-
comes of the vaccine changes with time. The gene ex-
pression values after the challenge with Pf were used
as the test set. Thus the training set contained 229
data points and the test set contained 51 data points.
3.1 Support Vector Machines
Support Vector Machines (SVMs) have been the core
of numerous domains such as bioinformatics studies,
molecular genetics, DNA, data mining and psychiatry
(Touati et al., 2018).
In order to predict the outcome of the malaria vac-
cine, we use the SVM classification method which
Prediction of Malaria Vaccination Outcomes from Gene Expression Data
157
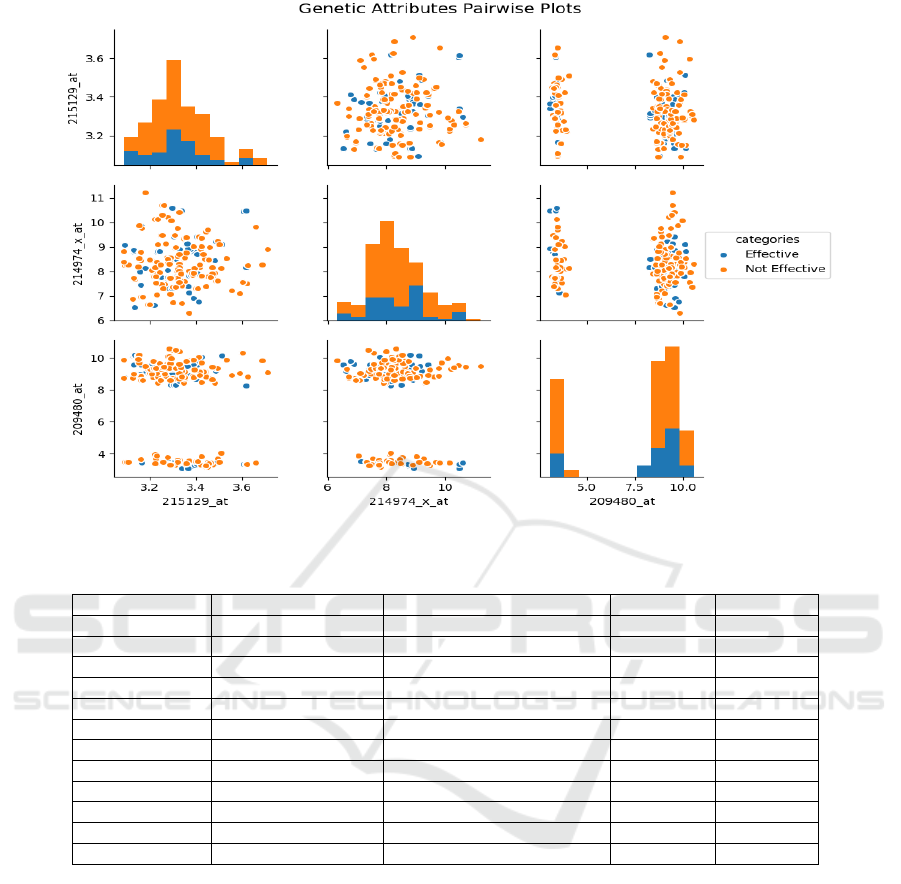
Figure 2: Pairwise plot of attributes.
Table 1: Test set evaluation scores for all the models.
Model Trained Feature Space used Mean Accuracy Score (%) Sensitivity Specificity
LR-1 All Features 94.11 0.8 1
LR-2 Sampled Features 98.03 0.93 1
LR-3 PCA-Features 43.17 0.27 0.5
RBF-SVM All Features 70.58 0 1
RBF-SVM Sampled Features 70.58 0 1
RBF-SVM PCA-Features 70.58 0 1
Linear-SVM All Features 96.07 0.87 1
Linear-SVM Sampled Features 92.15 1 0.89
Linear-SVM PCA-Features 49.01 0.58 0.27
MLP-ReLU All Features 70.58 0 1
MLP-tanh All Features 70.58 0 1
MLP-Logistic All Features 70.58 0 1
aims to find the optimal hyperplane that separates two
different classes. We also used the kernel trick in
SVM to make the predictions—the kernel function
k(x) projects the data points to a higher dimensional
feature space where the data points may be linearly
separable. We use two variants of kernel function—
linear kernel (Linear-SVM) and RBF kernel (RBF-
SVM). The RBF kernel tries to separate the classes
using a nonlinear separator, whereas the linear kernel
tries to fit a linear separator. In general, the RBF ker-
nel is more powerful than the linear kernel (Hsu et al.,
2016).
For each of these variants, we train three differ-
ent SVM models—first using all features, the second
and third using PCA-features and sampled features as
described in Section 2.2.
The SVMs learn the best hyperplane that separates
the classes into the projected features space. At the
time of prediction, the class labels are assigned based
on which side of the hyperplane the point is present
on. For every trained model, the necessary evaluation
parameters, described later, were recorded.
3.2 Logistic Regression
The aim of the Logistic Regression (LR) model was to
capture the linear relationship between the target vari-
ables and the attributes. The LR model can only cap-
ture the linear relationship between the input vector
and the target variable because the hyperplane that it
BIOINFORMATICS 2019 - 10th International Conference on Bioinformatics Models, Methods and Algorithms
158

creates to separate the classes is formed by taking lin-
ear combinations of the input vector (Trtica-Majnaric
et al., 2010).
To predict the outcomes of the vaccine, three LR
models were tested. One of the LR models was tested
on all of the features that are available in the dataset.
The second was tested only on the features that were
extracted as described in Section 2.2 by the sampling
scheme (sampled features), and the third on the PCA-
features. At the output a binary variable was used,
with 0 representing the set of subjects that had neg-
ative vaccine outcomes, and 1 representing the set of
subjects that showed positive vaccine outcomes.
3.3 Multi-Layer Perceptrons
Three Multi-Layer Perceptrons (MLPs) were trained
to predict the outcomes of the vaccine. All the
MLPs consisted of 200 hidden layers. The initial
learning rate for the gradient descent algorithm was
set as 0.001 and was adjusted after every iteration.
The maximum number of training epochs for all the
MLPS was set to 500. The MLP models were trained
on the entire feature set available in the dataset.
The MLPs differed from one another in the acti-
vation functions used to introduce non-linearity. The
activation functions that were used to train the MLPs
were ReLU activation, tanh activation, and logistic
activation. The ReLU activation function is a half-
rectified non-linearity; it is linear for positive values
and zero otherwise (Zhang and Woodland, 2015). The
tanh activation function is a re-scaled version of the
logistic activation function, i.e., the output range of
tanh from -1 to 1 is a scaled version of the output
range of the logistic activation over the range from 0
to 1 (Karlik and Olgac, 2011). Different activation
functions were used to see if the evaluation parame-
ters change with the change in the activation function.
MLPs were used because they make no prior as-
sumptions concerning the data distribution. They can
model highly non-linear functions and can be trained
to accurately generalize when presented with new
data (Gardner and Dorling, 1998). These features of
MLPs make their use a very good alternative to other
statistical approaches. It has been shown that MLPs
can be trained to approximate virtually any smooth
function (Hornik et al., 1989).
3.4 Evaluating Model Performance
To evaluate the performances of the models, the mean
accuracy score was recorded for every model. In ad-
dition to the mean accuracy score, we also calculate
the positive hit rate and the negative hit rate to better
compare the models based on their predictions. The
positive hit rate is also called model sensitivity, while
the negative hit rate is called model specificity. These
two quantities are important for investigating the abil-
ity of a model to accurately recognize positive and
negative outcomes (Trtica-Majnaric et al., 2010). The
sensitivity is computed as follows:
sensitivity =
a
a + d
(1)
where a is the number of true positives, and d is
the number of false negatives. The specificity is cal-
culated as follows:
specificity =
b
b + c
(2)
where b is the number of true negatives, and c is
the number of false positives. Any model with high
sensitivity can be used to identify the subjects with
the successful administration since a model with high
sensitivity can correctly identify the subjects show-
ing positive outcomes. A model with a high speci-
ficity can be used to confirm the test results since it
is more specific in recognizing the subjects that are
not affected by the vaccine. In general, a good model
should have high values for both sensitivity and speci-
ficity (Simon and Boring, 1990).
The true positive and false positive rates were also
used to plot the Receiver Operating Characteristic
(ROC) curve and calculate the area under the curve
(AUC). An ROC curve is a graph showing the per-
formance of a classification model at all classifica-
tion thresholds, and the AUC measures discrimina-
tion (Hanley and McNeil, 1982). Discrimination is
the ability of a model to correctly classify those with
and without the effects of the vaccine.
4 RESULTS AND DISCUSSION
4.1 Evaluation Metrics
Table 1 shows the evaluation of the LR, SVM and
MLP models with variations: different subsets of fea-
tures for LR, SVM, and MLP, linear or non-linear
separation for SVM, and various activation functions
for MLPs. The best performing model with the high-
est mean accuracy score of 98.03% is the LR model
trained with the sampled features. This model also
has high specificity and sensitivity values, 0.93 and 1
respectively. It is also the most efficient in the sense
that it uses only a subset of features (and not all fea-
tures) in the training data to make inferences on test
data. The Linear-SVM model using all features also
Prediction of Malaria Vaccination Outcomes from Gene Expression Data
159

Table 2: AUC for different models.
Model Feature set uses Area under the ROC curve
LR All Features 0.90
LR Sampled Features 0.97
Linear-SVM All Features 0.93
Linear-SVM Sampled Features 0.94
has high mean accuracy score, sensitivity and speci-
ficity of 96.07%, 0.87 and 1 respectively. These val-
ues are only slightly lower than the best model, but
this level of accuracy is achieved after training on the
whole set of features, unlike the LR model which uses
only a subset of features. The MLP models with dif-
ferent activation functions were also tested on the fea-
tures given by PCA as well as on the sampled features,
but the mean accuracy was very low and thus these
models have not been reported here.
Table 3: Average sensitivity and specificity of the LR mod-
els.
Actual Outcomes
Predicted Outcomes
0 1
LR-complete
0 1.0 0.0
1 0.20 0.80
LR-sampled
0 1.0 0.0
1 0.07 0.93
Table 4: Average sensitivity and specificity of the SVM
models
Actual Outcomes
Predicted Outcomes
0 1
SVM-complete
0 1.0 0.0
1 0.13 0.87
SVM-sampled
0 0.89 0.11
1 0.0 1.0
Tables 3 shows the sensitivities, specificities, false
positives and false negatives of the LR models using
all features and sampled features respectively. Sim-
ilarly, Table 4 shows these four values for the SVM
models trained using all features and sampled fea-
tures. The false positive rates (with actual outcome
0 and predicted outcome 1) and the false negative
rates (with actual outcome 1 and predicted outcome
0) are low for all of these models. The best LR model
trained with sampled features also gives the lowest
false negative rate of 0.07.
4.2 Comparison of Linear and
Non-Linear Models
It is evident from Table 1 that linear models, such as
LR and Linear-SVM, significantly outperform non-
linear models, such as RBF-SVM, MLP with ReLU,
tanh and logistic activations. The higher accuracies
of linear models on test data indicate that the posi-
tive and negative vaccine outcome classes are sepa-
rated by a linear decision boundary. The use of a non-
linear model, such as RBF-SVM or MLP, results in
overfitting of training data, which hinders the gener-
alizability of the model on the test set. Hence, we
observe lower test set accuracies with the use of non-
linear models than with linear models. Linear models
have accuracies over 95%, whereas non-linear models
only have accuracies of ∼ 70% (as shown in Table 1),
which is a significant difference. Due to overfitting,
these models tend to classify all samples to the posi-
tive outcome class, hence resulting in a specificity of
1, with 0 sensitivity.
Thus, we have shown empirically that the data
points are linearly separable in the sampled feature
space consisting of over 700 features and the com-
plete feature space with over 22000 features. How-
ever, the data points are not separable in a lower-
dimensional space (for example, the 3-dimensional
feature space shown in Figure 1). In that case, the
features are undersampled.
4.3 Effect of Feature Selection
The mean prediction accuracy of the LR model in-
creases when it is trained only on the sampled fea-
tures (Table 1). This indicates that there are some fea-
tures present in the entire feature space that are not
highly correlated with the target variable, and if these
features were considered, the model may misclassify
leading to lower prediction accuracy. The LR model
trained on the sampled features has a higher sensi-
tivity score, and hence is better to find the subjects
positively affected by the vaccine, than the LR model
trained on all of the features.
The Linear-SVM models do not demonstrate a
similar boost in the performance when trained only
on the sampled features. Table 1 shows that the mean
accuracy for the model trained only on the sampled
BIOINFORMATICS 2019 - 10th International Conference on Bioinformatics Models, Methods and Algorithms
160
features is slightly lower than the model trained on
the entire feature set.
However, the Linear-SVM model trained only on
the sampled features had the highest sensitivity of all
the models evaluated. This model is the best when the
requirement is to find the subjects positively affected
by the vaccine. The high sensitivities for both the LR
and Linear-SVM models trained on the sampled fea-
tures suggest that the feature set that was used to train
these models is better than the entire feature set, for
predicting the positive outcomes of the vaccine.
The models trained on the PCA-features do not
perform as well as the other models. The sensitiv-
ity and specificity for these models are also very low.
Thus, the features extracted with the PCA scheme,
that is the directions of maximum variances, are not
suitable for estimating the target variables.
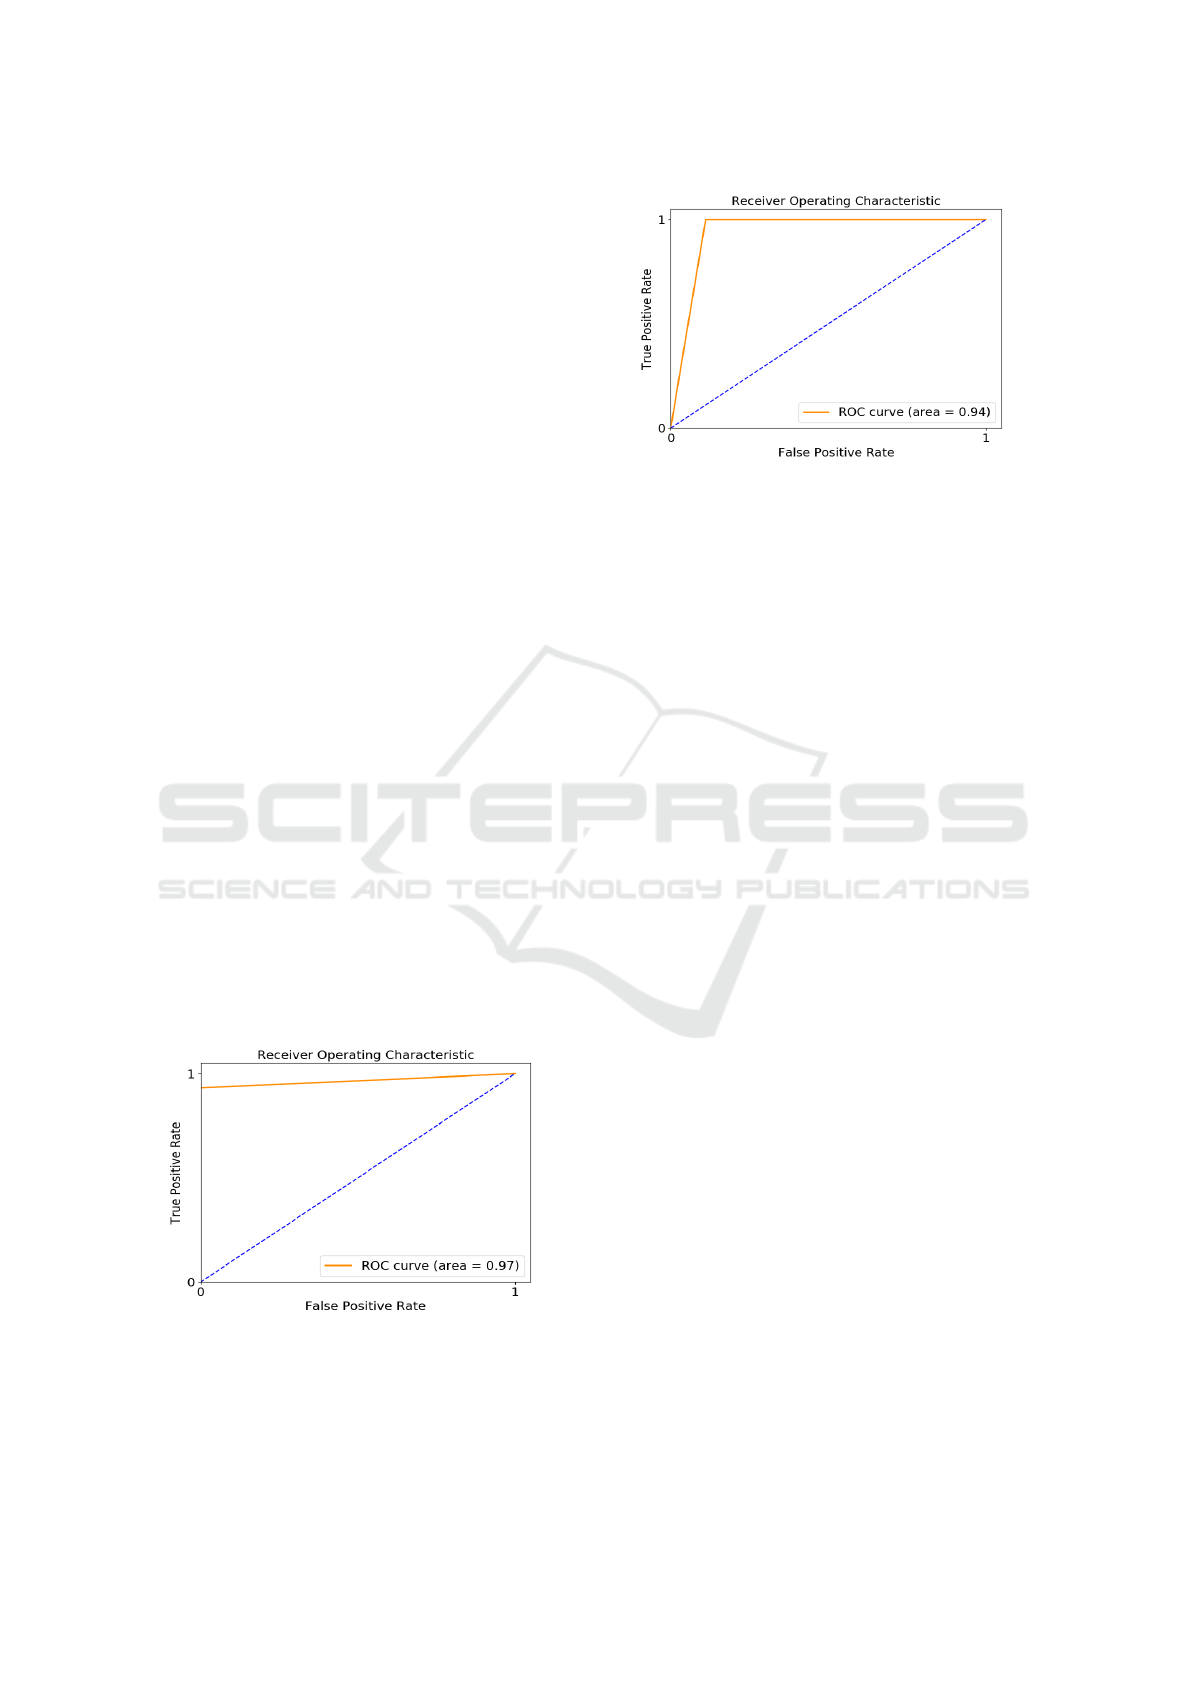
4.4 ROC and AUC
For the linear models, the ROC curves were plotted
and the area under the curve (AUC) was also com-
puted. The AUC is classification-threshold-invariant,
and measures the quality of the model’s predictions
irrespective of what classification threshold is cho-
sen (Hanley and McNeil, 1982). The higher the AUC,
the better the model in distinguishing a positive ex-
ample from a negative one. Table 2 gives the area
under the ROC curve for the different models. The
LR model trained on the sampled feature set has the
highest AUC, indicating that it distinguish between
the two classes with a very high probability. The AUC
for the Linear-SVM trained on the sampled features is
higher than the AUC of the Linear-SVM trained on all
of the features, which on account of the higher sensi-
tivity of the first model.
Figure 3: ROC Curve for the LR trained on sampled fea-
tures.
Figures 3 and 4 show the ROC curves for the LR
and Linear-SVM models trained on the sampled fea-
tures. The ROC curves are not smooth because of the
Figure 4: ROC Curve for the Linear-SVM trained sampled
features.
sparsity of data points. The dashed line in the fig-
ures represents the threshold AUC, which is 0.5. A
model with AUC less than the threshold is no better
than randomly assigning class labels (Hanley and Mc-
Neil, 1982).
5 CONCLUSION
In this paper, we have used gene expression data to
predict the outcomes of a vaccine trial, with malaria
as the exemplar. Prior works have tried to predict the
outcomes of vaccine trials (e.g., for influenza), but
have not used gene expression data to do so. Our work
builds machine learning models to predict, with high
accuracy, the test outcomes of a malaria vaccine from
the gene expression data. The models we present are
able to predict the outcomes of the vaccine with a
mean accuracy of 98.03%. Such a high prediction
accuracy indicates that the study of gene expressions
can be successfully used to accurately predict the out-
comes of the malaria vaccine. The models also have
a high sensitivity and specificity values, i.e., the same
model can be used to correctly identify subjects that
had a positive reaction to the vaccine as well as sub-
jects who did not respond to the vaccine.
The models described in this paper can be applied
in real-world vaccine trials to screen human subjects
and predict the outcomes of the vaccine. Our models
can be used in conjunction with standard procedures
to improve safety and/or effectiveness of vaccine tri-
als. Using the models, we also find that some of the
gene expression attributes are more useful than oth-
ers, in predicting vaccination outcomes. These gene
expression attributes which are highly correlated with
the class labels can be used to design better vaccines,
which may be effective for larger populations. Our
models can also be used to assist other primary health
care research that considers the outcomes of vaccine
trials.
Prediction of Malaria Vaccination Outcomes from Gene Expression Data
161

The methods used in this paper are not limited to
predicting the outcomes of the malaria vaccine—they
can also be used to predict the outcomes for any vac-
cine for which the gene expression data are available
in the HG-U133 Plus2.0 format. The feature selection
scheme (Section 2.2) can be used to find the gene ex-
pression attributes that are better correlated with the
target variable for any particular vaccine for which
predictions are to be made. Along with feature se-
lection schemes, non-linear models such as MLP can
be used where appropriate, to capture complex rela-
tionships (in case of some other diseases) between the
gene expression data and the vaccine outcomes.
REFERENCES
Bucasas, K., M Franco, L., Shaw, C., Bray, M., Wells, J.,
Ni
˜
no, D., Arden, N., Quarles, J., Couch, R., and Bel-
mont, J. (2011). Early patterns of gene expression cor-
relate with the humoral immune response to influenza
vaccination in humans. The Journal of Infectious Dis-
eases, 203:921–9.
Dash, M. and Liu, H. (1997). Feature selection for classifi-
cation. Intelligent Data Analysis, 1(3):131–156.
Gardner, M. W. and Dorling, S. (1998). Artificial neural
networks (the multilayer perceptron)—a review of ap-
plications in the atmospheric sciences. Atmospheric
Environment, 32(14-15):2627–2636.
Guyon, I. and Elisseeff, A. (2003). An introduction to vari-
able and feature selection. Journal of Machine Learn-
ing Research, 3(Mar):1157–1182.
Hanley, J. A. and McNeil, B. J. (1982). The meaning and
use of the area under a receiver operating characteris-
tic (roc) curve. Radiology, 143(1):29–36.
Hornik, K., Stinchcombe, M., and White, H. (1989). Multi-
layer feedforward networks are universal approxima-
tors. Neural Networks, 2(5):359–366.
Hsu, C.-W., Chang, C., and Lin, C.-J. (2016). A practical
guide to support vector classification. https://www.
csie.ntu.edu.tw/ cjlin/papers/guide/guide.pdf.
Jolliffe, I. (2011). Principal component analysis. In In-
ternational Encyclopedia of Statistical Science, pages
1094–1096. Springer.
Karlik, B. and Olgac, A. V. (2011). Performance analysis of
various activation functions in generalized mlp archi-
tectures of neural networks. International Journal of
Artificial Intelligence and Expert Systems, 1(4):111–
122.
Malaria Vaccine Initiative (2017). RTS, S. https://www.
malariavaccine.org/malaria-and-vaccines/first-
generation-vaccine/rtss.
Sanford, J. P., Philipose, N. M., Mitchell, V. S., et al. (1993).
The Children’s Vaccine Initiative: Achieving the Vi-
sion. National Academies Press.
Simon, D. and Boring, J. R. (1990). The History, Physi-
cal, and Laboratory Examinations. 3rd edition. But-
terworths.
ThermoFisher (2001). Genechip
TM
human genome U133
plus 2.0 array. https://www.thermofisher.com/order/
catalog/product/900468.
Touati, R., Messaoudi, I., ElloumiOueslati, A., and Lachiri,
Z. (2018). Classification of Helitron’s Types in the
C.elegans Genome based on Features Extracted from
Wavelet Transform and SVM Methods. In Proceed-
ings of the 11th International Joint Conference on
Biomedical Engineering Systems and Technologies -
Volume 4: BIOINFORMATICS,, pages 127–134. IN-
STICC, SciTePress.
Trtica-Majnaric, L., Zekic-Susac, M., Sarlija, N., and Vi-
tale, B. (2010). Prediction of influenza vaccination
outcome by neural networks and logistic regression.
Journal of Biomedical Informatics, 43(5):774–781.
US Food and Drug Administration (2017). 22 Case
Studies Where Phase 2 and Phase 3 Trials had Diver-
gent Results. https://www.fda.gov/downloads/
aboutfda/reportsmanual
sforms/reports/ucm535780.pdf.
Vahey, M. T., Wang, Z., Kester, K. E., Cummings, J., Hep-
pner Jr, D. G., Nau, M. E., Ofori-Anyinam, O., Co-
hen, J., Coche, T., Ballou, W. R., et al. (2010). Ex-
pression of genes associated with immunoproteasome
processing of major histocompatibility complex pep-
tides is indicative of protection with adjuvanted RTS,
S malaria vaccine. The Journal of Infectious Diseases,
201(4):580–589.
Van Dyk, D. A. and Meng, X.-L. (2001). The art of data
augmentation. Journal of Computational and Graph-
ical Statistics, 10(1):1–50.
Wilson, C. S., Davidson, G. S., Martin, S. B., Andries, E.,
Potter, J., Harvey, R., Ar, K., Xu, Y., Kopecky, K. J.,
Ankerst, D. P., et al. (2006). Gene expression profil-
ing of adult acute myeloid leukemia identifies novel
biologic clusters for risk classification and outcome
prediction. Blood, 108(2):685–696.
Zhang, C. and Woodland, P. C. (2015). Parameterised
sigmoid and relu hidden activation functions for dnn
acoustic modelling. In Sixteenth Annual Conference
of the International Speech Communication Associa-
tion.
Zhu, X. and Wu, X. (2004). Class noise vs. attribute noise:
A quantitative study. Artificial Intelligence Review,
22(3):177–210.
BIOINFORMATICS 2019 - 10th International Conference on Bioinformatics Models, Methods and Algorithms
162
