
Dynamic Software Visualization of Quantum Algorithms with Rainbow
Boxes
Jean-Baptiste Lamy
LIMICS, Universit
´
e Paris 13, Sorbonne Universit
´
e, Inserm, 93017 Bobigny, France
Keywords:
Quantum Computing, Multiple-qubit State, Quantum Teleportation, Software Visualization, Set Visualization.
Abstract:
Quantum computing has emerged recently as a new computational paradigm. It considers quantum bits
(qubits) instead of classical bits. However, quantum algorithms are often very difficult to understand. In
this paper, we propose a tool for quantum software visualization. It presents visually the state of multiple-
qubits and its evolution at runtime during the execution of a quantum program. This tool allows a unique
representation of a quantum state, contrary to the usual vector notation. We show how the problem of visualiz-
ing a quantum state can be reduced to a set visualization problem, and our tool uses rainbow boxes to visualize
the resulting sets. We also present the application of the proposed tool to quantum teleportation, an algorithm
of high importance in cryptography. Finally, we discuss the limit of this approach and its perspectives, in
particular for teaching quantum computing.
1 INTRODUCTION
Quantum computing combines quantum physics,
computer science and information theory. In the re-
cent years, it has emerged as a new computational
paradigm, targeting quantum computers. It has been
showed that quantum algorithms could outperform
classical algorithms in terms of complexity (Rieffel
and Polak, 2014). However, quantum theory is not in-
tuitive. It is considered as almost impossible to under-
stand properly: R. Feynman, a renowned physician,
said “I think I can safely say that nobody understands
quantum mechanics”. Consequently, it is also diffi-
cult to teach.
Software visualization (Price et al., 1993; Bassil
and Keller, 2001) is a field that aims at representing
graphically software: e.g. algorithms, source codes,
and/or runtime data. In particular, dynamic software
visualization tools have been proposed to explore vi-
sually the behavior of a program at run-time, for ex-
ample in Java (De Pauw et al., 2001). Such tools
aim at improving the understanding of what a pro-
gram is doing, and helping identifying memory leaks,
deadlocks and performance bottlenecks. However, to
our knowledge, no software visualization approaches
were proposed for tracing the execution of quantum
programs, despite the use of visualization tools has
demonstrated some success in the teaching of quan-
tum physics (Rebello and Zollman, 1999).
In the present paper, we propose a tool for quan-
tum software visualization. Its objective is to facilitate
the understanding of a quantum algorithm. It presents
visually the quantum state of the system and its evo-
lution at runtime during the execution of a quantum
program. We propose to reduce the problem of the
visualization of an entangled multiple-qubit state to a
set visualization problem. Then, we resolve this prob-
lem using rainbow boxes, a technique for set visual-
ization that was introduced a few years ago (Lamy
et al., 2016; Lamy et al., 2017). We illustrate the
proposed approach through its application to the vi-
sualization of quantum teleportation, an algorithm of
importance for cryptography.
The rest of the paper is organized as follows. Sec-
tion 2.1 gives background on quantum computing and
set visualization. Section 3 describes how we formal-
ize a quantum state uniquely. It also describes the
visual design of our approach and the implementation
details. Section 4 provides two examples of the pro-
posed visual approach. Finally, section 5 discusses
the proposed approach and its perspectives, before
concluding.
Lamy, J.
Dynamic Software Visualization of Quantum Algorithms with Rainbow Boxes.
DOI: 10.5220/0007247801550163
In Proceedings of the 14th International Joint Conference on Computer Vision, Imaging and Computer Graphics Theory and Applications (VISIGRAPP 2019), pages 155-163
ISBN: 978-989-758-354-4
Copyright
c
2019 by SCITEPRESS – Science and Technology Publications, Lda. All rights reserved
155

2 RELATED WORKS
2.1 Quantum Computing
The field of quantum computing (Rieffel and Polak,
2014) has produced some interesting new algorithms,
and it has been proved that quantum algorithms can
perform better than their classical counterparts, in
terms of complexity. However, quantum computing
is still a matter of research, and it remains widely not
understood.
In a quantum computer, classical bits are replaced
by quantum bits (qubits). A qubit can be in two states,
noted |0i and |1i, but it can also be in a superposi-
tion of these two states, noted a|0i+ b|1i, where a
and b are complex numbers such as
|
a
|
2
+
|
b
|
2
. In the
Dirac’s BraKet notation, |0i and |1i are two vectors
defined by |0i =
1
0
and |1i =
0
1
in their matrix
form
1
. These vectors are the orthonormal basis of the
qubit’s state space, and the general state of a qubit
corresponds to a|0i+ b|1i =
a
b
.
However, when measured, the qubit return only
a single value, either 0 or 1, with probabilities
|
a
|
2
and
|
b
|
2
, respectively. Future measurement of the
same qubit will always return the same value, because
measuring the qubit causes a quantum decoherence in
which the superposition is lost. Thus, a single qubit
can store much more information than a classical bit,
but all this information cannot be obtained: only one
classical bit of information can be extracted from one
qubit. Nevertheless, the additional information in the
qubit can be used during quantum computation, be-
fore measurement.
In addition to the probability of measuring 0 or 1,
a 1-qubit state is characterized by its relative phase
angle: an infinity of superpositions yielding e.g. a
50%-50% ratio of 0 and 1 exist. Each of the two terms
a|0i and b|1i has a global phase, however, only the
difference between the two, i.e. the relative phase,
matters from a physical or logical point of view.
When considering multiple-qubits, the value of
the various qubits may not be independent from each
other : this phenomenon is known as quantum en-
tanglement. Consequently, an entangled system of n
qubits cannot be viewed as a sum of qubits. It should
be considered as a single entity, and its state is a su-
perposition of 2
n
values. For example, the state of
a 3-qubit system is a superposition of 2
3
= 8 values,
noted a|000i+ b|001i+ c|010i+ d|011i+ e|100i+
1
Matrix rows and columns are understood to be in bit
order, e.g. 0, 1 for one qubit, 00, 01, 10, 11 for two, etc.
f |101i+g|110i+h|111i and corresponds to a matrix
with 1 column and 8 rows.
Some multiple-qubit states are not entangled but
separable. Those states can be factored in a tensor
product composed of several states involving fewer
qubits. For example, the state
1
√
2
|000i+
1
√
2
|011i can
be factored in |0i⊗
1
√
2
|00i+
1
√
2
|11i
. Here, the
first qubit is not entangled, while the last two qubits
are. To conclude, the quantity of information stored
in multiple qubits grows exponentially with the num-
ber of qubits. However, as previously with a single
qubit, only one classical bit can be measured for each
qubit. Therefore, when read, the 3-qubit system above
would returns only 3 classical bits, e.g. 011. Relative
phases also exist in multiple-qubit states.
Several approaches have been proposed for quan-
tum computing, and quantum circuit is currently the
main one. Similarly to a classical logical circuit,
gates are applied on the qubits. These gates act on
a superposition of values. A gate is defined by an
unitary 2
k
square matrix, where k is the number of
qubits the gate is applied to. The gate is applied to
a state vector by multiplying the gate matrix by the
vector matrix. For example, NOT (also called X) is
a single-qubit gate; it will transform the one-qubit
state
q
1
4
|0i+
q
3
4
|1i into
q
3
4
|0i+
q
1
4
|1i. Other
typical gates include: the Z gate that flips the phase
of one qubit, the Hadamard gate (H) that creates su-
perposition from a non-superposed state of one qubit,
the CNOT gate (Conditional NOT) that considers two
qubits and performs a NOT gate on the second qubit
whenever the first qubit is |1i, and the CZ gate (Con-
ditional Z) that flips the phase of the second qubit
whenever the first qubit is |1i. These gates are de-
fined as follows:
NOT =
0 1
1 0
, Z =
1 0
0 −1
, H =
1
√
2
1 1
1 −1
CNOT =
1 0 0 0
0 1 0 0
0 0 0 1
0 0 1 0
, CZ =
1 0 0 0
0 1 0 0
0 0 1 0
0 0 0 −1
The following example applies a NOT gate to the
state vector
q
1
4
|0i+
q
3
4
|1i:
NOT ×
q
1
4
|0i+
q
3
4
|1i
=
0 1
1 0
×
q
1
4
q
3
4
=
q
3
4
q
1
4
=
q
3
4
|0i+
q
1
4
|1i
IVAPP 2019 - 10th International Conference on Information Visualization Theory and Applications
156
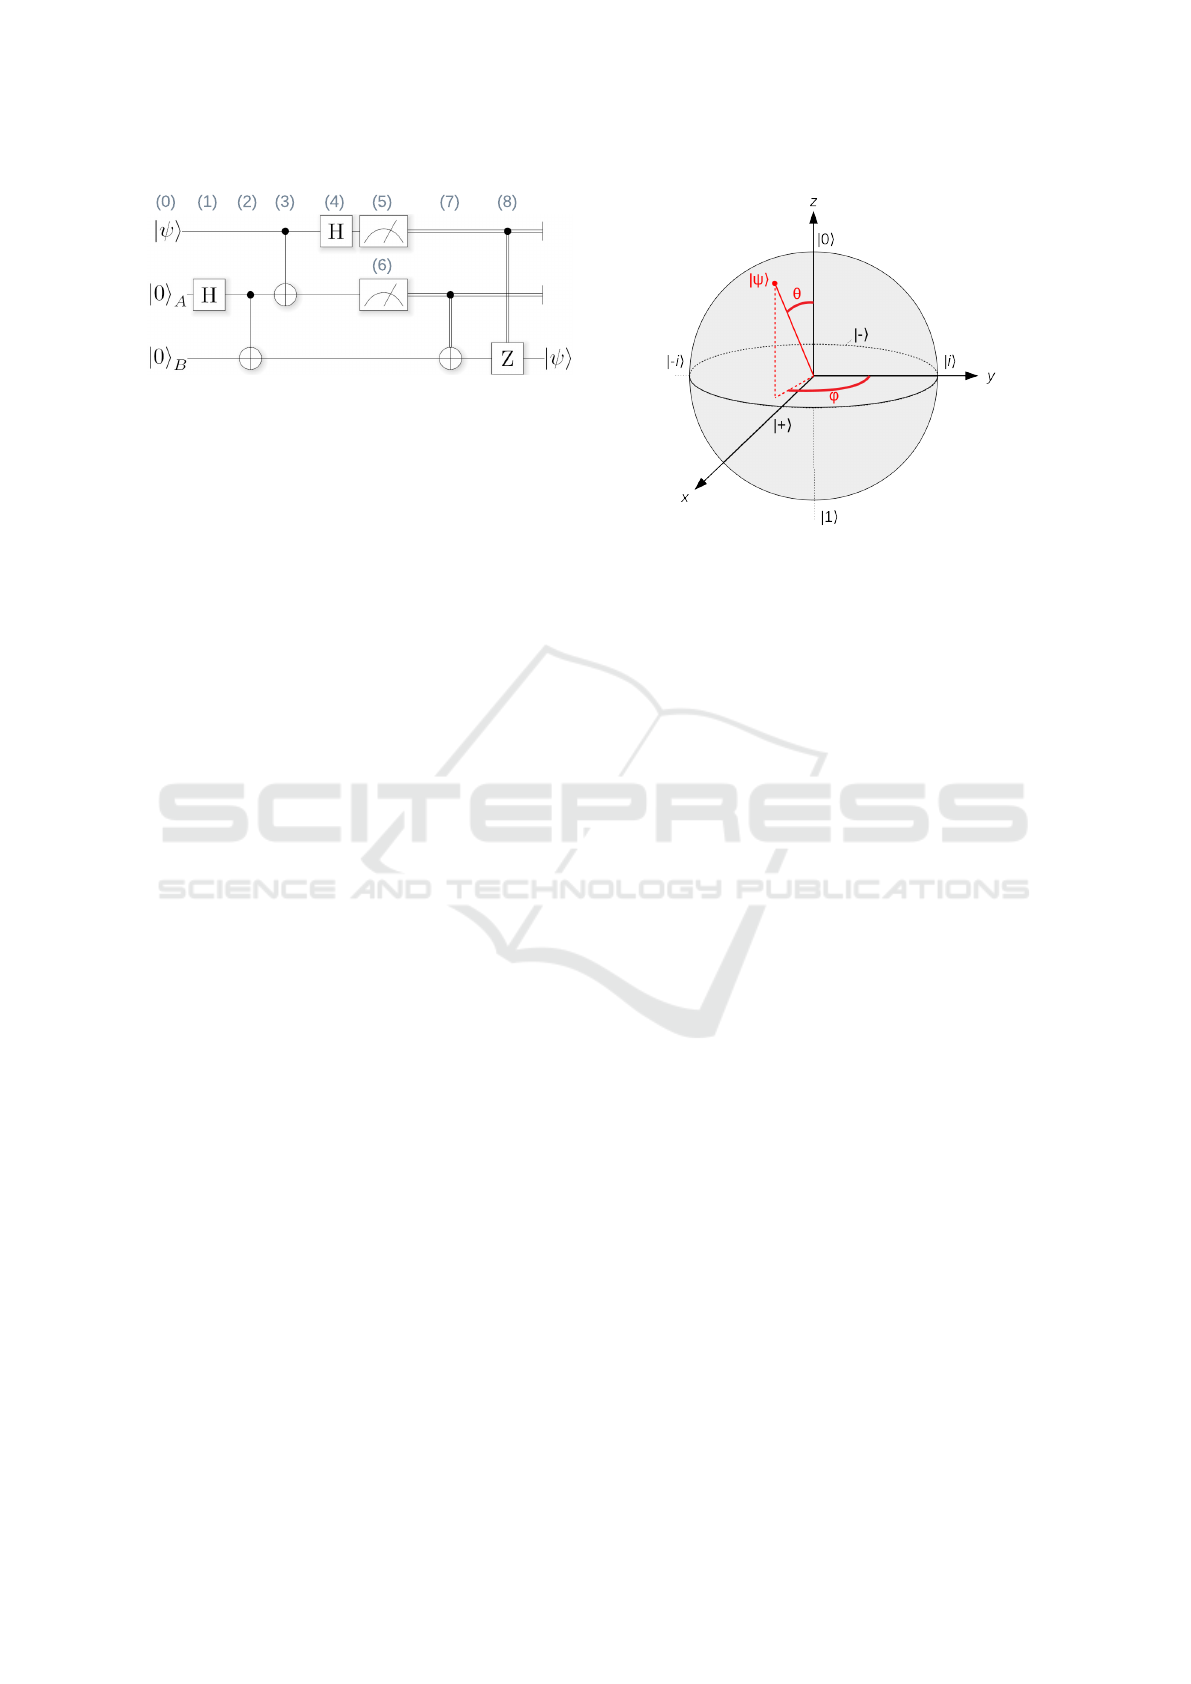
Figure 1: Block diagram of a quantum circuit performing
quantum teleportation. Each horizontal line represent a qbit.
2.2 Visual Approaches for Quantum
Computing
Few visual approaches have been proposed for quan-
tum computing. First, block circuit diagram repre-
sentations of quantum circuits have been proposed,
e.g. for the IBM Q Experience (Cross et al., 2017).
They show the qubits as horizontal lines, and the gates
and measurements of a given program as boxes on
the lines of the qubits they are applied to. Gates and
measurements are applied from left to right. For ex-
ample, Figure 1 shows an example of block diagram
for a quantum circuit, with 3 qubits and 8 gates (la-
beled (1) to (8) and corresponding to the 8 steps of the
progam). This circuit corresponds to quantum tele-
portation, a well-known quantum algorithm that al-
lows to “teleport” the state of one qubit (labelled |ψi)
to another qubit. The destination qubit may be phys-
ically in a distant place, thanks to quantum entangle-
ment. Hence the name “teleportation”.
Block diagrams provide an interesting visualiza-
tion of a quantum program. However, they do not
indicate the qubit states after each gate. Moreover,
they can be error-prone because, due to entanglement,
applying a gate on a qubit may modify other qubits.
For example, in Figure 1, the gate (3) is a CNOT gate
applied on qubit 1 and 2 (represented by the two top-
most horizontal lines). One may abusively consider
that qubit 3 (the bottom-most line) is not modified by
gate (3). Actually, because the preceeding gate (2)
entangled qubit 2 and 3, the states of those two qubits
can no longer be separated. Therefore, gate (3) does
modify qubit 3.
The state of a single qubit |ψi= a|0i+b|1iis usu-
ally visualized by a point at the surface of the Bloch
sphere (Figure 2). The point can be identified by two
angles θ and ϕ. The probability of obtaining 0 or 1
when measuring the qubit depends on the position of
the point on the vertical axis z and thus on angle θ.
Angle ϕ corresponds to the relative phase of the state.
It has no impact on the measured value, but it could
impact the results of future operations, depending on
Figure 2: The Bloch sphere.
the gates applied. Single-qubit gates correspond to
rotation on the Bloch sphere, for example the NOT
gate corresponds to a rotation of 180° around the x
axis (thus this gate is also called the X gate). The sur-
face of the Bloch sphere is very practical and visual,
but misleading: |0i and |1i are not two opposite di-
rections of the same axis (as shown in Figure 2) but
two perpendicular dimensions (as the matrix forms of
|0i and |1i suggest). Moreover, this approach cannot
visualize multiple-qubit states.
The extended complex plane CP∪{∞}can also be
used for visualizing a single-qubit state, but it is even
less intuitive than the surface of the Bloch sphere, be-
cause |0i and |1i are represented differently (|0i is the
origin while |1i is the “infinity point” noted ∞).
Finally, bar charts are commonly used to represent
the probability of the various superposed states (Fran-
cik J, 2002), in particular for teaching the Grover al-
gorithm.
2.3 Set Visualization
Set visualization is a classical task in information vi-
sualization. Alsakallah et al. (Alsallakh et al., 2016)
reviewed the techniques for overlapping set visual-
ization. They distinguished 6 approaches: (1) Euler
and Venn diagrams and their variants, (2) overlays
on a map, (3) node-link diagrams, (4) matrix-based
techniques, (5) aggregation-based techniques, and (6)
scatter plot-based techniques.
In this work, we chose rainbow boxes, a technique
we recently introduced (Lamy et al., 2016; Lamy
et al., 2017) for visualizing 2-25 elements and 5-100
sets. Later, a proportional version of rainbow boxes
(Lamy and Tsopra, 2017) was proposed for represent-
ing artificial neurons. In the present work, rainbow
boxes were chosen because (a) they can be gener-
Dynamic Software Visualization of Quantum Algorithms with Rainbow Boxes
157
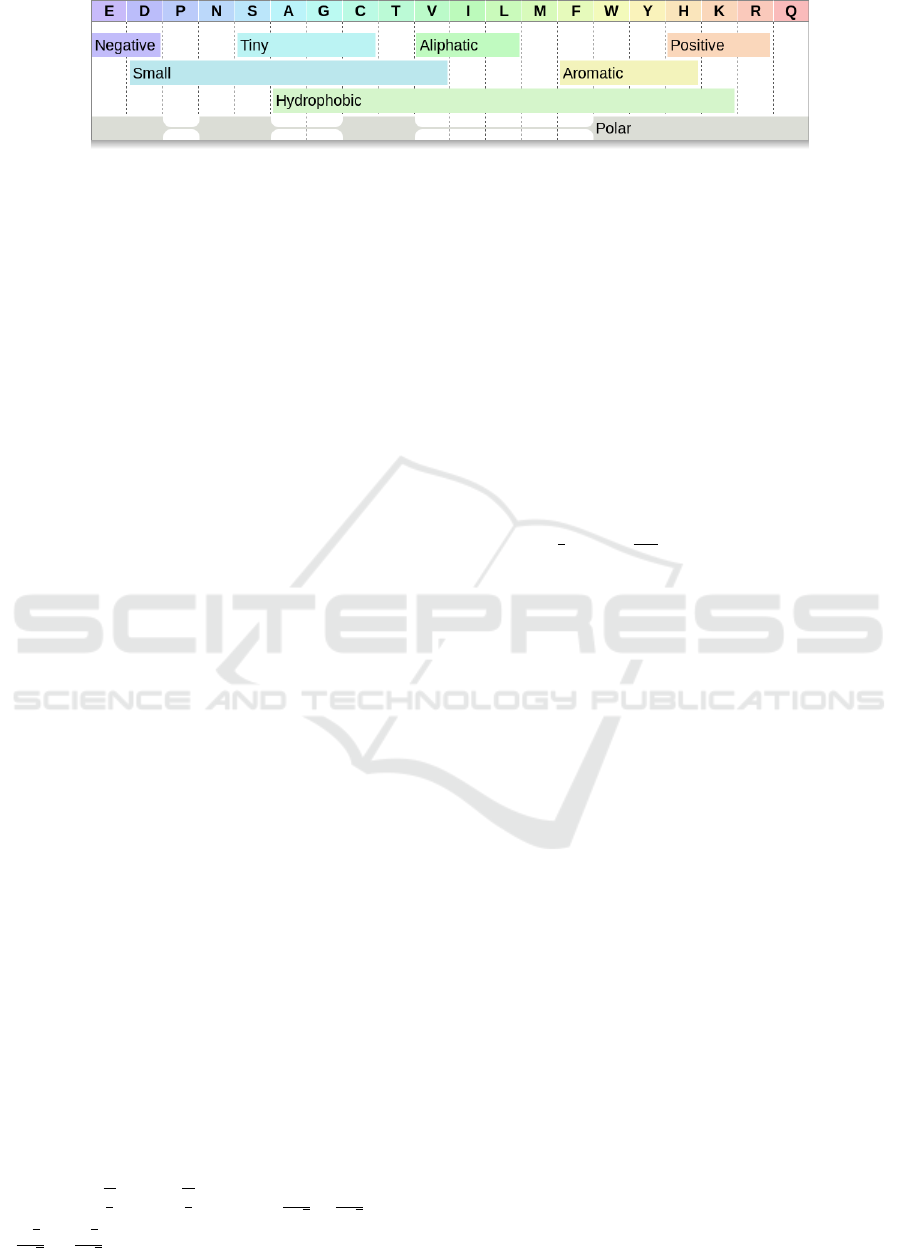
Figure 3: Example of rainbow boxes displaying the properties of amino acids.
ated automatically (contrary to proportional Venn di-
agrams, which can be generated exactly only up to
4 sets (Rodgers P, 2014)), and (b) they offer several
additional visual variables, including box color, box
height and box texture (contrary to other diagrams
such as Leibniz’s linear diagrams (Bellucci et al.,
2014)).
Figure 3 shows an example of rainbow boxes dis-
playing amino acid properties (Lamy JB, 2018). The
elements (i.e. the amino acids, identified by their one-
letter code) are shown in columns, and the sets (i.e.
their shared properties) are represented by rectangular
boxes placed below column headers. Each box covers
the columns corresponding to the elements belonging
to the box’s set. The column order is computed using
a heuristic optimization algorithm. It tries to order the
columns so as the elements belonging to each set are
contiguous. When it is not possible to have them con-
tiguous for a given set, “holes” are present in the set’s
box (in Figure 3, the polar box has 3 holes). Boxes
are stacked vertically, with the largest at the bottom.
Two boxes can be next to each other, as long as they
do not occupy the same columns.
3 METHODS AND DESIGN
3.1 Unique Description of a
Multiple-qubit State
Multiple-qubits states are usually formalized by vec-
tors, as in section 2.1. These vectors are useful for
computing the effects of gates, but they are not in-
tuitive, due to their complex coordinates. Moreover,
they do not exactly represent the physical or logical
state of a quantum system. In particular, the vector
representation is not unique: because of the global
phase phenomenon, several vectors correspond to the
same quantum state. Although mathematically differ-
ent, any two vectors |ψi and e
iφ
×|ψi actually rep-
resent the same state, for any value of φ (i being the
imaginary number). This is denoted |ψi∼e
iφ
|ψi. For
example,
q
1
4
|0i+
q
3
4
i|1i and
1
2
√
2
+
1
2
√
2
i
|0i+
√
3
2
√
2
i −
√
3
2
√
2
|1i are two different vectors represent-
ing the same state. Thus, we searched for a formal de-
scription of a multiple-qubit state that is both unique
and as intuitive as possible.
Let us consider the vector form of an entangled
multiple-qubit state |ψi= a
1
|0...0i+... +a
2
n
|1...1i=
2
n
∑
j=1
a
j
|B
j
i, where |B
j
i are the base vectors of the state
space. Each term of this sum includes a possible mea-
sured base state |B
j
i and a complex coefficient a
j
=
α
j
+ β
j
i. A (relatively) intuitive notion is the prob-
ability of obtaining |B
j
i when |ψi is measured. This
probability is p
j
=
a
j
2
=
α
j
2
+
β
j
2
. The remnant
piece of information describing the state is the phase
ϕ
j
= Re
1
i
×log
a
j
|
a
j
|
in radians, where Re() re-
turns the real part of a complex number. ϕ
j
is equiva-
lent to angle ϕ on the Bloch sphere (section 2.2), but
for mutiple qubit states. In order to avoid the global
phase phenomenon described above, and to have a
unique representation of the state, a reference phase
must be chosen. We arbitrarily chose as reference
the phase ϕ
0
of the lowest bit-value base state |B
j
i
with a non-null coefficient a
j
(e.g. for a 2-qubit state,
the phase of |00i, or if the corresponding coefficient
is null, the phase of |01i, then the one of |10i, etc).
Then, the relative phase is ϕ
0
j
=
ϕ
j
−ϕ
0
mod 2π.
Consequently, a pair (p
j
, ϕ
0
j
) ∈ R
2
(with 0 ≤ p
j
≤ 1
and 0 ≤ϕ
0
j
< 2π, or ϕ
0
j
= 0 for reference phase) allows
a unique and more intuitive representation of one co-
efficient a
j
.
Now, let us consider a set of qubits q =
{
q
1
, ..., q
n
}
and their quantum state |ψi, separable in a tensor
product of m factors: |ψi = |ψ
1
i⊗... ⊗|ψ
m
i with
1 ≤m ≤n. Each factor |ψ
k
i can be defined by q
k
⊆q,
the subset of qubits it involves, and a sum of terms
|ψ
k
i =
∑
a
k j
|B
k j
i. As explained above, each coef-
ficient a
k j
can be fully defined by a pair (p
k j
, ϕ
0
k j
),
using as reference phase the phase of the lowest bit-
value term with a non-null coefficient (since factor are
separable, one reference is required for each). There-
fore, the state |ψi can be uniquely defined by a set
of quadruplet
n
(q
k
, |B
k j
i, p
k j
, ϕ
0
k j
)
o
, each quadruplet
corresponding to one term of one separable factor.
For example, the previously mentioned 3-qubit
IVAPP 2019 - 10th International Conference on Information Visualization Theory and Applications
158
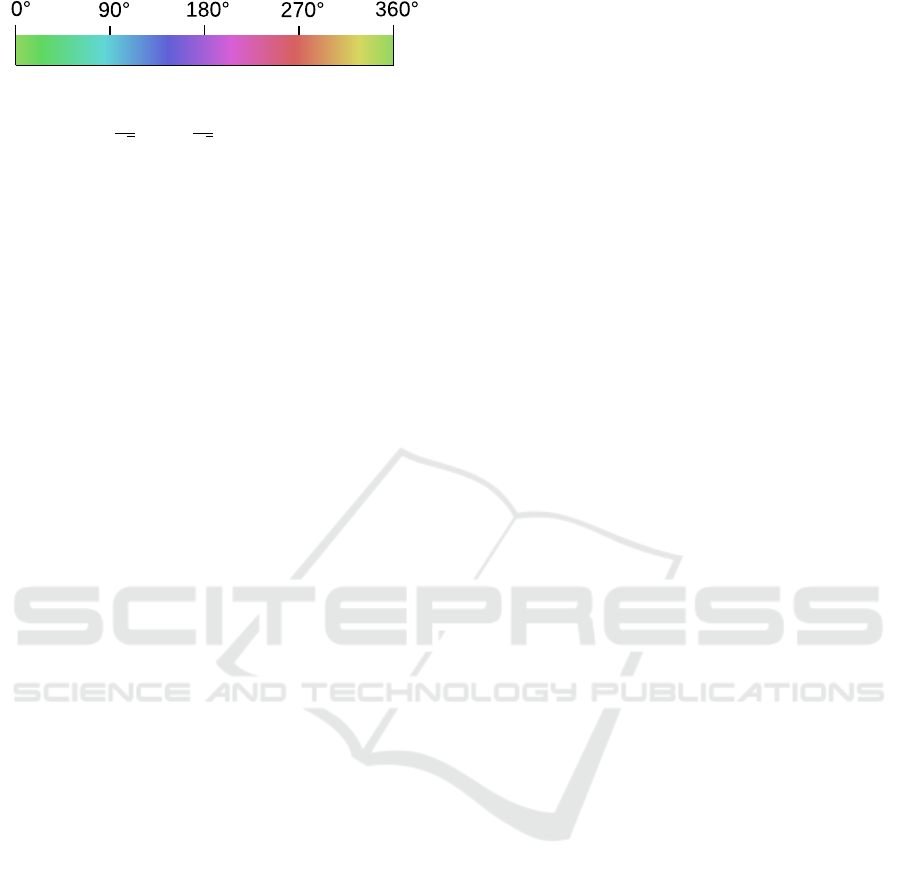
Figure 4: Hue color scale for relative phase.
state |0i ⊗
1
√
2
|00i+
1
√
2
|11i
is uniquely repre-
sented by the following quadruplets:
- (
{
q
1
}
, |0i, 1, 0)
- (
{
q
2
, q
3
}
, |00i, 0.5, 0)
- (
{
q
2
, q
3
}
, |11i, 0.5, 0)
They are read as follows: “qubit q
1
takes value 0
with probability 100%”, “qubits q
1
and q
2
take values
00 with probability 50%”, and “qubits q
1
and q
2
take
values 11 with probability 50% and a relative phase
of 0”.
This representation requires to distinguish separa-
ble states from entangled ones, in order to determine
the reference phases appropriately (i.e. one reference
per separable factor). We achieved this by tracing en-
tanglement through the program: at the beginning, all
qubits are separated. Single-qubit gates do not create
entanglement. On the contrary, multiple-qubit gates,
like CNOT or CZ, entangle the two qubits they are
applied on. Finally, measurements destroy the super-
position with regards to the measured qubit, and thus
unentangle it.
3.2 Visual Representation
The visualization of a multiple-qubit quantum state
defined by a set of quadruplets
n
(q
k
, |B
k j
i, p
k j
, ϕ
0
k j
)
o
is a set visualization problem, if we consider the first
member of the quadruplets: the qubits q
1
, q
2
,... are
the elements and each quadruplet contains a set made
of these elements. The last three members of the
quadruplets can be seen as three “attributes” of the
set.
We represent those sets with rainbow boxes
(Lamy et al., 2016; Lamy et al., 2017), with one col-
umn per qubit and one box per quadruplet, i.e. one
box for each term of each separable factor of the quan-
tum state. In the rainbow boxes, set membership (i.e.
which qubits are involved by a given term) is visually
encoded by the horizontal position of the box. We
place the boxes with the lower bit-value at the bottom.
We used three additional visual variables for vi-
sualizing the rest of the quadruplets. Probability p
k j
is represented by the height of the box. Phase ϕ
0
k j
is
represented by the box color. The color is gray when
there is no relative phase, i.e. when the state of the
qubits is certain and there is no superposition. Other-
wise, the color hue indicates the relative phase, rang-
ing through the entire rainbow spectrum (see color
scale in Figure 4). We choose green to represent a
phase of 0 (i.e. equal to the reference phase). Finally,
the binary value of |B
k j
i is given in the box label, and
it is also represented by the box texture, by adding
hatches in the columns corresponding to qubits mea-
sured at 1.
We add detail-on-demand interactivity: when the
mouse is over a box, a popup label displays the term
a
j
|B
j
i represented by the box, as well as the proba-
bility in percentage and the phase angle in degree.
In order to visualize the evolution of the qubit state
through the various steps of an algorithm, we juxta-
pose several rainbow boxes, one per each step.
3.3 Implementation Details
We implemented our system in Python 3. We used
ProjectQ (Steiger et al., 2018; H
¨
aner et al., 2018), a
Python module for quantum computing. ProjectQ can
compile quantum circuits for various quantum com-
puters, but it can also simulate a quantum computer
on a classical computer. In simulation mode, one can
access to the “inner state” of the qubits (through the
cheat() method) and obtain the complex coefficients
a
j
that characterize the current quantum state. On the
contrary, on a real quantum computer, the inner state
cannot be obtained: as explained previously, mea-
suring qubits breaks the superposition. We therefore
worked in simulation mode.
4 APPLICATION EXAMPLES
In this section, we illustrate our approach through a
simple example on the Bell pair, and the visualization
of a quantum teleportation.
4.1 Bell Pair
Figure 5 shows the state of two qubits during the cre-
ation and the measurement of a Bell pair. A Bell
pair is a pair of two qubits having the maximal level
of quantum entanglement. For each step, a rainbow
boxes visualization of the current state is given, and
labeled with the quantum gate applied at this step. In
each visualization, a qubit is represented by a column
and a term of a separable factor of the quantum state
by a box. Consequently, entangled states are repre-
sented by boxes that span across several columns, in-
dicating which qubits are entangled. On the contrary,
non-entangled (i.e. separable) states are represented
by 1-column boxes. For each step, the label uses the
ProjectQ syntax, for example “H | q1” means “apply
the Hadamard (H) gate to the first qubit”.
Dynamic Software Visualization of Quantum Algorithms with Rainbow Boxes
159
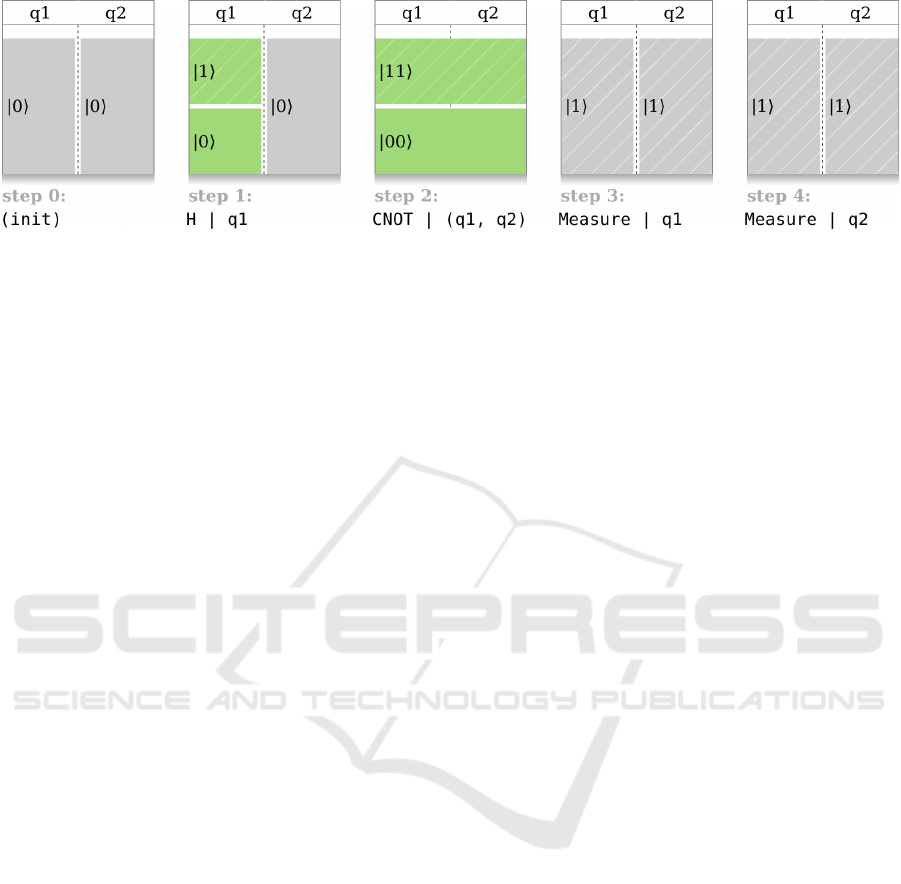
Figure 5: Visualization of the creation and the measurement of a Bell pair, using the proposed approach.
In Figure 5, step 0 corresponds to the initial state
of the system. The two qubits q
1
and q
2
have the |0i
value and are not entangled. In step 1, we apply the
Hadamard (H) gate to q
1
. It creates a superposition of
|0i and |1i. We can see at a glimpse that |0i and |1i
would be measured with the same probability (same
box size), and that q
1
and q
2
are still not entangled.
In addition, the two boxes are green: it indicates that,
now, the relative phase does matter. Since the two
boxes have the same color, they have the same phase
(i.e. the relative phase is null). In step 2, we apply
the CNOT gate to q
1
and q
2
. This gate performs a
NOT gate on q
2
whenever q
1
= |1i. It results in an
entangled state (the boxes span across the two qubits),
corresponding to one of the four possible Bell pairs.
In step 3, we measure q
1
, and the obtained value
is 1 (notice that we could also have obtained 0, with
a 50-50% ratio). Due to entanglement, measuring q
1
also determine the value of q
2
. We can see in the fig-
ure that q
2
is now 1, and that the entanglement is now
broken. In step 4, we measure q
2
and we obtain 1
(with certainty). Notice that measuring q
2
does not
modify the quantum state, contrary to step 3, because
the value of q
2
was already determined at the previous
step. Consequently, the rainbow boxes are the same
after step 3 and 4.
4.2 Quantum Teleportation
Figure 6 shows the state of three qubits during the ex-
ecution of quantum teleportation. Quantum teleporta-
tion is an algorithm with huge potential applications
in cryptography. It allows to “teleport” the value |ψi
of a qubit through a shared Bell pair. Figure 1 pre-
sented the circuit for quantum teleportation (the step
numbers correspond in the two figure).
Step 0 shows the initial step: q
1
= |ψi contains
an interesting value that Alice want to send to Bob,
in a secured manner. We arbitrarily chose |ψi =
(−0.195+0.6i)|0i+0.776|1i, a 1-qubit state that has
a non-null relative phase and a probability of about
40% of being measured at 1. Notice how the colors
indicate the relative phase: the |0i box is green (it is
the reference phase) and the |1i box has a different
color. The other qubits q
2
and q
3
starts at |0i, as pre-
viously.
Steps 1 and 2 create an entangled Bell pair in q
2
and q
3
, as previously. After this step, q
3
can be send
to a distant person: Bob, the one to whom we want to
“teleport” the value of q
1
. Entanglement must be pre-
served during the sending (this is physically possible,
although it remains technically difficult). Sending q
3
is safe, because it currently contains no information
about |ψi.
In step 3, we apply the CNOT gate on q
1
and q
2
. It
entangles all the three qubits, because q
2
and q
3
were
already entangled together. However, notice that, at
this step, the probability of measuring 0 or 1 for any of
the qubit have not changed. By looking at the hatches,
we can verify that about 40% of the entire q
1
column
have hatches.
In step 4, we apply the H gate on q
1
. Due to en-
tanglement, it also modifies q
2
and q
3
. Notice that
a new color appeared, orange. It is the color op-
posite to blue, and thus corresponds to the opposite
phase. Notice also how “balanced” are the 8 boxes:
the probability of measuring 0 or 1 for any qubit, in-
cluding q
1
, is now 50%-50%, and relative phases are
also balanced between the blue and the opposite or-
ange phase. However, the initial value |ψi of q
1
is
still encoded in the system. If we look at the two
bottom-most boxes, we see that they correspond to
|ψi in terms of phase and of probability (relatively,
i.e. if we consider only those two boxes). Similarly,
the next two boxes just above correspond to |ψi, but
are vertically swapped. The next two correspond to
|ψi, but with a phase flip: the relative phase is op-
posed. The last two correspond to |ψi, but both verti-
cally swapped and phase-flipped.
In step 5, we measure q
1
. Due to entanglement, it
reduces the possible states for the two remnant qubits.
Here, we measured 1, thus only states in which the
value of q
1
is 1 remain.
In step 6, we measure q
2
. Here, we measured
IVAPP 2019 - 10th International Conference on Information Visualization Theory and Applications
160
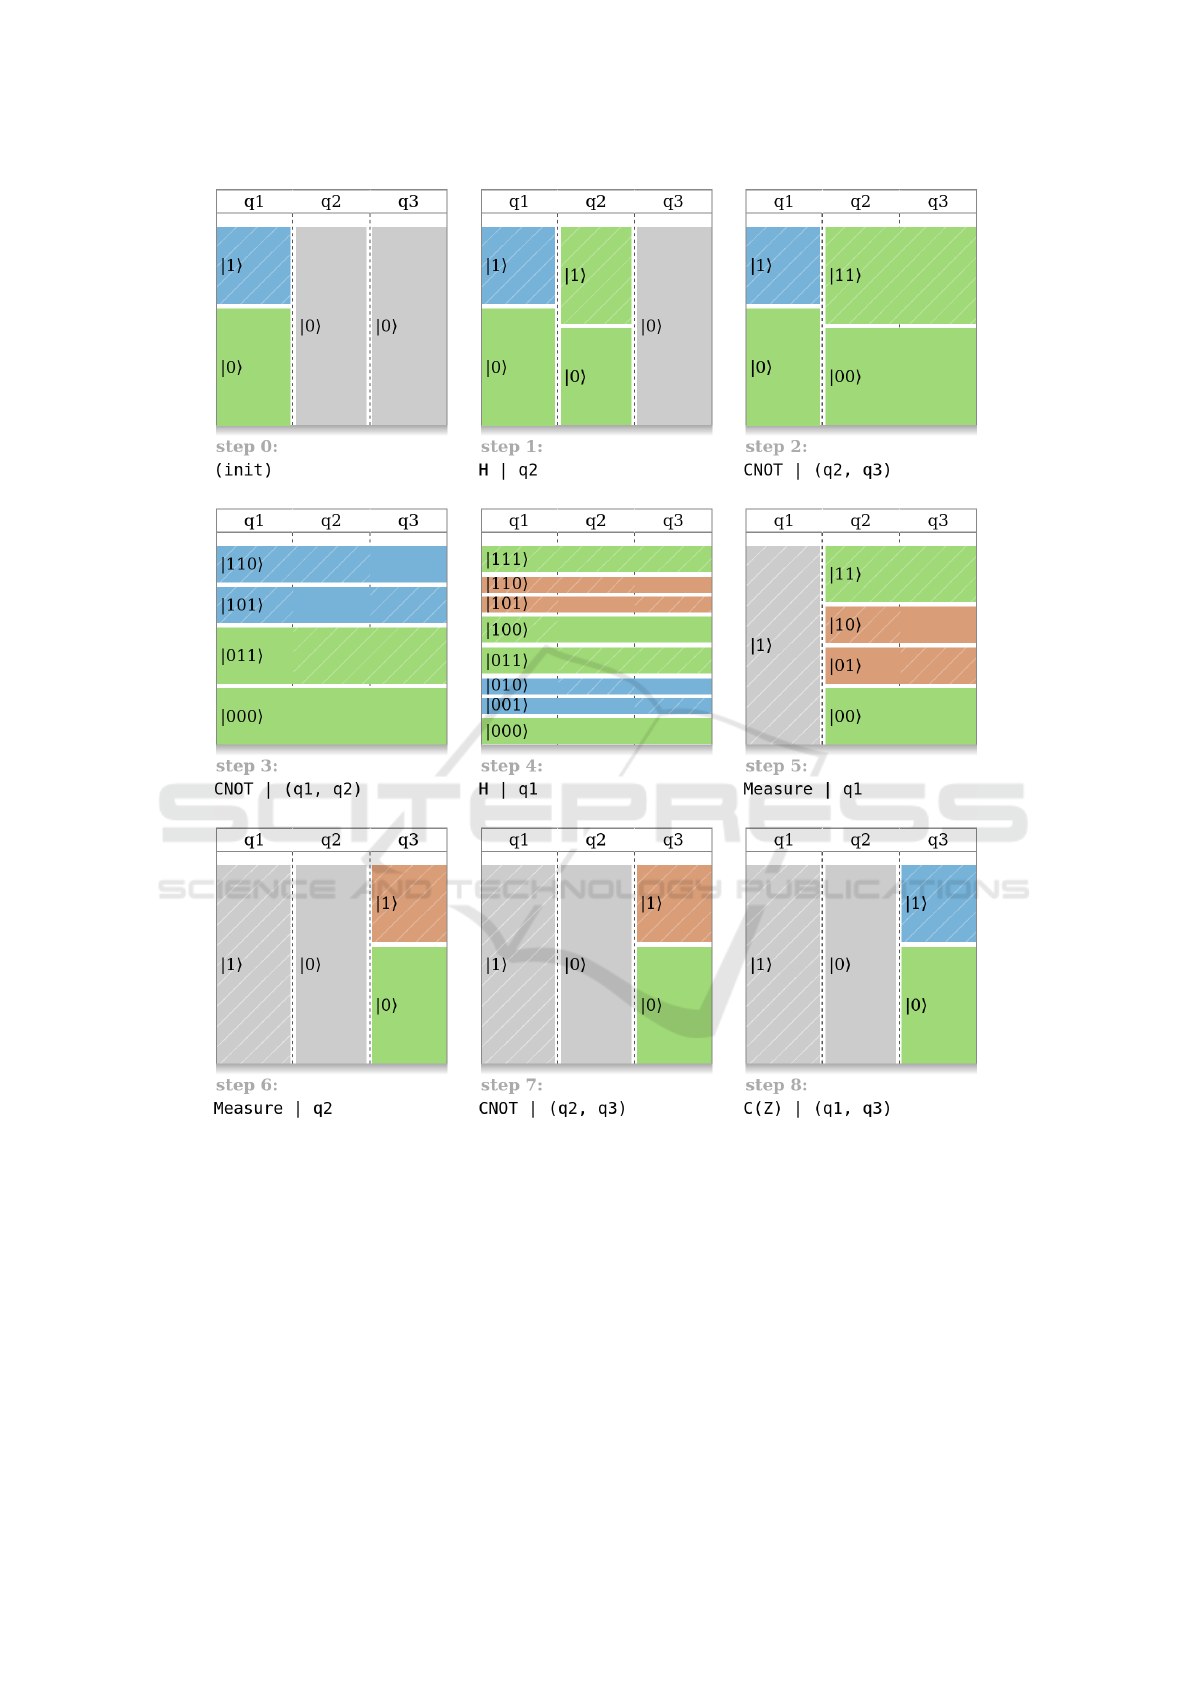
Figure 6: Visualization of the state of the system during the execution of quantum teleportation.
0. Since we measured q
1
= 1 and q
2
= 0, only the
states starting with |01...i remains, compared to step
4. Now, Alice must send to Bob the two binary values
she measured, e.g. q
1
= 1 and q
2
= 0. Sending these
values is safe, because they are not related to |ψi.
In step 7 and 8, Bob reconstructs the value |ψi,
using the binary values measured for q
1
and q
2
. If
q
1
= 0 and q
2
= 0, the two superposed states remain-
ing in q
3
correspond to the two bottom-most boxes of
step 4. They directly correspond to |ψi. If q
2
= 1,
the two boxes are vertically swapped, i.e. |0i and |1i
are swapped. A NOT gate can be used to swap them
again, reverting to |ψi. Since this NOT gate must be
applied only if q
2
= 1, we apply a CNOT gate on q
2
and q
3
(step 7). Then, if q
1
= 1, we seen at step 4 that
the phase is flipped. Thus we apply a CZ (conditional
phase flip) gate on q
1
and q
3
(step 8).
Here, we measured q
1
= 1 and q
2
= 0. The CNOT
gate (step 7) does nothing, because its conditional
qubit (q
2
) is 0. The CZ gate (step 8) applies the Z
gate, because q
1
= 1, and flips the phase: the orange
box of step 7 is now blue. We can verify visually that
the initial state of q
1
is the same that the final state of
q
3
: we successfully teleported the value |ψi.
Dynamic Software Visualization of Quantum Algorithms with Rainbow Boxes
161

5 DISCUSSION AND
CONCLUSION
Mathematically speaking, the visualization of an en-
tangled n-qubit state corresponds to the visualization
of a point in the complex plane CP
2
n
−1
. In this paper,
we showed that it can be reduced to a set visualiza-
tion problem. We visualized those sets using rainbow
boxes, and we demonstrated the proposed approach
on the well-known algorithm for quantum teleporta-
tion. Our visualization of a quantum state is unique,
i.e. a given state can be represented in a single man-
ner, contrary to the vectors commonly used in quan-
tum computing.
Our visual approach could be very interesting for
teaching quantum computing. Many programmers
may be interested in quantum programming in the fu-
ture, but many of them do not necessarily have the
mathematical background required for reading most
books on that topic. Moreover, it is well known that
quantum theory is not intuitive at all and almost im-
possible to understand, although it can be used to
predict the evolution of a system accurately and it
has been widely validated experimentally. Since we
still do not understand fully how quantum algorithms
work, being able to visualize it during runtime is a
step forward. In particular, it greatly helped the au-
thor to better apprehend quantum computing.
This visual tool allows an empirical and experi-
mental approach to quantum computing, through the
“trial and error” method. It permit testing an algo-
rithm with various initial values or algorithmic vari-
ants, and observe how the states of the system are
changed. For example, one may visualize quantum
teleportation of diverse states |ψi and observe how
changing |ψi impacts the state of the system at each
step. One can also observe how the system states dif-
fer when different values are measured for q
1
and q
2
.
Finally, one can test variants, in order to answer to
questions such as “What about performing the two
measurements in step 5 and 6 in reverse order?” or
“What about performing step 7 and 8 in reverse or-
der?”. Through experiments, one would conclude that
measurements can be performed in any order, while
step 7 and 8 must be performed in order.
In rainbow boxes, finding the optimal column or-
der is usually a complex problem. On the contrary,
in this particular application of rainbow boxes, it was
not, because of the small number of qubits. Most
quantum algorithms use only a few qubits, or a vari-
able number of qubits but can be demonstrated with
few of them. Here, we presented the qubits in their
order in the registry, without performing optimiza-
tion at all. It worked well, because, in many algo-
rithm, qubits are already “sorted” in order to put next
to each other qubits that are entangled with multiple-
qubit gates such as CNOT. If entangled qubits were
not next to each other (e.g. if we swap q1 and q2 in
Figure 6), holes would appear in the boxes.
To determine which quantum states are separable,
we traced entanglement during the program execu-
tion. This method works well for simple algorithms,
including quantum teleportation. However, it cannot
identify all separable states. For example, a second
CNOT gate may be used to unentangle an entangled
state. A more robust method would consist in per-
forming tensor product factorization from the state
vector. But deciding whether a state is separable (i.e.
the separability problem) is, in the general case, NP-
hard (Gharibian S, 2010).
In order to represent the evolution of a quantum
state, we juxtaposed several rainbow boxes views.
A similar approach was proposed by Masoodian et
al. (Masoodian and Koivunen, 2018) with linear dia-
grams for the temporal visualization of sets.
Perspectives of this work include (a) the use of
proposed visualization with students in computer sci-
ence and its evaluation in this context, (b) its improve-
ment by implementing automatic tensor product fac-
torization and by integrating it more deeply with Pro-
jectQ to provide a visual platform for quantum com-
puting, and (c) its extension to other quantum com-
puting paradigms beyond quantum circuits, such as
adiabatic quantum computation and one-way quan-
tum computation.
REFERENCES
Alsallakh, B., Micallef, L., Aigner, W., Hauser, H., Miksch,
S., and Rodgers, P. (2016). The State-of-the-Art of Set
Visualization. Computer Graphics Forum, 35(1):234–
260.
Bassil, S. and Keller, R. K. (2001). Software Visualization
Tools: Survey and Analysis. In International Work-
shop on Program Comprehension (IWPC), pages 7–
17.
Bellucci, F., Moktefi, A., and Pietarinen, A. V. (2014). Di-
agrammatic autarchy: linear diagrams in the 17th and
18th centuries.
Cross, A. W., Bishop, L. S., Smolin, J. A., and Gambetta,
J. M. (2017). Open quantum assembly language.
arXiv preprint, arXiv:1707.03429.
De Pauw, W., Jensen, E., Mitchell, N., Sevitsky, G., Vlis-
sides, J., and Yang, J. (2001). Visualizing the execu-
tion of Java programs. In Revised Lectures on Soft-
ware Visualization, pages 151–162 .
Francik J (2002). Quantum software. Studia informatica,
23(2A):48.
IVAPP 2019 - 10th International Conference on Information Visualization Theory and Applications
162

Gharibian S (2010). Strong NP-hardness of the quantum
separability problem. Quantum Information and Com-
putation, 10(3&4):343–360.
H
¨
aner, T., Steiger, D. S., Svore, K. M., and Troyer, M.
(2018). A software methodology for compiling quan-
tum programs. Quantum Science and Technology,
3(2):020501.
Lamy, J. B., Berthelot, H., Capron, C., and Favre, M.
(2017). Rainbow boxes: a new technique for over-
lapping set visualization and two applications in the
biomedical domain. Journal of Visual Language and
Computing, 43:71–82.
Lamy, J. B., Berthelot, H., and Favre, M. (2016). Rain-
bow boxes: a technique for visualizing overlapping
sets and an application to the comparison of drugs
properties. In International Conference Information
Visualisation (iV), pages 253–260, Lisboa, Portugal.
Lamy, J. B. and Tsopra, R. (2017). Translating visually
the reasoning of a perceptron: the weighted rainbow
boxes technique and an application in antibiotherapy.
In International Conference Information Visualisation
(iV), pages 256–261, London, United Kingdom.
Lamy JB (2018). A new diagram for amino acids: User
study comparing rainbow boxes to Venn/Euler dia-
gram. In International Conference Information Visu-
alisation (iV), pages 361–366, Salerno, Italy.
Masoodian, M. and Koivunen, L. (2018). Temporal visual-
ization of sets and their relationships using Time-sets.
In International Conference Information Visualisation
(iV), pages 85–90.
Price, B. A., Baecker, R. M., and Small, I. S. (1993). A
principled taxonomy of software visualization.
Rebello, N. S. and Zollman, D. (1999). Conceptual under-
standing of quantum mechanics after using hands-on
and visualization instructional materials. In Annual
meeting national association for research in science
teaching, volume 2.
Rieffel, E. and Polak, W. (2014). Quantum computing :
A gentle introduction. The MIT Press, Cambridge,
Massachussetts, USA.
Rodgers P (2014). A survey of Euler diagrams. Journal of
Visual Languages and Computing, 25(3):134–155.
Steiger, D. S., H
¨
aner, T., and Troyer, M. (2018). Pro-
jectQ: An open source software framework for quan-
tum computing. Quantum, 2:49.
Dynamic Software Visualization of Quantum Algorithms with Rainbow Boxes
163
