
Antecedent and Consequence Total Quality Management
in Public Sector Performance
Sanusi Fauji, and Muchlish Munawar
Faculty of Economics and Business, Sultan Ageng Tirtayasa University, Indonesia
Abstract. The purpose of this study is to examine the Model of Organizational
Culture Application as an antecedent variabel of Total Quality Management and
the consequences variable on Public Organizational Performance. This study
uses population in the government in the City of Cilegon, Banten, with a sample
of echelon II, III and IV officials in the Regional Organization of the
Environment (OPD) Cilegon City, Banten. The sampling method in this study
used purposive sampling. This study uses a path analysis tool with the WarpPLS
version 5.0 program to test hypotheses. The results of this study found that there
is an influence between organizational culture and Total Quality Management,
so that it can improve the performance of public organizations in OPD in the
Government of the City of Cilegon.
Keywords: Antecedents Dan Consequences ꞏ Organizational Culture ꞏ Total
Quality Management ꞏ Public Organization Performance
1 Introduction
As part of public sector organizations, the performance of government agencies is now
becoming a concern. Communities began to question the quality they received from the
services carried out by government agencies. Even though the routine and development
budgets issued by the government are increasing, it seems that the community is not
satisfied with the quality of services provided (Putri, 2014). Whereas the government
apparatus is a person who is trusted and given the mandate by the state and citizens to
manage their government in order to improve the welfare of the people. Thus, its
effectiveness must be assessed based on the extent of the government's ability to
improve people's welfare
In a public organization environment, performance is a measure of achievement or
success in running an organization that is related to everything that the organization
does in a certain period of time. In fact, the problem that is often faced by many
organizations, namely employee performance which tends to decline over time which
affects the effectiveness of the organization (Tentama, 2015). Measurement of the
performance of public sector organizations needs to be done because it is useful as a
reference to improve organizational performance in order to be better in the future.
To increase competitive advantage, organizations must implement a quality culture
in every work activity and as an important and key factor in maintaining competitive
advantage. quality-oriented organization, the main focus is customer / community
942
Fauji, S. and Munawar, M.
Antecedent and Consequence Total Quality Management in Public Sector Performance.
DOI: 10.5220/0010609600002900
In Proceedings of the 20th Malaysia Indonesia International Conference on Economics, Management and Accounting (MIICEMA 2019), pages 942-951
ISBN: 978-989-758-582-1; ISSN: 2655-9064
Copyright
c
2022 by SCITEPRESS – Science and Technology Publications, Lda. All rights reserved

satisfaction. To meet the quality of products or services that can satisfy the customer /
community, one appropriate way is to implement Total Quality Management (TQM)
practices that are considered to help organizations to meet the desires of customers /
communities (Malahayati, 2010). Many authors argue that the successful
implementation of TQM is dependent on the prevailing organizational culture, and the
need to change the organizational culture and workforce attitudes so that the
implementation of TQM is effective. Although the important role of organizational
culture has received wide recognition in ensuring the successful implementation of
TQM, there are differences in the empirical literature that examines the relationship
between organizational culture and the application of TQM practices. Although several
previous studies have examined the relationship between TQM practices and
organizational performance in developed countries in the west, including the Kaynak
study (2003) conducted in the United States and the Baird et al. (2011) in Australia.
However, because the cultural diversity in each country is different, this is one factor
that is believed to be able to inhibit the practice of TQM. Research and studies on the
application of TQM practices, especially when related to organizational culture factors
in Indonesia are still limited, given the cultural characteristics in Indonesia that are
different from the culture in which TQM was originally applied. Therefore, researchers
are interested in examining the relationship between organizational culture and the
application of TQM practices in improving the performance of public organizations in
the Regional Government Organization (OPD) of Cilegon City Government.
2 Theoritical Framework and Hypothesis Development
2.1 Influence between Organizational Culture and TQM
The first objective of this study is to examine the relationship between organizational
culture and TQM. Analysis of the relationship between organizational culture and TQM
is problematic with the debate over whether there is a difference between organizational
culture and TQM. Although the organizational culture and TQM are closely related, the
two things are actually different. Schein (1985) and Powell (1995) both support the
distinction between culture and TQM, which states that practices such as TQM may
reflect culture in an organization, but organizational culture itself is more embedded in
organizations that reflect stable patterns and beliefs and values - values developed in a
company (or business unit) over time. Given the inherent nature of culture, and the fact
that the culture of an organization reflects a combination of the characteristics of
various organizations and adopted practices, it is unlikely that the implementation of
one specific management practice such as TQM will have a large impact on the culture
of an organization (Hofstede et al., 1990). Instead, it is stated that the prevailing
organizational culture can support TQM by providing an environment conducive to the
successful implementation of TQM (Powell, 1995). The following hypothesis:
H1a. There is a significant positive influence between the dimensions of
organizational culture dengan
Antecedent and Consequence Total Quality Management in Public Sector Performance
943

TQM requires companies that are constantly looking for ways to improve work
processes so as to improve their ability to produce high-quality products / services.
Companies that have innovation will be more willing to experiment with new practices
such as TQM practices. They will continue to evaluate customer needs and market
expectations in order to develop new products and services and improve the current
production process (Juran, 1988; Baird et al. 2011). Therefore, companies that are more
innovating are more likely to adopt and make extensive use of TQM practices. The
research hypothesis is as follows:
H1b. There is a significant positive influence between the dimensions of
organizational culture with innovation instruments with a level of use of TQM
practices.
2.2 Effects between TQM and Performance
Several research results conclude that TQM as one of the best practice approaches to
improve company performance (Callystha and Devie, 2013; Munizu, 2013; Idris,
2011). In the opinion of Prayhoego and Devie (2013) that a good application of TQM
will be able to improve company performance, that the concept of TQM generally
describes a system that is collective (whole), where the system is related to the
implementation of quality management in order to achieve good organizational
performance. Furthermore according to Nasution (2004) states that TQM influences
organizational performance consisting of product design processes, process flow
management, statistical quality control, long-term relationships with customers,
employee attitudes and company performance on competitive advantage. The
implementation of TQM that can affect company performance is by applying the
elements of TQM as stated by Goetsch and Davis (Tjiptono and Diana, 2001), namely
customer focus, obsession with quality, scientific approach, long-term commitment,
teamwork, improvement system on an ongoing basis, improvement and training,
controlled freedom, unity of purpose, and the involvement in employee empowerment.
The research hypothesis is as follows:
H2. There is a significant positive effect between TQM and Organizational
Performance.
H2
Fig. 1. Theoretical Model.
Team Work
TQM
Innovation
H1a
H1b
Public Org
Performance
MIICEMA 2019 - Malaysia Indonesia International Conference on Economics Management and Accounting
944

3 Methodology
This type of research is explanatory research. The quantitative method in this study was
used to empirically examine antecedent and consequence Total Quality Management
(TQM).
This study uses population in the government in the City of Cilegon, Banten, with a
sample of echelon II, III and IV officials in the Regional Organization of the Environment (OPD)
Cilegon City, Banten
. Criteria for selection of the sample in the study is aimed at the
sample (purposive sampling). To test the models and hypotheses used analysis of
Structural Equation Modeling (SEM).
This study uses a path analysis tool with the WarpPLS
version 5.0 program to test hypotheses..
In this study data analysis using the Partial Least Square (PLS) approach using
WarpPLS software. PLS is a structural equation model (SEM) based on components
or variances. According to Ghozali (2016) PLS is an alternative approach that shifts
from a covariance-based SEM approach to variant-based. Covariance-based SEM
generally tests causality / theory while PLS is more predictive model. PLS is a
powerful analysis method (Wold, 1985; Ghozali, 2016) because it is not based on
many assumptions. For example, the data must be normally distributed, the sample
does not have to be large. Besides being able to be used to confirm theories, PLS can
also be used to explain the presence or absence of relationships between latent
variables. PLS can simultaneously analyze constructs formed with reflexive and
formative indicators. This cannot be done by SEM which is based on covariance
because it will become an unidentified model.
4 Result and Discussion
4.1 Outer and Inner Model Testing
In testing the reliability value of a construct the value used for Cronbach's Alpha and
Composite Reliability is where both values are greater than 0.7 (> 0.7) for confirmatory
research and greater than 0.6 (> 0.6) for exploratory research is still acceptable. (Hair
et al., 2010, 2011; Pirouz 2006,; Ghozali 2016). Furthermore, the average variances
extracted (AVE) value of the construct must be above 0.5 (> 0.5). (Bagozzi and
Baumgartner, 1994; Ghozali, 2016).
Based on the approach in the reliability test above, the following are presented the
values of Cronbach's Alpha, Composite Reliability, Average variances extracted from
each construct of this study with confirmatory factor analysis with WarpPLS 5.0.
Table 1. Score of Composite reliabiLity Coeffecients, Cronbach Alpha Coefficients Dan
Average Variances Extracted.
ITC CE PERF
Composite reliability coefficients
0.905 0.921 0.880
Cronbach alpha Coefficients
0.873 0.905 0.834
Average Extracted
0.615 0.519 0.555
Antecedent and Consequence Total Quality Management in Public Sector Performance
945
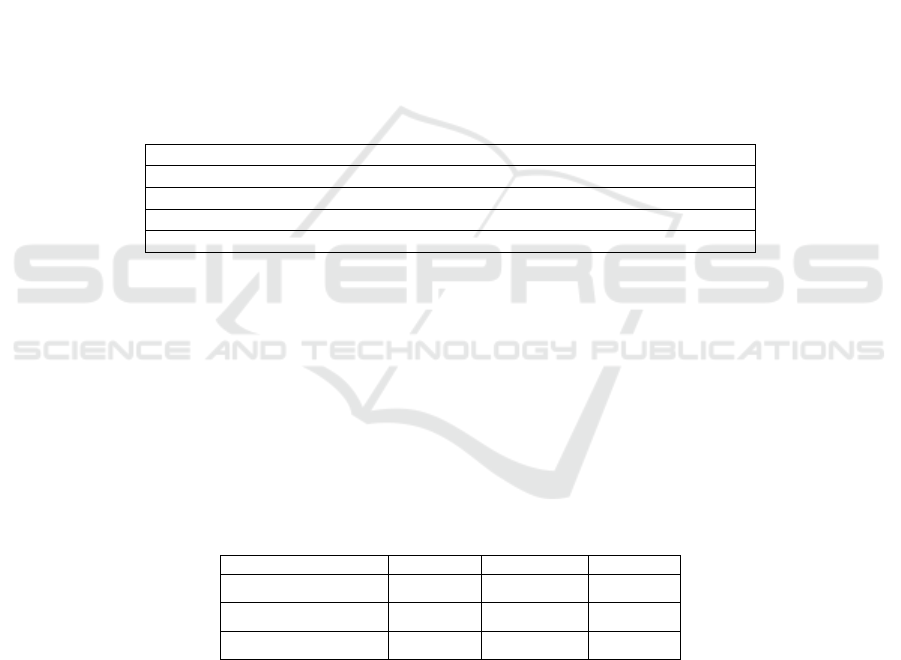
Table 1 shows that the composite reliability value of the construct studied was above
the recommended threshold, where the composite reliability value was greater than 0.6
(> 0.6), namely: ITC of 0.905, CE of 0.921, and PERF of 0.880. Cronbach alpha
coefficients value of each construct is above the recommended threshold, where the
Cronbach alpha coefficients value is greater than 0.6 (> 0.6), namely: ITC of 0.873, CE
of 0.905, and PERF of 0.834.
Average variances extracted (AVE) value of each construct is above the
recommended threshold, where the AVE value is greater than 0.5 (> 0.5), namely: ITC
of 0.615, CE of 0.519, and PERF of 0.555. Based on the value of composite reliability,
cronbach alpha coefficient and Average variances extracted from the ITC, CE, and
PERF constructs that are above the recommended threshold, then all constructs have
met the composite reliability requirements
4.2 Full Model Testing
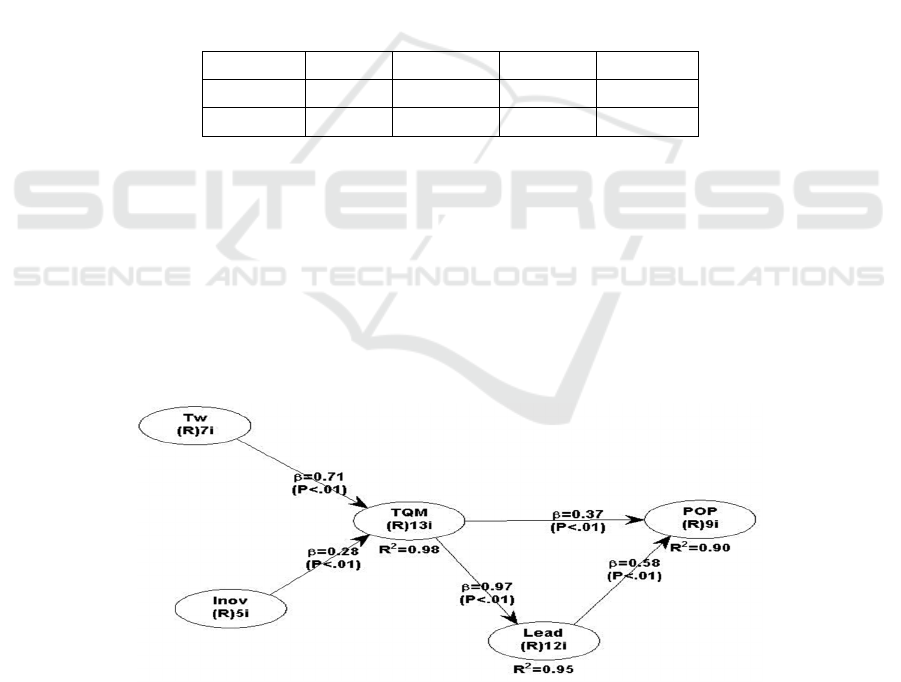
The results of testing the full research model with WarpPLS 5.0 are presented in Figure
2, table 2 and Table 3.
Table 2. Model Fit dan Quality Indice Full Model.
A
verage Path Coefficient (APC)= 0.833, P<0.001
A
vera
g
e R-S
q
uared
(
ARS
)
= 0.698, P<0.001
A
vera
g
e ad
j
usted
R
-S
q
uared
(
AARS
)
= 0.696, P<0.001
A
vera
g
e
f
ull collineartit
y
VIF
(
AAVIF
)
= 4.895, acce
p
table if <= 5, ideall
y
<= 3.3
Tenenhaus GoF (GoF) = 0.623, small >= 0.1, medium >= 0.25, large >= 0.3
6
Based on the Model Fit and Quality Indice Full Model output presented in Table 2, it
is known that the Average path coefficient (APC) has an index of 0.833 with a p-value
<0.001, Average R-squared (ARS) has an index of 0.698 with a p-value < 0.001 and
Average adjusted R-squared (AARS) have an index of 0.696. The p-value for APC,
ARS and AARS that is recommended as a fit model is 5 0.05 (Ghozali and Latan, 2017;
Kock, 2012). Thus it can be concluded that this study is fit. This is also supported by
the value of Average full collinearity VIF (AAVIF) = 4,895, less than the value of 5
(acceptable). Thus indicating that there is no multicollinearity problem between
indicators and between exogenous variables. The predictive power of the model
described by GoF is 0.713, including the large category because it is greater than 0.36.
Table 3. R-Squared, Adj R-Square dan Full Collin VIF.
ITC CE PERF
R-squared
0.562
Adjusted R-squared
0.802
0.559
Full Collin VIF 4.973 4.962 3.360
Table 3 presents the structural model analysis outputs about R-squared (R2),
Adjusted R-squared (Adj. R2), Full Collinearity VIF and Q-Squared (Q2). R2 shows
the percentage of endogenous construct variance / criterion can be explained by the
construct hypothesized to influence it (exogenous / predictor) (Sholihin and Ratmono,
2014). Adj. R2 is similar to R2 but is used to avoid estimation bias in R2, because the
MIICEMA 2019 - Malaysia Indonesia International Conference on Economics Management and Accounting
946
more predictor variables in the model, R2 will be greater and continue to increase
(Ghozali and Latan, 2016). Criteria for R2 and Adj. R2 ≤0.70, ≤0.45 and ≤0.25 show
strong, moderate and weak models.
Based on table 3 it can be seen that R-squared (R2) and Adjusted R-squared (Adj.
R2) of this research model tend to be moderate because the barada is above 0.25%. Full
ollinearity VIF is used to check whether collinearity problems occur vertically or
laterally (Ghozali and Latan, 2017). The criterion for a model that is free from vertical
and lateral multicollinearity problems is that the Full Collinearity VIF value must be
lower than 3.3. However, values ≤5 are still acceptable (Ghozali and Latan, 2017;
Sholihin and Ratmono, 2014; Kock, 2012). ased on table 3 it can be seen that the model
used in this study is free from the problem of vertical or lateral colonierity. Because all
VIF Full Collinearity values are less than 5. After the tructural model has been declared
fit and can be accepted by data quality testing, then an analysis and interpretation of the
structural model will be used to test the research hypothesis. Bootstrapping method for
research models with SEM Analysis with WarpPLS 5.0 of each construct with the
following results: R-squared (R2), Adjusted R-squared (Adj. R2), and Full Collinearity
VIF.
Table 4. Path Coefficient, P-value dan Effect Size Full Model.
Relationship Estimate Effect Size P-Value Decision
ITC CE 0.897 0.804 (<0.001)* H1: Accepted
ITCPERF 0.750 0.562 (<0.001)* H2: Accepted
Variation of certain exogenous variables to endogenous variables is called effect
size. Effect size measures the contribution of variants from each predictor in the R-
Square coefficient model of a particular endogenous variable. Effect sizes can be
grouped into three categories, namely weak (0.02), medium (0.15) and large (0.35)
(Sholihin and Ratmono, 2014).
Based on table 4 it can be seen that the variable Information Technology Capability
(ITC) has the biggest effect size on the Cost Effectiveness (CE) variable, which is
0.804. The effect size of the effect of ITC on the PERF variable of 0.562 is also quite
large. Thus it can be concluded that Information Technology Capability (ITC) has a
greater role from the perspective of Cost effectiveness (EC) compared to PERF.
Fig. 2. Output WarpPLS 5.0 Full Model.
Antecedent and Consequence Total Quality Management in Public Sector Performance
947

4.3 Hypothesis Testing
Hypothesis 1 states that Information Technology Capability (ITC) has a significant
positive effect on Cost effectiveness (CE). To prove this hypothesis, a direct effect test
was conducted with WarpPLS version 5.0. Tests performed are model fit testing, path
coefficient analysis and p-value. The test results are presented in Figure 2; Table 2;
Table 3 and Table 4. Based on table 2 it is known that the model fit criteria have been
met, where the APC, ARS, AARS values are below 0.05, the AFVIF value <5 and the
GoF value are included in the large category that is above 0.36. Table 4 presents the
path coefficients produced are 0.897 and significant with p values <0.001 (α1%). Thus
it can be concluded that hypothesis 1 is accepted. This means that Information
Technology Capability (ITC) has a significant positive effect on Cost Effectiveness
(CE) with a coefficient of determination of 0.804 shown in table 3.
Hypothesis 2 states that Information Technology Capability (ITC) has a significant
positive effect on Business Performance (PERF). To prove this hypothesis, a direct
effect test was conducted with WarpPLS version 5.0. Tests performed are model fit
testing, path coefficient analysis and p-value. The test results are presented in Figure 2;
Table 2; Table 3 and Table 4.
Based on table 2, it is known that the criteria for model fit have been fulfilled, where
the APC, ARS, AARS values are below 0.05, AFVIF values <5 and GoF values are
included in the large category above 0.36. Table 4 presents the path coefficients
produced are 0.750 and significant with p values <0.001 (α1%). Thus it can be
concluded that hypothesis 2 is accepted. This means that Information Technology
Capability (ITC) has a significant positive effect on SME’s Performance (PERF) with
a coefficient of determination of 0.562 shown in table 3.
4.4 Discussion
This section will discuss research findings that have been analyzed and tested in the
previous section. The discussion is based on the value of the results of statistical testing
with WarpPLS 5.0 software which is based on the building of theory and empirical
research referred to and developed in this study. The discussion will be conducted based
on the results of data analysis and hypothesis testing proposed in this study and the
relationship with the findings from previous studies
4.4.1 Information Technology Capability (ITC) Has a Significant Positive Effect
on Cost Effectiveness (CE)
Hypothesis 1 of this study states that Information Technology Capability (ITC) has a
positive effect on Cost Effectiveness (CE). The test results using WarpPLS 5.0 show a
path coefficient of 0.897 and p-value <0.01. Based on these figures it is concluded that
hypothesis 1 can be accepted, meaning that Information Technology Capability (ITC)
has a positive effect on Cost Effectiveness (CE).
Chriswan and Mahmudin (2008) stated that information technology offers many
opportunities to reduce costs, increase efficiency, increase effectiveness and revenues
and can improve cost control. Sophisticated technology and information can help
MIICEMA 2019 - Malaysia Indonesia International Conference on Economics Management and Accounting
948

companies to monitor the activities carried out by their employees, so the company can
obtain information more quickly and accurately used in decision making. If a mistake
or deviation occurs, the company can immediately take corrective actions so that the
effectiveness in the use of operational costs can be identified quickly so that the
company's goals can be achieved. Previous research supporting this research was a
study conducted by Salim Ridwan (2014) and Ilker Calayoglu & Murat Azaltun (2013)
which suggested that information technology significantly influences the effectiveness
of cost control in an organization.
Cost control must primarily be aligned with the goals to be achieved by the
company, one of the goals to be achieved by the company is to obtain maximum profit
by issuing the lowest costs, therefore by controlling the production costs the company
hopes to get a large profit. A company in order to compete in a market environment,
the company is also required to be able to create a good product innovation, and the
price is lower or at least the same as the price offered by its competitors.
4.5.2 Information Technology Capability (ITC) has a significant positive effect on
SME’s Performance (PERF)
Hypothesis 2 of this study states that Information Technology Capability (KTI) has
a positive effect on Business Performance (KIN). The test results using WarpPLS 5.0
show the path coefficient of 0.750 and p-value <0.01. Based on these figures it is
concluded that hypothesis 3 can be accepted, meaning that Information Technology
Capability (KTI) has a positive effect on Business Performance (KIN).
This hypothesis is supported by previous researchers finding a significant
relationship between information technology and performance. Kelley (1994), Siegel
and Griliches (1992) state that some of the results of the study found a positive effect
of information technology on company performance at the industry level. Diewert and
Smith (1994), Hitt and Brynjoltsson (1995), Board and Min (1997), Devaraj and Kohli
(2003) indicate that there is a positive relationship between technology and company
performance.
However, this research is not supported by Devaraj and Kohli (2003) stating that
there are some studies that do not find a significant relationship between information
technology and performance. Baily (1986), Roach (1987), Morrison and Berndt (1991),
Devaraj and Kohli (2003) find a negative relationship between information technology
relatedness variables that are associated with firm performance. In addition, Berndt and
Morrison (1995) and Kohli (1999) find that there is no significant relationship between
investing in information technology and performance.
The above findings are not consistent with previous studies conducted by Kelley
(1994), Siegel and Griliches (1992), Diewert and Smith (1994), Hitt and Brynjoltsson
(1995), Council and Min (1997); Devaraj and Kohli (2003). Research conducted by
Nengah, (2005) also found that information technology contributes a positive and
insignificant value to business process performance and competitive dynamics.
References
Ahire, S.L. and Dreyfus, P. (2000). “The impact of design management and process management
on quality: an empirical investigation”. Journal of Operations Management, Vol.18, pp. 549-
75.
Antecedent and Consequence Total Quality Management in Public Sector Performance
949

Baird, K.M., Harrison, G.J. and Reeve, R.C. (2007). “The culture of Australian organizations and
its relation with strategy”. International Journal of Business Studies, Vol. 15 No. 1, pp. 15-41.
Baird, K.M., Jia Hu, K. and Reeve, R.C. (2011). “The relationships between organizational
culture, total quality management practices and operational performance”. International
Journal of Operations & Production Management, Vol. 31 No. 7, pp. 789-814.
Balakrishnan, R., Linsmeier, T.J. and Venkatachalam, M. (1996). “Financial benefits from JIT
adoption: effects of customer concentration and cost structure”. The Accounting Review,
Vol. 71 No. 2, pp. 183-205.
Ciptani, Monika Kussetya. (1999). Pengukuran Biaya Kualitas : Suatu Paradigma Alternatif.
Jurnal Akuntansi dan Keuangan Vol. 1, No. 1: 68 -83.
Forza, C. and Filippini, R. (1998). “TQM impact on quality conformance and customer satisfaction:
a causal model”. International Journal of Production Economics, Vol. 55 No. 1, pp. 1-20.
Gotzamani, K.D. and Tsiotras, G.D. (2001). “An empirical study of the ISO9000 standards’
contribution towards total quality management”. International Journal of Operations &
Production Management, Vol. 21 No. 10, pp. 1326-42.
Gozhali, I. (2008). Model Persamaan Struktural Konsep dan Aplikasi Dengan Program AMOS
16.0. Semarang. Badan Penerbit Universitas Diponegoro.
Hofstede, G., Neuijen, B., Ohayv, D.D. and Sanders, G. (1990). “Measuring organizational
cultures: a qualitative and quantitative study across twenty cases”. Administrative Science
Quarterly, June, pp. 286-316.
Kaluarachchi, K.A.S.P. (2010). “Organizational culture and total quality management practices:
a Sri Lankan case”. The TQM Journal, Vol. 22 No. 1, pp. 41-55.
Kaynak, H. (2003). “The relationship between total quality management practices and their
effects on firm performance”. Journal of Operations Management, Vol. 21, pp. 405-35.
Kiella, M.L. and Golhar, D.Y. (1997). “Total quality management in an R&D environment”.
International Journal of Operations & Production Management, Vol. 17 No. 2, pp. 184-98.
Kuo, Tsuang and Gwo Yang Tsai (2017). “The effects of employee perceived organisational
culture on performance: the moderating effects of management maturity”. Department of
Business Management, National Sun Yat-sen University, Kaohsiung City, Taiwan. Volume
30, 2019 - Issue 3-4
Malahayati, Anastasia. (2010). “Implementasi Adopsi Total Quality Management (TQM)
Terhadap Budaya Kualitas (Studi pada PT. Aryan Indonesia/Kidzania Jakarta)”. Tesis S2
Universitas Pembangunan Nasional “Veteran”. Jakarta.
Mahfouz, S.S.A. (2019). “TQM practices and organizational performance in the manufacturing
sector in Jordan: The mediating role of HRM practices and innovation”. Journal of
Management and Operational Research, 1(22).
Mardiyah, Aida Ainul dan Listianingsih. (2005). “Pengaruh Sistem Pengukuran Kinerja, Sistem
Reward, dan Profit Center Terhadap Hubungan Antara Total Quality Management dengan
Kinerja Manajerial”. Makalah disampaikan pada SNA VIII Solo, 15 – 16 September 2005.
Mohamud, G. Y., Muhamud, A. S., & Mohamed, B. H. (2015). “The relationship between
strategic management and organizational performance in Mogadishu-Somalia”. European
Journal of Research and Reflection in Management Sciences, 3(2), 42-51.
O’Reilly, C.A., Chatman, J. and Caldwell, D.F. (1991). “People and organizational culture: a
profile comparison approach to assessing person-organizational fit”. Academy of
Management Journal, Vol. 34 No. 3, pp. 487-516.
Oruma, B. W., Mironga, J. M., & Muma, B. O. (2014).”Top management commitment towards
implementation of Total Quality Management (TQM) in construction companies in Nakuru
county Kenya”. International Journal of Economics, Finance and Management Sciences,
2(6), 332-338.
Powell, T.C. (1995). “Total quality management as competitive advantage: a review and
empirical study”. Strategic Management Journal, Vol. 16, pp. 15-37.
MIICEMA 2019 - Malaysia Indonesia International Conference on Economics Management and Accounting
950

Prajogo, D.I. and McDermott, C.M. (2005). “The relationship between total quality management
practices and organizational culture”. International Journal of Operations & Production
Management, Vol. 25 No. 11, pp. 1101-22.
Rad, M.M.A. (2006). “The impact of organizational culture on the successful implementation of
total quality management”. The TQM Magazine, Vol. 18 No. 6, pp. 606-625.
Rahman, N., Othman, M., Yajid, M., Rahman, S., Yaakob, A., Masri, R., Ramli, S & Ibrahim, Z.
(2018). “Impact of strategic leadership on organizational performance, strategic orientation
and operational strategy”. Management Science Letters, 8(12), 1387-1398.
Samson, D. and Terziovski, M. (1999). “The relationship between total quality management
practices and operational performance”. Journal of Operations Management, Vol. 17 No. 4,
pp. 393-409.
Santoso, Singgih. (2011). Structural Equation Modeling (Konsep dan Aplikasi dengan AMOS
18). Jakarta. Penerbit PT Elex Media Komputindo.
Wicaksono, Setiawan. (2006). “Pengaruh Implementasi Total Quality Management (TQM)
Terhadap Budaya Kualitas (Studi pada PT. Hari Terang Industry – Surabaya)”. Tesis S2
Universitas Brawijaya. Malang.
Antecedent and Consequence Total Quality Management in Public Sector Performance
951
