
Determinants of the Net Enrollment Rate of
Indonesia's: Poor Population
Wawan Hermawan
1
, Fitrawaty
2
, Indra Maipita
2
,
and Haikal Rahman
3
1
Department of Economics, Padjadjaran University, Indonesia
2
Faculty of Economics, State University of Medan, Indonesia
3
Faculty of Civil Engineering, State University of Medan, Indonesia
haikalrahman@unimed.ac.id
Abstract. One of the success of education indicators can be identified by the
growth of the Net Enrollment Rate (NER). The positive economic growth and
the reduction in poverty levels raise questions toward the factors that affect the
NER at elementary, junior and senior high school levels for the poor population
in Indonesia. Data panel models for 29 provinces with a time span of 2011-2015
are used as the basic data for these studies. The estimated result of the model
shows that the very elastic coefficient of income per capita affects the NER for
every education level in Indonesia. Government expenditure on education still
has the effect towards the NER escalation for elementary, junior and senior high
school education. Inequality in Indonesia escalates to the NER at the elementary
and senior high school levels, whereas at the junior high level it reduces the NER.
The age factor affects the junior high and senior high school whereas for the
elementary level it has no effect.
Keywords: Net Enrollment Rate ꞏ Income per Capita ꞏ Government Expenditure
ꞏ Inequality
1 Introduction
The development of education in Indonesia can be illustrated by the participation rate
of Indonesian people at various school levels. The higher the participation rate for all
education levels, the quality of Indonesian human resources is expected to be better.
The indicators of this participation rate are the Gross Enrollment Rate (GER) and the
Net Enrollment Rate (NER). The difference between these two indicators is at the
emphasis on school-age accuracy, where NER emphasizes the exactness of school age
at every level of education whereas not on GER. The impact of this disparity is that
GER is usually larger than NER, where many students who take part in one of the levels
of education are not in the appropriate age range.
Figure 1 shows the NER level in the Early Childhood Education Program (PAUD),
Elementary School (SD), Junior High School (SMP) and Senior High School (SM).
The NER of SD level is always higher than all the other levels, this is normal because
elementary school is compulsory education. Unlike the PAUD which is not
compulsory, but shows a considerable level of escalation during the year 2012-2017,
which shows the larger community's awareness for PAUD. Junior high during the
746
Hermawan, W., Fitrawaty, ., Maipita, I. and Rahman, H.
Determinants of the Net Enrollment Rate of Indonesia’s: Poor Population.
DOI: 10.5220/0010528700002900
In Proceedings of the 20th Malaysia Indonesia International Conference on Economics, Management and Accounting (MIICEMA 2019), pages 746-757
ISBN: 978-989-758-582-1; ISSN: 2655-9064
Copyright
c
2022 by SCITEPRESS – Science and Technology Publications, Lda. All rights reserved
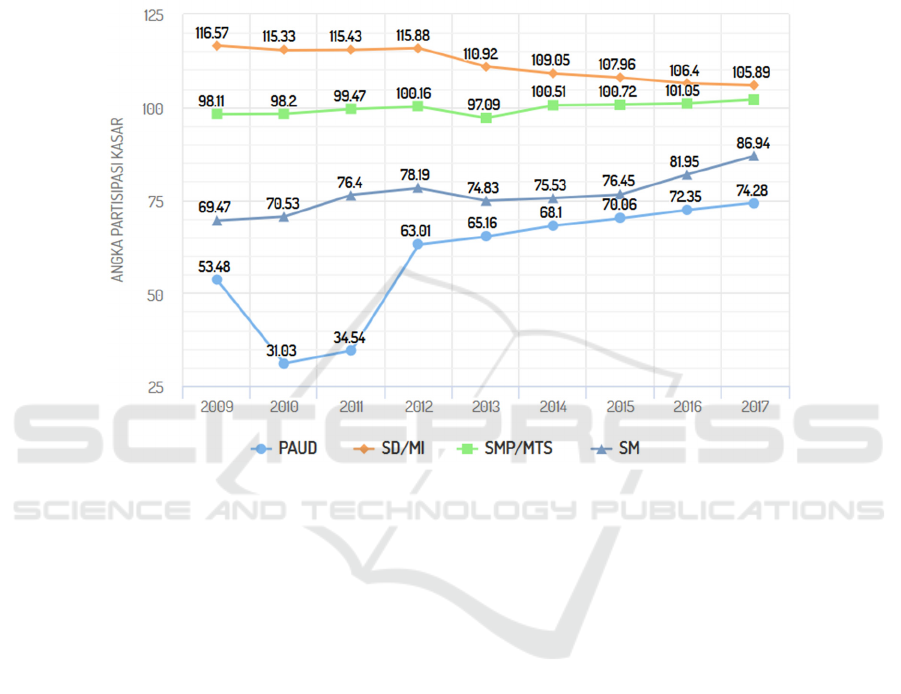
period of 2009-2017 showed a fairly low increase, this gave a prediction on the
awareness of achieving junior high level education, and in accordance with compulsory
with 9 year study program proclaimed by the Government.
NER education at the SM level shows a constantly rising rate with a considerable
increase in meaning. The trend of the SM-NER escalation leads to the NER level for
junior high school and SD level, so the APK for all levels are expected to reach 100%.
Fig. 1. Gross Enrollment Rate Growth for PAUD, SD/MI, SMP/MTS and SM at Indonesia in
2009-2017. Source: Ministry of Education and Culture (http://apkapm.data.kemdikbud.go.id).
Figure 2 provides an overview of the participation of school children at each level with
an emphasis on the accuracy of school age at each level, where this figure is indicated
by the NER. Compared to GER, the NER will not exceed 100%. This is because each
NER number will not have students who study at one level of education outside the age
of education. In Figure 2, PAUD is not displayed because it is related to data
availability. Elementary school NER is around 93-96%, where the level of participation
at the elementary school level is quite good, although there was a decrease in 2013. The
junior high school level showed an increase up to 2015, but it fell quite far in 2016. Up
to the middle school shows the success rate of the nine-year compulsory education
program launched by the government.
The NER of the SM level shows a significant increase since 2013, although it is still
at the level of 63.7% in 2017 but shows a fairly upward trend, so that expectations in
the following years can continue to increase. NER SM which continues to increase can
be expected as a milestone for improving the quality of human resources, at the level
of work entry at adulthood (> 16 years).
Determinants of the Net Enrollment Rate of Indonesia’s: Poor Population
747
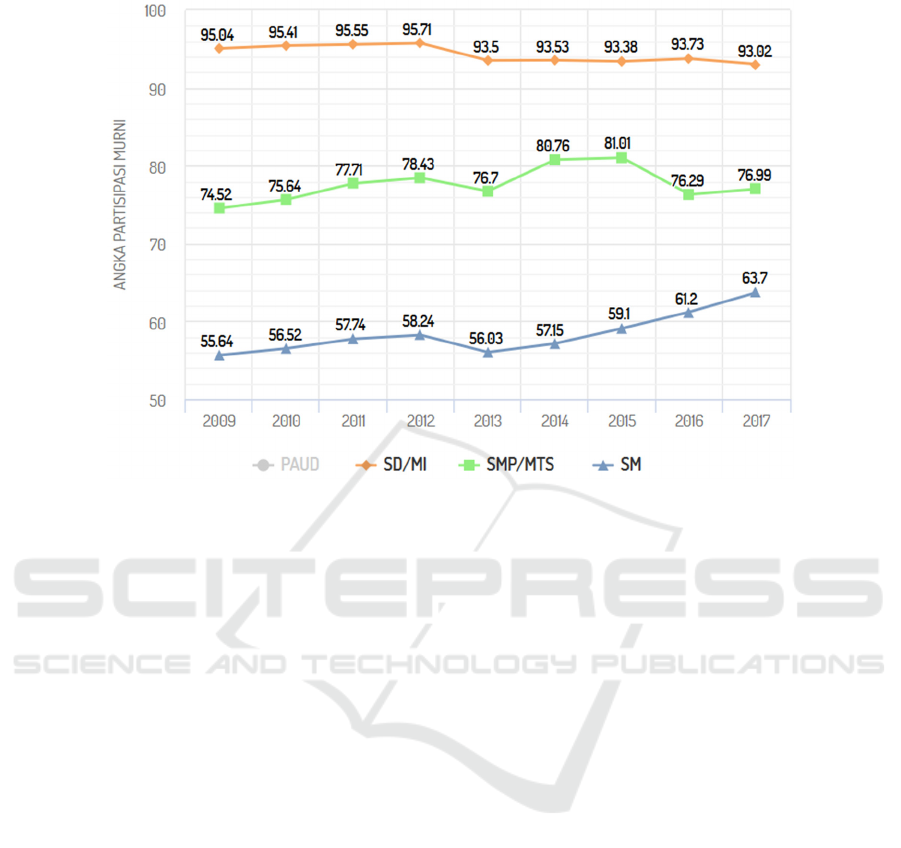
Fig. 2. Net Enrollment Rate Growth for PAUD, SD/MI, SMP/MTS and SM in 2009-2017.
Source: Ministry of Education and Culture (http://apkapm.data.kemdikbud.go.id).
The escalation of GER and NER in Indonesia is inseparable from the influence of ease
of public access towards education at all levels. One of the most important issues is the
community purchasing power. This purchasing power is seen from the economic
development in Indonesia which always shows the positive level of economic growth.
Indonesia's economic growth in 2007-2016 tended to slow down, although it was still
positive. In 2007, economic growth reached 5.3% and 5% in 2016.
The economic growth has succeeded in suppressing poverty levels in Indonesia.
The percentage of poor people in Indonesia continued to decline throughout 2007-2016.
This indicator shows the success in the process of economic development in Indonesia.
The decrease in poverty levels was not matched by the inequality indicators. The GINI
index represent a fairly high development in Indonesia. From 2011, the inequality
worsened until 2013, although there was a relatively low decline from 2014 to 2016.
Figure 3 elucidate the graphic development of economic growth, poverty and
inequality in Indonesia within 2007-2016. The phenomenon that appears in the figure
is the high inequality in Indonesia with a poverty rate that is still above 10%, where the
poverty line per capita per month in 2016 is IDR 364,527 for urban areas and IDR
343,647 for rural areas. This means that there will be poorer people hence the level of
living needs is higher than the poverty line.
MIICEMA 2019 - Malaysia Indonesia International Conference on Economics Management and Accounting
748
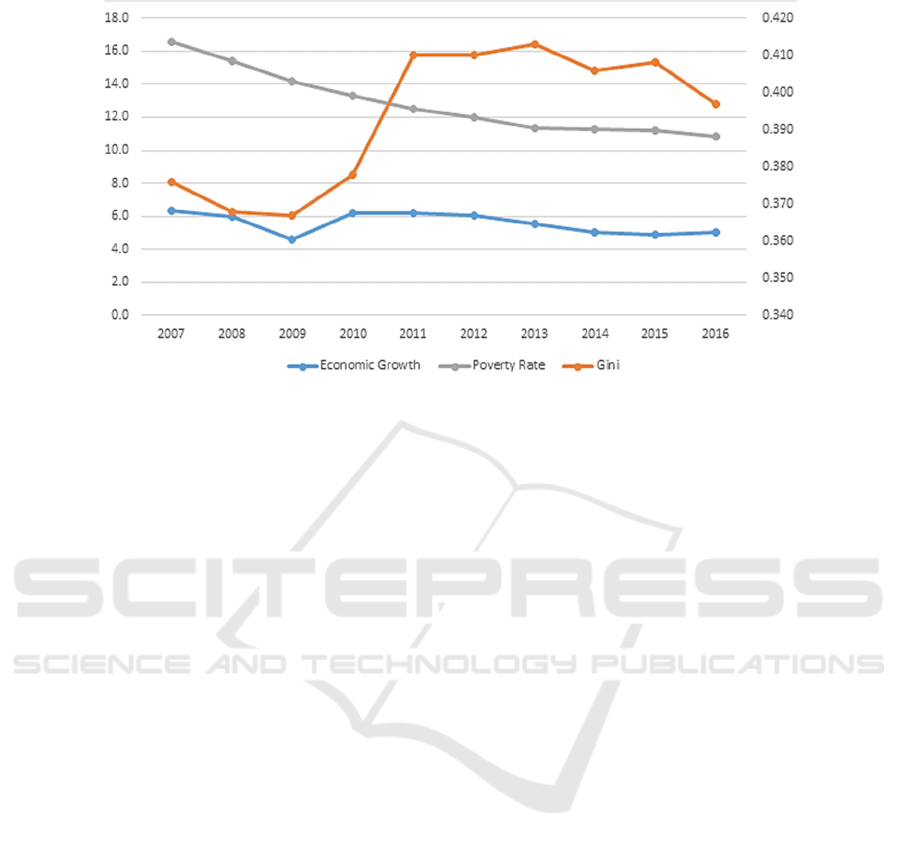
Fig. 3. Economic Growth, Poverty Rate and Inequality in Indonesia from 2007-2016. Source:
Statistics Indonesia, processed.
Indonesia's economic development is quite successful, it can be seen from its economic
growth that demands an increase in the quality of its human resources. One focus of
economic development is to shape humans as resources and place humans as subjects
rather as an objects (Human Centered Development). Education is fundamental to form
broader human capabilities that are at the core of the development purpose. The
fundamental purpose of development is human education and health (Todaro and
Smith, 2012). Education has an important role in development, because education is an
investment to increase human resources, strengthen physical capital, and the ability to
adjust the applied techniques towards industrial machines (World Bank, 1996).
The role of the government cannot be separated from itself to ensure that its citizens
receive and use the availability of education in Indonesia. The government, the
ministries of education and the education authorities offices at the provincial and
district/city levels are seeking to improve education access for all residents. Poor people
with limited access to education can be facilitated to education with free education
programs for all communities and free education specifically for the poor.
Economic growth is quite high and the development of the number of poor people
continues to decline whereas the increase of inequality raises questions about access
to education for the poor and how the NER for each level of education for the poor can
be explained by several economic variables and government expenditure on education
in Indonesia.
2 Literature Review
The potential economic growth for a country's is strongly influenced by its resources,
both human capital, physical capital, and endowment resources. Harbison (1973) states
that human resources are the basic capital of the wealth of a nation. physical capital and
natural resources are merely factors of production which are basically passive whereas
Determinants of the Net Enrollment Rate of Indonesia’s: Poor Population
749

human beings are active. It is humankind who is an active agent that will gather capital,
exploit natural resources, build various social, economic and political organizations,
and carry out the national development. If a country does not immediately develop the
expertise and knowledge of its people and does not effectively utilize their potential in
the development and management of the national economy, then in the future the
country will not be able to develop anything.
Schultz (1961) argues that in a society, its members can be invested through
spending on education, training, research and health to increase its production capacity.
Human capital contributes greatly to increase the income. Human capital is an engine
for economic growth (Azid and Khan, 2010). The quality of human capital depends on
its education. The higher the level of education, the quality or productivity of humans
is also expected to be higher. Educational and health outcomes as a form of
measurement of the quality of human capital cannot be achieved at the same level for
all communities. Higher education and a healthy life requires a lot of high costs, so that
not all people can get maximum education and health facilities. Educational
achievements in society are influenced by various variables that have been widely
studied and published in various journals.
Variables that influence education are widely expressed by various studies. Variable
income per capita, population growth rate, level of government expenditure in the
education sector, total population and total urbanization are the variables that have a
significant influence on the level of adult education in developing countries (Mazumdar
2005). On the other hand, Faguet and Sánchez (2008) provide more diverse variables
to see the effect on education. These variables are per capita expenditure for public
education costs, government spending on the education sector, growth in local
government spending, teacher to student ratio, politics, household demographics and
socioeconomic status.
Poverty has had a wide impact on human existence, not only the private lives of
those who are poor, but also for people who are not classified as poor. Poverty is not
only a personal burden, but also a burden and responsibility of the community, state
and the world to overcome it (Maipita, 2014). One method that is believed to be very
effective in reducing poverty is through education. Empirical evidence shows that
increasing access of the poor towards education, health, and reducing inequality of
access is important in poverty alleviation. Poverty can be caused by: (a) low quality
labor force due to low levels of education, (b) difficult and limited access to capital
ownership, (c) low levels of technological mastery, (d) inefficient use of resources, and
(e) high population growth (Sharp et al., 2000). The results of various studies find that
economic growth will increase income per capita and ultimately lead to a decrease in
poverty (Dollar and Kraay, 2001; Field, 1989).
3 Studied Models
The model is built based on the main literature referenced from Rajkumar and Swaroop
(2008) and several other supporting articles such as Anyanwu and Erhijakpor (2007);
Checchi (1999); Flug et al. (1998); Pritchett and Filmer (1999); and Psacharopoulos
(1994). The model development will refer to education indicators in the form of Pure
Participation Rates. The categories used for NER are elementary, junior high and senior
MIICEMA 2019 - Malaysia Indonesia International Conference on Economics Management and Accounting
750

high school participation rates whereas the independent variables chosen for the results
of the literature study are Income per capita, Government Expenditures for Educational
Affairs, Gini Coefficient, Population within the Age of Elementary School 7-12 years,
Population within the Middle School Age 3-15 years and Population within the Hig
School Age 16-18 years.
The data used is Susenas data from 2011 to Susenas from 2015. Macroeconomic
and fiscal data were obtained from the Central Statistics Agency and the Directorate
General of Fiscal Balance of the Ministry of Finance of the Republic of Indonesia. Unit
analysis is carried out at the provincial level for each data year. The econometric model
used refers to the panel data model with time series data from 2011 to 2015 and cross
section data for 29 provinces in Indonesia based on data availability.
To test the significance of the relationship between the independent variable and the
dependent variable, the econometric regression model hypothesis is used for testing the
parameters in the population regression function. Testing this hypothesis includes the
significant parameters testing as solely or as a whole of the population regression
function. To test the hypothesis of a single population parameter the t test was used and
for the significance of the regression as a whole the F test was used (Wooldridge, 2009).
Multicollinearity is tested with the Variance Inflation Factor (VIF) whereas for
heteroscedasticity the white heteroscedasticity test is used.
4 Results and Discussion
Estimated results of the model are run by using the Fixed Effect Model with Estimated
generalized least square (EGLS) or by running panel data regression with cross-section
weights. This method is done to correct the problem of heteroscedasticity (auto-
correlation). Estimation results can be seen in Table 1 with all dependent variables:
NER_SD, NER_SMP and NER_SMA.
Variable income per capita gives a statistical influence on all observed levels of
education with a positive sign. This shows that if there is an increase in income among
the poor population would also increase the school participation. The coefficient of
income per capita is more than 3 for all levels of education. This number describe the
elasticity of changes in Income per capita towards the changes in NER is very elastic.
The elasticity for elementary school level is the highest number compared to junior
and senior high school level. It can be stated that the level of elementary school is very
influential towards the per capita changes. Income per capita variable becomes a
variable that carries out an important role in increasing student participation in
Indonesia.
Determinants of the Net Enrollment Rate of Indonesia’s: Poor Population
751

Table 1. Estimation Results Using Fixed Effect Model for the Determinants of Participation
Rates of Poor Population Schools Equation and the Determinants of Average Length of
Education for Poor Population.
NER
_
SD_Mit NER
_
SMP_Mit NER
_
SMA_Mit
(5) (6) (7)
Constanta
-21.9378 *** -19.4134 ** * -22.3587 ***
(1.3995) (1.2727) (0.9029)
PKit
3.8180 *** 3.3820 *** 3.5781 ***
(0.1767) (0.1644) (0.1141)
GOV_Edit
0.0504 * -0.0662 ** -0.0848 ***0.1667
(0.0302) (0.0304) (0.0235)
GINIIT
0.8377 * -0.5017 0.8933 **
(0.4753) (0.5378) (0.3786)
AGE
_
712it
2.1961
(3.3377)
AGE
_
1315it
23.2729 ***
(5.0769)
AGE
_
1618it
-10.8551 ***
(1.965)
AR (1) )
0.6454 *** 0.3947 ***
(0.0716) (0.0749)
AR (2)
-0.0298
(0.0388)
R2
0.9982 0.9985 0.9986
Ad
j
R2
0.9975 0.9979 0.9977
Description:
⎯ brackets indicate the standard error
⎯ indicate the level of significance of alpha 10%
⎯ ** indicate significance level at alpha 5%
⎯ *** indicates a significant level of alpha 1%
Specifically, for each province the influence of the Income per capita variable can be
shown in the following Table 2. Many provinces have a large influence on income per
capita of poor families (very elastic). This shows the sensitivity of this variable in
influencing the increase in school participation at the elementary, junior high and high
school levels.
MIICEMA 2019 - Malaysia Indonesia International Conference on Economics Management and Accounting
752

Table 2. Model Specification Coefficients for Income per capita Variables.
NO Prov SD SMP SMA RLS
1
_
ACEH - PK
_
ACEH 10.36 9.35 0.31 -0.13
2
_
SUMUT - PK_SUMUT 9.06 5.73 5.34 0.35
3
_
SUMBAR - PK
_
SUMBAR 5.62 3.62 2.45 -0.50
4
_
RIAU - PK
_
R 5.43 4.80 5.99 0.13
5
_
JAMBI - PK_JAMBI 11.03 7.38 6.98 -0.10
6
_
SUMSEL - PK
_
SUMSEL 11.91 6.66 6.80 -0.04
7
_
BENGKULU - PK
_
BENGKULU 16.11 15.10 12.62 0.12
8
_
LAMP - PK_LAMP 9.75 5.38 6.28 2.12
9
_
BABEL -PK
_
BABEL 3:44 3.99 0.94 -0.18
10
_
JABAR - PK
_
JABAR 6.44 3.14 6.69 0.72
11
_
JATENG - PK_JATENG 12.05 17.39 23.89 0.95
12
_
YOGYA - PK
_
YOGYA 14.76 20.27 8.51 0.01
13
_
JATIM - PK
_
JATIM 9.11 5.64 5.94 0.58
14
_
BANTEN - PK_BANTEN 4.45 3.73 2.36 0.10
15
_
BALI- -PK
_
BALI 3.95 1.80 2.01 0.14
16
_
NTB - PK
_
NTB 7.04 5.06 2.78 -0.10
17
_
NTT - PK_NTT 9.76 5.01 5.52 -0.20
18
_
KALBAR - PK
_
KALBAR 5.82 4.93 4.04 0.16
19
_
KALTENG - PK
_
KALTENG 4.99 5.67 2.95 0.05
20
_
KALSEL -PK_KALSEL 3:26 2.37 2.56 0.21
21
_
KALTIM - PK
_
KALTIM 4.37 3.85 5.02 0.76
22
_
KALUT - PK
_
KALUT 0.62 0.45 2.15 -0.02
23
_
SU LUT - PK_SULUT -0.29 2.77 1.66 4.66
24
_
SULTENG - PK
_
SULTENG 7.57 5.47 4.60 0.04
25
_
SULSEL - PK
_
SULSEL -0.13 3.47 3.05 5.04
26
_
SULTRA - PK_SULTRA -0.26 4.93 3.68 5.97
27
_
MALUKU - PK
_
MALUKU -0.37 5.79 5.46 7.22
28
_
MALUT --PK
_
MALUT 3.02 3.29 2.94 0.04
29
_
PAPUA - PK_PAPUA 3.25 1.86 1.10 0.06
Source: Data Processing
The effect of government expenditure on education statistically affects the education
participation but only at the elementary level which has a positive sign. In other words,
government spending on education can increase the education participation of the poor.
For the poor at the Junior High and Senior levels, the effect is negative. This indicates
that government expenditure has more influence on poor people in basic education
compared to secondary education.
Based on the model specifications, it can be seen which provinces have a large
impact and can even reduce student participation rates from government expenditure
Determinants of the Net Enrollment Rate of Indonesia’s: Poor Population
753

variables for education. Bengkulu Province is a province that has a positive impact on
government spending on the education sector. This can be seen from the number of
elementary, junior high and senior high student participation rates that remain high. The
following table shows the coefficient on government expenditure for the poor on
student enrollment.
Table 3. Coefficient Specifications Model for Government Expenditure.
NO Provincial Elementary
Junior
Hi
g
h
Senior
Hi
g
h
RLS
1
_
ACEH - GOV_ED_ACEH -0.06 0.48 0.47 0.00
2
_
SUMUT - GOV
_
ED
_
SUMUT -0.36 0.22 1.09 -0.10
3
_
SUMBAR - GOV
_
ED
_
SUMBAR -0.22 0.13 0.09 0.08
4
_
RIAU-- GOV_ED_RIAU -1.45 -1.94 -1.86 0.11
5
_
JAMBI - GOV
_
ED
_
JAMBI 1.45 1.44 1.78 -0.04
6
_
SUMSEL - GOV
_
ED
_
SUMSEL -1.01 0.34 1.00 -0.01
7
_
BENGKULU - GOV_ED_BENGKULU 1.80 2.65 1.59 -0.01
8
_
LAMP - GOV
_
ED
_
LAMP -2.39 0.82 0.13 0.36
9
_
BABEL - GOV
_
ED
_
BABEL 0.02 0.09 0.38 0.03
10
_
JABAR - GOV_ED_JABAR -0.70 -0.66 -0.08 -0.20
11
_JATENG - GOV_ED_JATENG
-0.91 -1.27 -
0.11
0.25
12
_
YOGYA - GOV_ED_YOGYA -1.93 -1.06 -0.71 0.02
13
_
JATIM - GOV
_
ED
_
JATIM -0.75 0.48 -0.99 -0.25
14
_
BANTEN - GOV
_
ED
_
BANTEN 0.26 0.05 0.04 -0.06
15
_
BALI - GOV_ED_BALI 0.07 0.01 0.08 -0.03
16
_
NTB - GOV
_
ED
_
NTB -0.11 0.20 0.54 -0.02
17
_
NTT -GOV
_
ED
_
NTT to 0:05 0:20 -0.07 -0.01
18
_
KALBAR - GOV_ED_KALBAR -0.71 -1.31 -0.30 -0.28
19
_
KALTENG - GOV
_
ED
_
KALTENG 0.14 0.49 0.10 0.03
20
_
KALSEL - GOV
_
ED
_
KALSEL 0.07 0.07 -0.45 0. 05
21
_
KALTIM - GOV_ED_KALTIM -0.28 -0.22 -0.14 0.06
22
_
KALUT - GOV
_
ED
_
KALUT 0.09 0.12 0.07 0.00
23
_
SULUT - GOV
_
ED
_
SULUT -0.52 -0.68 -0.11 0.08
24
_
SULTENG - GOV_ED_SULTENG -1.56 -1.36 -0.83 0.07
25
_
SULSEL-- GOV
_
ED
_
SULSEL -0.28 0.12 0.12 -0.01
26
_
SULTRA - GOV
_
ED
_
SULTRA -0.62 -0.32 -0.62 0.01
27
_
MALUKU - GOV_ED_MALUKU -0.23 -0.23 -0.10 0.00
28
_
MALUT - GOV
_
ED
_
MALUT -0.11 0.02 -0.05 0.00
29
_
PAPUA - GOV
_
ED
_
PAPUA -0.50 - 2.25 -3.82 0.18
Source: Data Processing
MIICEMA 2019 - Malaysia Indonesia International Conference on Economics Management and Accounting
754

Income inequality significantly affects the elementary and high school levels, while for
the junior high level the effect is not statistically significant for education participation
of the poor. The increase in income inequality shows the effect on increasing school
participation at the elementary and high school levels. This increase in inequality also
shows a gap in income from the rich and poor. The increase in the gap can be caused
by an increase in the income level of the rich who certainly has an influence in
increasing government tax revenue which in turn will also be used to encourage the
level of student participation among the poor.
Table 4. Specifications model for Income Inequality Variable.
NO Provincial Elementary
Junior
Hi
g
h
Senior
Hi
g
h
RLS
1
_
ACEH - GINI
_
ACEH 130.37 30.15 33.17 1.91
2
_
SUMUT - GINI
_
SUMUT -0.58 12.64 2.63 0.80
3
_
SUMBAR - GINI
_
SUMBAR -0.73 -1.80 -1.15 7.14
4
_
RIAU-- GINI
_
RIAU -11.41 -7.41 -6.58 0.15
5
_
JAMBI - GINI
_
JAMBI 3.04 3.80 48.24 -1.00
6
_
SUMSEL - GINI
_
SUMSEL -7.88 -7.64 -10.66 -0.22
7
_
BENGKULU - GINI
_
BENGKULU -38.73 -71.14 -27.46 -0.10
8
_
LAMP - GINI
_
LAMP 4.88 -1.69 -7.96 1:06
9
_
BABEL - GINI
_
BABEL -7.20 -8.81 -0.88 1.23
10
_
JABAR - GINI
_
JABAR -1.80 -2.09 -3.37 1.13
11
_
JATENG - GINI
_
JATENG -6.09 14.56 37.58 2.06
12
_
YOGYA -GINI
_
YOGYA to 3:19 2:27 30.28 -0.38
13
_
JATIM - GINI_JATIM -1.56 4.02 8.12 1.38
14
_
BANTEN - GINI
_
BANTEN -0.47 -0.38 0.16 0.36
15
_
BALI - GINI_BALI 1.72 2.57 4.31 0.19
16
_
NTB - GINI
_
NTB -17.78 -16.68 2.41 0.57
17
_
NTT - GINI_NTT -13.56 -12.71 -4.61 2.29
18
_
KALBAR - GINI
_
KALBAR 1.24 0.23 2.27 -0.25
19
_
KALTENG - GINI_KALTENG 1.91 1.52 0.87 -0.02
20
_
KALSEL - GINI
_
KALSEL 0.85 -1.74 8.18 -1.26
21
_
KALTIM - GI NI_KALTIM -1.68 -3.39 -1.96 0.24
22
_
KALUT - GINI
_
KALUT -5.47 -2.26 10.96 0.04
23
_
SULUT - GINI_SULUT 1.89 0.28 0.62 0.08
24
_
SULTENG - GINI
_
SULTENG -19.14-12.80-0.93 -10.63
25
_
SULSEL - GINI_SULSEL 6.33 2.84 0.12 0.23
26
_
SULTRA - GINI
_
SULTRA -2.08 -9.90 1.85 4:47
27
_
MALUKU-GINI_MALUKU 11.98 5:49 -8.63 -1.45
28
_
MALUT - GINI
_
MALUT -1.89 3.82 -0.06 -0.83
29
_
PAPUA -GINI_PAPUA 2.60 to 3:17 3:01 0:24
Source: Data Processing
Determinants of the Net Enrollment Rate of Indonesia’s: Poor Population
755

The age factor at the elementary level has no influence on the participation of the poor
population in education. This is because the NER value is already quite high as a result
of compulsory education and free school fees at the elementary and junior high levels.
Elementary school as compulsory education has also been realized by all social levels
in Indonesia. This is reflected by the NER which reaches more than 100%, where the
awareness to enter elementary school level is very large. This high NER figure
illustrates that the level of awareness of entering school at the elementary school age
(7-12 years), and outside of elementary school age is very high.
At the junior high and high school levels the age factor has a significant influence
on educational participation among the poor population. For junior high school level,
the increased number of ages for entering junior high school education will increase the
junior high enrollment rates, while for senior high school level the increase number of
senior high school age will reduce the number of high school education participation
among the poor population. This illustrates that at the high school level the participation
rate of the poor is still very low, so that even though the age of senior high is also
escalate, it is not necessarily used for entering high school education. It can be seen that
there is a substitution to enter high school level on other expenses made by the poor,
hence the cost of high school education is still considered high for the poor.
5 Conclusion
Within the studies results and discussion it can be concluded that: (1) Income per capita
is an important variable in increasing NER in Indonesia; (2) Income per capita
coefficient value which is very elastic can also provide an illustration of the
effectiveness to increase income per capita, thus immediately able to increase NER at
every level of education in Indonesia; (3) Government expenditure on education also
can increase NER for elementary and high school, but at junior high school level it has
the effect of reducing NER; (4) Age factor has an influence on educational participation
in junior and senior high school education, for elementary school level it has no effect.
References
Anyanwu, JC., and Erhijakpor, AEO. (2007). Education Expenditures and School Enrolment in
Africa: Illustrations from Nigeria and Other SANE Countries. Economic Research Working
Paper No. 92.
Azid, T., and Khan, R.E.A. (2010). Who Are the Children Going to School in Urban Punjab
(Pakistan)? International Journal of Social Economics 37 (6): 442–65.
World Bank. (1996). World Development Report: From Plant to Market. World Bank
Publication.
Checchi, D. (1999). Inequality in Incomes and Access to Education: A Cross-Country Analysis.
Retrieved October 18, 2014 retrieved from: https://air.unimi.it/retrieve/
handle/2434/15297/85963/Inequality in Incomes and Access.pdf).
Dollar, D.; Kraay, A.(2001). Growth is good for the poor (English). Policy Research working
paper; no. WPS 2587. Washington, DC: World Bank. retrieved from :http://documents.
worldbank.org/curated/en/419351468782165950/Growth-is-good-for-the-poor
MIICEMA 2019 - Malaysia Indonesia International Conference on Economics Management and Accounting
756

Faguet, J., and Sánchez, F. (2008). Decentralization's Effects on Educational Outcomes in Bolivia
and Colombia. World Development 36 (7): 1294–1316.
Fahmi, M., and Satriatna, B. (2013). Development in Education Sector: Are the Poor Catching
Up? Working Paper in the Center for Economics and Development Studies, Padjadjaran
University (6).
Fields, GS.(1989). Changes in Poverty and Inequality in the Developing Countries,
Mimeographed Paper.
Flug, K., Spilimbergo, A and Wachtenheim, E. (1998). Investment in Education: Do Economic
Volatility and Credit Constraints Matter? Journal of Development Economics 55 (2): 465–81.
Harbison, FH. (1973). Human Resources As the Wealth of Nations, New York: Oxford
University Press.
Maipita, I. (2014). Measuring Poverty and Income Distribution. Yogyakarta: UPP STIM YKPN.
Mazumdar, T., Raj, S.P. and Sinha, I. (2005) Reference Price Research: Review and Propositions.
Journal of Marketing, 69, 84-102. http://dx.doi.org/10.1509 /jmkg.2005.69.4.84
Pritchett, L.and Filmer, D. (1999). What Education Production Functions Really Show: A
Positive Theory of Education Expenditures. Economics of Education Review 18: 223–39.
Psacharopoulos, G. (1994). Returns to Investment in Education: A Global Update. World
Development 22 (9).
Rajkumar, SA. and Swaroop, V. (2008). Public Spending and Outcomes: Does Governance
Matter? Journal of Development Economics 86 (1): 96–111.
Schultz, TW. (1961). Investment in Human Capital. The American economic review, 51 (1): 1–17
Sharp, AM, Register, CA, Grimes, PW. (2000). Economics of Social Issues, 14th edition, New
York: Irwin / McGraw-Hill.
Todaro, M.P., and Smith, SC. (2012). Economic Development, Eleventh Edition. 11th
Wooldridge, JM. (2009). Introductory Econometrics: A Modern Approach. South-Western.
Determinants of the Net Enrollment Rate of Indonesia’s: Poor Population
757
