
Analysis of Financial Performance Assessment using
Economic Value Added (EVA) Method in Listed
Company at Jakarta Islamic Index
Wuryaningsih Dwi Lestari, Sisilia Reviera Ramadhani Saputri,
and Muhammad Sholahuddin
*
Management Department, Faculty of Economics and Business,
Universitas Muhammadiyah Surakarta, Indonesia
Abstract. This research aimed to analyze financial performance in listed
company at Jakarta Islamic Index (JII) during 2015 until 2017 period by using
the method of Economic Value Added (EVA). This research is descriptive
research with quantitative approach. The data used in this research was secondary
data from official website of BEI,www.idx.co.id. The sampling technique in this
research used purposive sampling technique. The total of sample were 17
companies.The data analysis was started from calculating NOPAT, IC, WACC,
CC, and the last was EVA. The result of this research showed that from 17
companies, 16 companies had positive value of EVA during period of research
that means the company already been able to produce economic value added, and
just one company that had negative value of EVA namely PT. Kalbe Farma Tbk
in 2015, that means in that year, the company didn’t able to produce economic
value added yet. The company that has the best average value of EVA was PT.
Telekomunikasi Indonesia Tbk, meanwhile, the company that had the lowest
average value of EVA was PT. London Sumatra Indonesia Tbk. For the investors
, the analysis result of EVA can be used as consideration in determining which
company that has good performance so that deserved to be given an investment.
For company, the rank list of EVA value can be used as reference to develop its
performance in order to become the first rank in value acquisition of EVA.
Keyword: Financial Performance ꞏ WACC ꞏ Economic Value Added (EVA)
1 Introduction
1.1 Research Background
The tight of business competition in this digital era encourages company to maximalize
the performance by applying various strategy. One of them is by increasing the
company’s performance so that make investors interest to invest in the company. The
performance assessment is very important to be performed by every company. One of
the main function in performance assessment is to determine the company’s success in
achieving its purpose which is to maximalize the value of company or the value of
stakeholder indirectly (Yusbardini, 2017).
630
Lestari, W., Saputri, S. and Sholahuddin, M.
Analysis of Financial Performance Assessment using Economic Value Added (EVA) Method in Listed Company at Jakarta Islamic Index.
DOI: 10.5220/0010524100002900
In Proceedings of the 20th Malaysia Indonesia International Conference on Economics, Management and Accounting (MIICEMA 2019), pages 630-650
ISBN: 978-989-758-582-1; ISSN: 2655-9064
Copyright
c
2022 by SCITEPRESS – Science and Technology Publications, Lda. All rights reserved

Until now, the various criteria is presented for examining the company’s performance.
One of them is by using traditional approach with ratio analysis. The problem from
this approach is most of them depends on historical value. The value resulted from
various accounting convention. All of this convention are for auditing than for the
assessment of company’s performance. Besides, some other issue show that traditional
approach not explicitly facing managment risk and capital investment in the future.
Calculation by using ration analysis just focused on final result of company’s income
without noticing the risk that may be charged by company. (Walsh, Ciaran, 2014).
Good company uses Value Based Management (VBM) as the basic of measuring
performance. VBM has two important elements, namely value creation of stakeholder
and also informant for mangement about company’s performance. The criteria that
related with added value is the most important thing. For the very first time , this criteria
was suggested by Stren-Stewart. According to Stewart, the criteria of measuring other
company’s performance which is not perfect yet, meanwhile the criteria of value added
that related with the changing of stakeholder’s properties is the right measurement for
evaluating the company’s performance. (Jamkarani and Banafi, 2017).
Economic Value Added (EVA) is value added to stakeholder that is given during
certain period. EVA focuses on managerial effectivity in certain year. (Eugene and
Hauston, 2001). EVA is the only one right measurement to calculate all component that
involved in value creation, that is why this measurement is right to determine purpose,
evaluate performance, determine bonus, communicate with investor, budget the capital
also the other assessments. EVA is deviation between capital return and capital cost,
multiply by the capital of book value that is used for producing capital cost. However,
this method served the changing of increasing residual income, that defined as
Operating income minus by capital cost. Mathematically, EVA gives the same result
such as the assessment with Discounted Cash Flow (DCF), or Net Present Value
(NPV), since a long time ago and generally is approved as the best tool to analyze
theoritically from stakeholder’s prespective (Sabol and Sverer, 2017).
EVA gives good matrix about whether the company already given the value added
for stakeholder. Therefore, if the manager focuses on EVA, itwill visible whether
company already operated consistently for maximalizing the value of stakeholder.
EVA also can be used for analyzing division or whole company, so that EVA can give
the beneficial basic in determining of management compensation in all level. Until now,
there are many company that already used EVA as basic in determining of management
compensation. (Eugene and Hauston, 2001).
Analysis that was conducted by Wahyu (2017) stated that the EVA’s result are
always positive showed that repayment that is accepted by company is bigger than
capital cost and debt. This thing was good for the consideration of prospective
investors. (Wahyu, 2017). This research was conducted by Titik Inayati, et.al (2014)
showed that BMT can create the value ofNet Operating Profit After Tax (NOPAT)
increased significantly than capital funds. The profit is higher from accounting income
showed that BMT had good performance. The capital that consist of debt and equity
already used effeciently and effectively so that can increase the profit (Inayati, 2014).
The research that was conducted by Muhammad Khaddafi and Mohd. Heikal
(2014) showed that the company’s performance had negative value in average. Only
PT. Ades Waters Indonesia that had positive value. This thing was caused by the capital
fund that was higher than net income after tax, so that the company financial
performance was not good because they could not maximilize the value of stakeholder
Analysis of Financial Performance Assessment using Economic Value Added (EVA) Method in Listed Company at Jakarta Islamic Index
631

(Khaddafi and Heikal, 2014). Based on reasearch by Wahyu (2017), Inayati (2014),
and Khaddafi dan Heikal (2014), it can be concluded that EVA is not always produce
the same value. Positive and negative value of EVA give different description through
company financial performance.
Research problem in this paper are : (1) How the financial performance in company
that listed in Jakarta Islamic Index (JII) on 2015-2017 period if it was analyzed by
using Economic Value Added (EVA)?; (2) How the list of company’s rank in Jakarta
Islamic Index (JII) based on the analysis of financial performance by using the method
of Economic Value Added (EVA)?
The purposes of this paper were : (1) To analyze the financial performance in
company that listed in Jakarta Islamic Index (JII) during 2015-2017 period by using
the method of Economic Value Added (EVA); (2) To identify the rank of company in
Jakarta Islamic Index (JII) based on the result of financial performance analysis by
using the method of Economic Value Added (EVA).
2 Literature Review
2.1 Theoretical Basis
1. Analysis of Financial Performance
Financial Performance of Company can be defined as manager’s work in doing their
task, that related with company financial management. Financial company performance
can be shown by company’s financial statement during certain period. (Sidharta and
Affandi, 2016).
a. Analysis of Financial Ratio
Ratio can be defined as proportion numbers from one to another. (Fahmi, 2017:
107). Ratio analysis is analysis through simple arithmatic operations by connecting
between two quantity mathematically. Ratio analysis is popular and mostly used
(Sirait, 2017: 36). Hanafi and Halim, (2009) in book “ Analisis Laporan
Keuangan”, classified ratio analysis into 5 categories, they are:
1) Liquidity ratio is ratio that measure the ability of company in fulfilll its
short-term liability.
2) Activity Ratio , ratio that measure how far the effectivity of use assets by
seeing the asset’s activity.
3) Solvency Ratio, is ratio that measure how far the ability of company in
fulfilling long- term liability .
4) Profitability Ratio, is ratio that see the ability in producing profit.
5) Market Ratio is Ratio that see the development of company’s relative value
through book value’s company
According to Sofan Syafri Harahap from book entitled” Analisis Laporan
Keuangan” (Fahmi, 2017: 109), stated that ratio analysis has some benefit such as :
1) Financial ratio that contains numbers and statistical summary that is
readable.
2) Asimple replacement form of finansial statement.
MIICEMA 2019 - Malaysia Indonesia International Conference on Economics Management and Accounting
632

3) Understanding about the position of company’s financial in the middle of
other industry.
4) Very Useful as a material of decision making.
5) Standardize the size of company
6) Easier than other company or see the development of company periodically.
7) Easier to see company’s trend and also to predict the future.
Besides has advantages, Murhadi (2013) stated that there are some things that must
be noticed in using the analysis of financial ratio, such as :
1) Financial Ratio cannot be seen isolatedly. This ratio only can give benefit if
compared with other company in same industry or compared with other
period.
2) Remember that every company use different method of accounting and
different division, so it will influence to ratio that will be analyzed, so that
for comparing with other company it will be difficult.
3) In application of analysis ratio, conclusion cannot be taken based on only
one ratio, however must consider all of ratio. In a case some ratio showed
that the company is healthy but the other are opposite. This thing is more
difficult in decision making.
4) Every data that is obtained and used in analyzing is source from company’s
financial statement. So, it is very possible if the data, the numbers don’t have
high accuracy or the data must be changed as needs. Later, this thing will
influence the ratio that being compared. (Fahmi, 2017: 110)
b. Balance Scorecard (BSC)
Balance Scorecard is a system of performance management system for organization
to translate strategies in form of activity through various indicator of comprehensive
performance measurement. (Riswanto, 2018). According to Alimudin (2017),
balance scorecard is a system of management strategy that describe vision and
strategy that owned by company with operational purpose based on the matrix from
several perspective, namely financial perspective, customer perspective, internal
business process perspective, and learning and growth perspective. Balance
scorecard helps management to see business from four perspective, namely
financial perspective, internal business proess perspective, customers perspective,
dan learning and growth perspective (Hidayat, 2008).
The calculation of performance using those four perspectives make this method
has benefit than using traditional measurement. Erwin (2015), stated the benefit of
BSC such as:
1) BSC can be used as the tool for communicating strategy for stakeholders in
an organization, so that it can reduce the obstacles in achievi
ng the vision.
2) BSC enables the management for mapping all of main factor in organization,
both of visible or invisible. Meanwhile, in other method usually only focus
to visible factor. This thing can reduce the obstacles in organization
management.
Analysis of Financial Performance Assessment using Economic Value Added (EVA) Method in Listed Company at Jakarta Islamic Index
633

3) Besides supporting in preparation of organizational strategy planning, BSC
by using key performance indicator can be used for monitoring the strategy
achievement.
4) BSC has cause and effect concept, this thing can strengthen the team work
in organization indirectly, so that it can reduce the obstacles for person and
management.
5) BSC can help in organization budgeting.
2. Economic Value Added (EVA)
EVA term was popularized by Stren Seward Manangement Service, is an consultant
company in USA during 90’s. EVA is one of way to measure the financial performance
(Dewi, 2017). Economic Value Added (EVA) according to Widjaya and Tjun (2009)
as internal indicator that measures the stakeholder’s property in one company in certain
period. EVA measures how efficient of company uses the capital for creating Economic
Value Added. Economic Value Added is created if company produce return is bigger
than cost of capital.
EVA is based on economic profit which states that property only created if a
company consist of operating expenses and cost of capital (Young and O’Byrne, 2001:
17). EVA is difference between income every unit than come from company’s
operational or Net Operating Profit After Tax (NOPAT) and cost of capital for every
unit that caused by using of credit limit. Next, EVA can be defined as Net Income After
Taxes and after capital cost (Sabol dan Andrija, 2017). The capital consists of cash,
stock, and credit or working capital with other instrument. Capital cost is return rate
that needed by stakeholder and lender for funding the business operational. If income
exceeds operating expenses and cost of capital, thismeans the company already been
able to create property for stakeholders.
EVA is indicator about additional value in an investment. Positive EVA shows
return rate of capital is higher than cost of capital, this means company is able to create
Value added for company’s owner with increasing property. Meanwhile, negative EVA
means the performance of financial company is not good, the total of capital cost
company is higher than Net Income After Tax , so that the performance of financial
company is not good. (Widjaya, 2009).
Therefore EVA is more superior than accounting income as the measurement of
value creation because EVA covers cost of capital and operational risk. Perception of
EVA is based on the principle of effective economy that is value of company only
increase if able to create surplus on cost of capital. According to Iramani and Febrian
(2005), EVA ‘s benefit are :
1) EVA focuses on value added with still calculate expense as risk from an
investment.
2) EVA’s concept in measuring expectation is seen from economic aspect,
which is paying attention to expectation of all funders fairly. The
measurement of this fairness is stated by weighted size from capital structure
based on market value not book value.
3) The calculation of EVA can be used independently without comparison data
such as industry data or other company’s data as concept of assessment.
MIICEMA 2019 - Malaysia Indonesia International Conference on Economics Management and Accounting
634

4) EVA ‘s concept pararelled with stakeholders satisfaction concepts, because
it can be used as giving bonus for employee especially division that has
important role in increasing EVA’s result.
5) The easiness of EVA’s application shows that EVA is practically, easy to
calculate and easy to use so that can be used as fast decision making.
But, besides the benefits above, EVA still has some weakness such as :
1) EVA only measures the final result without seeing other certain activity.
2) EVA is too dependent on belief that investors just rely on the fundamental
approach in analyzing and determining the decision of buying and selling
certain share, whereas the other factor can be more dominant (Iramani dan
Febrian, 2005).
The supporting component for obtaining EVA’s calculation are as follows:
1) NOPAT (Net Operating Profit After Tax)
NOPAT is Income after tax and measure the profit of company in clean
operational (Young dan O’Byrne, 2001). According to Tunggal (2001: 5),
NOPAT is profit that obtained from company’s operational after minus by
income tax, but included financial cost and non cash bookkeeping entries
like depreciation. Meanwhile, According to Dwitayanti (in Karamoy,
2016), NOPAT is sum of Income after tax and interest fee from company.
2) Invested Capital (IC)
Tunggal (2005: 5) defined invested capital as the total of company’s loan
outside non interest liabilities, such as account payable, accrual payable,
advance from customer, etc Capital that invested same with the total of
company’s asset, where the company must expend cost to obtain.
3) Weighted Average Cost of Capital (WACC)
Nuzula (in Hidayati, 2015), stated that WACC is weighted cost from various
source of capital based on each composition of capital kinds WACC is used
for evaluating the result of project. WACC is sum of multiplication for each
kind capital with capital cost. According to Young and O’Byrne (2001: 149),
WACC is the same with the amount of cost from capital component includes
Long term liabilities,Short-term liabilities and equity of stakeholder that
scaled by relative proportion in structure of capital company in market value.
2.2 Theoritical Framework
Economic Value Added (EVA) is analysis tool that is used for measuring the Value
Added of Company that is conducted by calculating all of capital cost, both from
stakeholder or loan. The company that will be examined is listed company in Jakarta
Islamic Index (JII) for 2015-2017 period. EVA or Economic Value Added is obtained
from deviation between Net Operating Profit After Tax (NOPAT) with capital cost.
The result of positive EVA shows that return rate on capital is still higher than the
capital cost. This thing shows that company can create the Economic Value Added that
is shown by the increasing of property. On the other hand, if EVA’s result shows
Analysis of Financial Performance Assessment using Economic Value Added (EVA) Method in Listed Company at Jakarta Islamic Index
635
negative value so the return rate on capital is lower than the cost of capital level or the
cost of capital is higher than Operation Income After Tax. That means company is
unable to create Economic Added Value and to increase the property.
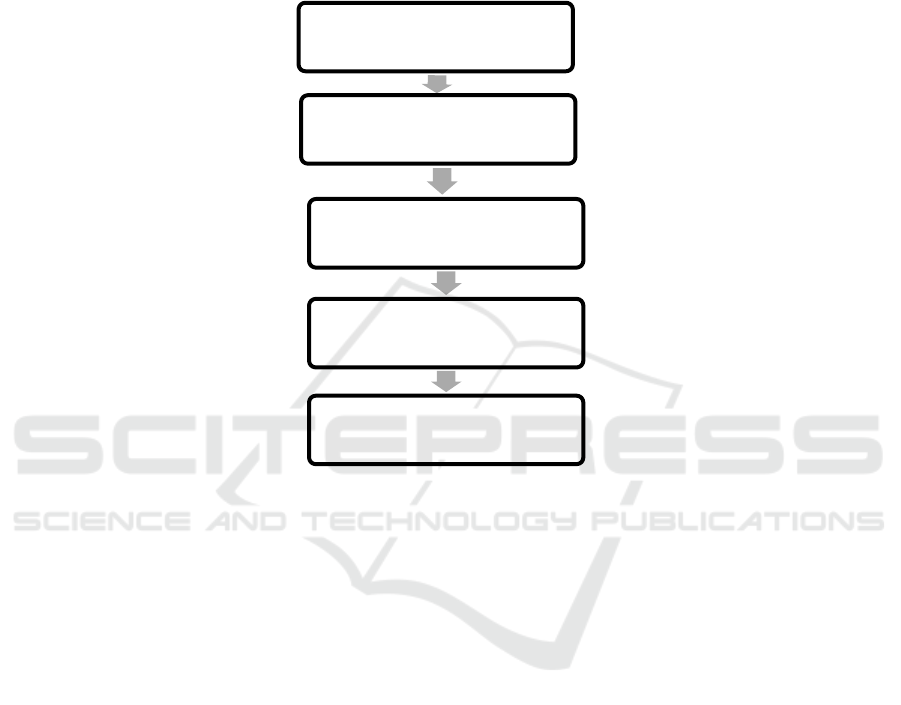
Based on the explanation above, so it can be arranged into theoritical framework for
analyzing the performance of financial company by using EVA method as follows:
Fig. 1. Theoritical Framework Perusahaan yang terdaftar di JII Periode 2015-2017= The
company that listed in JII on 2015-2017 period Laporan Keuangan= Financial Statement.
Pengukuran Kinerja Keuangan dengan Metode Perhitungan NOPAT, IC, WACC, IC, dan EVA
= The Measurement of Financial Performance by Calculation Method of NOPAT, IC, WACC,
IC and EVA.
3 Research Method
3.1 Research Type
This research used descriptive research by using quantitative approach. Descriptive
research generally has main purpose for describing fact and characteristic object
systematically and the right subject (Neolaka, 2014: 21). Quantitative Data is data that
served in numbers, so that at a glance it is easy to recognize the differences from other
data (Subagyo, 2015: 97). This research analyzed the data of company’s financial
statement that listed in Jakarta Islamic Index (JII) on 2015-2017 period, for knowing
the performance of company by using method of Economic Value Added (EVA).
Perusahaan yang terdaftar
di JII periode 2015-2017
.
Laporan Keuangan
Pengukuran Kinerja
Keuangan dengan
Metode EVA
Perhitungan: NOPAT, IC,
WACC, IC dan EVA
Hasil
MIICEMA 2019 - Malaysia Indonesia International Conference on Economics Management and Accounting
636

3.2 Type and Source of Data
1. Type of Data: This research used secondary data. Secondary data was ready-made
data.Previously, this data was already collected and processed by other party then
being published for certain purpose. (Suryani and Hendryadi, 2018: 171).
2. Source of Data: The Data of this research had a source from written document about
profile and finansial statement of company that listed in JII during 2015 until 2017
period period that already publieshed by each companies through official website
of Bursa Efek Indonesia (BEI) is www.idx.co.id.
3.3 Method of Data Collection
For obtaining relevant data, in this research the writer used the method of data collection
as follows :
1. Documentation Method: Decomentation method consist of the activity of
seeking, collecting, recording and analyzing data that needed from other source
such as document, newspaper, and etc . Data from this research was financial
statement of company that listed in JII 2015-2017 period that come from official
website of BEI is www.idx.co.id.
2. Library Research: Seeking, collecting, and analyzing problems, theoretical basis
that support this research such as journals, books, expert’s opinion, article, and
other data that is needed in research.
3.4 Design of Sample Collection
1. Population: Population is generalization area that consist of subject or object that
have amount and certain characteristic that is determined by the researcher to be
examined further and concluded. (Sugiyono, 2015: 135). Population in this research
was all of company that listed in Jakarta Islamic Index (JII) during 2015-2017
period , amounted to 41 companies.
2. Sample: Sample is part and characteristic of population (Sugiyono, 2015: 136). The
technique of sample collection used purposive sampling. Purposive sampling is
technique of sample collection based on the certain criteria that already determined
before. (Jogiyanto, 2014: 98). The criteria of collecting based on idea or knowledge
and understanding of sample collector through population (Nursiyono, 2015: 25).
The criteria of collecting sample in this research were : (1) Listed company in
Jakarta Islamic Index (JII) during 2015 until 2017 period period, there were 41
companies; (2) Consistent company that listed in JII during 2015 until 2017 period.
In this research, there were 20 companies; (3) The company publish financial
statement consistenly in JII during 2015 until 2017 period. In this criteria there
were 20 companies; (4) The company uses rupiah in financial report . The company
that fulfill all criteria were 17.
From several of criteria sample that already determined, there were 17 companies that
fulfill the requirement as research data. The 17 companies were: Astra Agro Lestari
(AALI), AKR Corporindo (AKRA), Astra Internasional (ASII), PT Bumi Serpong
Damai (BSDE), Indofood CBP Sukses Makmur (ICBP), Kalbe Farma (KLBF), Lippo
Analysis of Financial Performance Assessment using Economic Value Added (EVA) Method in Listed Company at Jakarta Islamic Index
637

Karawaci (LPKR), PT London Sumatra Indonesia (LSIP), PT PP (Persero) (PTPP),
Semen Indonesia (Persero) (SMGR), PT Summarecon Agung (SMRA), PT Sawit
Sumbermas Sarana (SSMS), PT Telekomunikasi Indonesia (Persero) (TLKM), United
Tractors (UNTR), Unilever Indonesia (UNVR), Wijaya Karya (WIKA) (www.idx.co.id)
3.5 Methode of Data Analysis
The processing data that already collected was conducted by analyzing the result of
company financial performance descriptively using the method of Economic Value
Added (EVA). According to Dwitayanti, 2005 (in Karamoy, 2016), EVA can be
calculated by the steps and formula as follows :
1. Calculate NOPAT (Net Operating Profit After Tax), is used for calculating profit
level that is obtained from capital investment and the cost of capital . NOPAT is
obtained fromformula:
NOPAT = EAT + Interest Expense
2. Calculate Invested Capital (IC)
Invested Capital = (Total liabilities + Total Equity) – Short Term liabilities
3. Calculate Weighted Average Cost of Capital (WACC), by using formula:
WACC = {D x rd (1-T) + (E x re)}
when:
a. D = Capital Rate from Debt
x 100%
b. rd = The cost of Short term liabilities
x100%
c. T = Tax Rate
x100%
d. Re = cost of equity
x100%
e. E = Capital level from equity
x100%
4. Calculate Capital Charge (CC)
Capital Charge = WACC x Invested Capital (IC)
5. Analysis of EVA, by using formula:
EVA = NOPAT – Capital Charge (CC)
Total Hutang = Total liabilities
Total Hutang + Ekuitas =Total liabilities + Equity
Beban bunga = Interest Expense
Beban pajak = Tax Expense
Laba Sebelum Pajak = Income before tax
Laba bersih setelah pajak =Income After Tax
Total Ekuitas =Total Equity
MIICEMA 2019 - Malaysia Indonesia International Conference on Economics Management and Accounting
638

From the calculation above, it can be obtained conclusion with interpretation as
follows: If EVA’s value is positive (EVA > 0), shows that the company performance
during this time is able to produce Economic Added Value from the result of
operational . If EVA’s value equals with zero (EVA = 0),so the the company condition
is break even because the income already used for paying the obligation to funder.
Meanwhile if EVA’s value is negative (EVA < 0), shows that the company is not able
to produce Economical Value and failed to satisfy investmest’s expectation.
4 Research Result and Disscussion
4.1 Data Analysis
Below is calculation result of Economic Value Added (EVA) from 17 companies that
contained the value of Net Operating Profit After Tax (NOPAT), Invested Capital (IC),
Weighted Average Cost of Capital (WACC), EVA, and the explanation of calculation
result.
1. PT. Astra Agro Lestari Tbk
Table 1.1. shows that the calculation result of EVA in PT. Astra Agro Lestari Tbk. It
can be known that the value of EVA always increase every research year. In 2015
EVA’s value was 171.459, then in 2016 EVA’s value increased to 387.148, and in
2017 , EVA’s value increased to 581.895. This thing shows the financial performance
of PT. Astra Agro Lestari Tbk during 2015-2017 period was well. Besides, the postive
value of EVA means that PT. Astra Agro Lestari Tbk already success to create
Economic Added Value and give prosperity for stakeholder.
2. PT. AKR Corporindo Tbk
Table 1.2. shows the calculation result of EVA in PT. AKR Corporindo Tbk. It can be
known that EVA ‘s value was fluctuation every research year. In 2015 EVA’s value
was 395.663, then in 2016, EVA’s value increase became 418.532, and in 2017 EVA’s
value increased to 456.177. This thing shows the financial performance of PT. AKR
Corporindo during period 2015-2017 was well. Besides, positive EVA’s value means
PT. AKR Corporindo Tbk already successed and give prosperity for stakeholder.
3. PT. Astra International Tbk
Table 1.3. shows the research result about calculation result of EVA in PT. Astra
International Tbk. It can be known that EVA’s value was fluctuated during research
year. In 2015 EVA’s value was 5.181.181, then in 2016 EVA’s value increased to
7.161.191,and in 2017 EVA’s value decreased to 4.932.231. This thing shows that the
financial performance of PT. Astra International during period 2015-2017 was well.
Meanwhile, in 2017 the EVA’s value was decreased but still in positive value. The
positive value of EVA showed that PT. Astra International Tbk already successed to
create Economic Value Added and give prosperity for stakeholder.
Analysis of Financial Performance Assessment using Economic Value Added (EVA) Method in Listed Company at Jakarta Islamic Index
639

4. PT. Bumi Serpong Damai
Table 1.4. shows the research result of EVA in PT. Bumi Serpong Damai Tbk. It can
be known that EVA’s value was fluctuated during research year. In 2015 EVA’s value
was 512.262, and then in 2016 , EVA’s value decreased to 431.782, and in 2017
EVA’s value increased to 945.541. This thing showed that the financial performance
of PT. Bumi Serpong Damai during period 2015-2017 was well, because , although
the condition was fluctuative , EVA’s value was always positive. The positive value of
EVA showed that PT. Bumi Serpong Damai Tbk already successed to create Economic
Value Added and give the prosperity for all stakeholder.
5.PT. Indoofood CBP Sukses Makmur
Table 1.5. shows the calculation result of EVA in PT. Indoofood CBP Sukses Makmur
Tbk, it can be known that EVA’s value was fluctuated during research year. In 2015
EVA’s value was 769.645, and then in 2016 EVA’s value was increased to 889.721,
and in 2017 EVA’s value decreased to 823.271. This thing showed that the financial
performance of PT. Indoofood CBP Sukses Makmur during period 2015-2017 was
well, because, although the condition was fluctuative , EVA’s value was always
positive. The positive value of EVA showed that PT. Indoofood CBP Sukses Makmur
already successed to create Economic Value Added and give the prosperity for all
stakeholder.
6. PT. Indoofood Sukses Makmur Tbk
In table 1.6 shows that the calculation result of EVA in PT. Indoofood Sukses Makmur
Tbk. It can be known that EVA’s value was fluctuacted during research year. In 2015
EVA’s value was 1.811.993, and then in 2016 EVA’s value increased to 2.016.705,
and in 2017 EVA’s value decreased to 1.949.419. This thing showed that the financial
performance of PT. Indoofood Sukses Makmur Tbk during period 2015-2017 was well,
because, although the condition was fluctuative, EVA’s value was always positive. The
positive value of EVA showed that PT. Indofood Sukses Makmur Tbk already
successed to create Economic Value Added and give the prosperity for all stakeholder.
7. PT. Kalbe Farma Tbk
Table 1.7 shows that the calculation result of EVA in PT. Kalbe Farma Tbk. It can be
known that EVA’s value was fluctuacted during research year. In 2015 EVA’s value
was -322.104, and then in 2016 EVA’s value was increased became 369.889, and in
2017 EVA’s value decrease again became 340.938. This thing showed that the
financial performance of PT. Kalbe Farma during period 2015-2017 was good enough
, although during period 2015-2017 company showed various EVA’s value. In 2015
EVA’s value was negative , This thing caused by NOPAT’s value in that year was
lesser than Capital Charge’s value. The negative EVA’s value showed that the
company could not be able to create Economic Value Added yet and give worth return
for stakeholder. In 2016 and 2017 EVA’s value was positive. The positive value of
EVA showed that PT. Kalbe Farma Tbk already successed to create Economic Value
Added and give the prosperity for all stakeholder.
MIICEMA 2019 - Malaysia Indonesia International Conference on Economics Management and Accounting
640

8. PT. Lippo Karawaci
Table 1.8. shows the calculation research of EVA in PT. Lippo Karawaci Tbk. it can
be known that EVA’s value was fluctuacted during research year. In 2015 EVA’s value
was 1.377.506, and then in 2016 EVA’s value decreased to 599.349, and in 2017
EVA’s value decreased again to 568.917. This result showed that the financial
performance of PT. Lippo Karawaci during period 2015-2017 was well , because
EVA’s value was always positive. The positive EVA’s value showed that PT. Lippo
Karawaci Tbk already successed to create Economic Value Added and give the
prosperity for all stakeholder.
9. PT. London Sumatra Indonesia Tbk
Table 1.9. shows that the calculation research of EVA in PT. London Sumatra
Indonesia Tbk. It can be known in 2015 EVA’s value was 63.005, and then in 2016
EVA’s value increased to 75.029, and then in 2017 EVA’s value decreased to 56.405.
The result showed the financial performance of PT. London Sumatra Indonesia Tbk
during 2015-2017 period was well although was decreased, EVA’s value was always
positive. The positive EVA’s value showed that PT. London Sumatra Indonesia
Tbkalready successed to create Economic Value Added and give the prosperity for all
stakeholder.
10. PT. PP (Persero)
Table 1.10.shows that the calculation research of EVA in PT. PP (Persero) Tbk. it can
be known that EVA’s value was fluctuacted during research year. In 2015 EVA’s value
was 473.792, and then in 2016 EVA’s value increased to 794.666, and in 2017 EVA’s
value increased again to 1.190.135. The result showed that the financial performance
of PT. PP (Persero) during period 2015-2017 was well. This things due to during period
2015-2017 the company always had Positive EVA’s value , and increased every year.
The positive EVA’s value showed that PT. London Sumatra Indonesia Tbk already
successed to create Economic Value Added and give the prosperity for all stakeholder.
11. PT. Semen Indonesia (Persero) Tbk
Table 1.11.shows that the calculation result of EVA in PT. Semen Indonesia (Persero)
Tbk. It can be known that EVA’s value was fluctuacted during research year. In 2015
EVA’s value was 1.209.003, In 2016 EVA’s value decreased to 885.872, and in 2017
EVA ‘s value decreased again to 565.902. The result showed that the financial
performance of PT. Semen Indonesia (Persero) Tbk during period 2015-2017 was well,
because EVA’s value was always positive. The positive EVA’s value showed that PT.
Semen Indonesia (Persero) Tbk already successed to create Economic Value Added
and give the prosperity for all stakeholder.
12. PT. Summarecon Agung Tbk
Table 1.12. shows the calculation result of EVA in PT. Summarecon Agung Tbk. It
can be known that EVA’s value was fluctuacted during research year. In 2015 EVA’s
value was 473.042, and then in 2016 EVA’s value decreased to 381.676, and in 2017
EVA’s value increased to 457.110. This result showed that financial performance of
PT. Summarecon Agung Tbk during period 2015-2017 was well. This thing due to
during 2015-2017 period, company produced positive value of EVA. , although the
Analysis of Financial Performance Assessment using Economic Value Added (EVA) Method in Listed Company at Jakarta Islamic Index
641

value was decreased in 2016. The positive EVA’s value showed that PT. Summarecon
Agung Tbk already successed to create Economic Value Added and give the prosperity
for all stakeholder.
13.PT. Sawit Sumbermas Sarana Tbk
Table 1.13. shows the calculation result of EVA in PT. Sawit Sumbermas Sarana Tbk.it
can be known that EVA’s value was fluctuacted during research year. In 2015 EVA
‘s value was 162.240, in 2016 EVA’s value increased to 766.367, and in 2017 EVA’s
value increased again to 1.037.212. This things showed that the financial performance
of PT. Sawit Sumbermas Sarana Tbk during period 2015-2017 was well. This thing
due to during period 2015-2017 company produced positive value of EVA, and
increased every year. The positive EVA’s value showed that PT. Sawit Sumbermas
Sarana Tbk already successed to create Economic Value Added and give the prosperity
for all stakeholder
14. PT. Telekomunikasi Indonesia (Persero)
Table 1.14. shows the calculation result of EVA in PT. Telekomunikasi Indonesia
(Persero) Tbk. In 2015 EVA’s value was 6.051.404, In 2016 EVA’s value increased to
7.633.895, and in 2017 EVA’s value increased again to 8.764.506. This result showed
that the financial performance of PT. Telekomunikasi Indonesia (Persero) during 2015-
2017 period was well. This thing due to during 2015-2017 period company produced
positive value of EVA , and increased every year. The positive EVA’s value showed
that PT. Telekomunikasi Indonesia (Persero)already successed to create Economic
Value Added and give the prosperity for all stakeholder
15. PT. United Tractors Tbk
Tabel 1.15. shows the calculation result of EVA in PT. United Tractors Tbk. In 2015
EVA’s value was 64.967, In 2016 EVA’s value decreased to 1.505.136, and in 2017
EVA’s value increased again to 2.734.347. This result showed that the financial
performance of PT. United Tractors Tbk during 2015-2017 period was well. This
thing due to during 2015-2017 period, company produced positive value of EVA ,and
increased every year.The positive EVA’s value showed that PT. United Tractors Tbk
already successed to create Economic Value Added and give the prosperity for all
stakeholder.
16. PT. Unilever Indonesia
Table 1.16. shows the calculation result of EVA in PT. Unilever Indonesia Tbk. In 2015
EVA ‘s value was 3.566.100, and then in 2016 EVA’s value increased to 4.708.612,
and in 2017 EVA’s value increased again to 4.919.791. This result showed the financial
performance of PT. Unilever Indonesia Tbk during 2015-2017 period was well. This
thing due to during 2015-2017 period, company produced Positive value of EVA ,and
increased every year.The positive EVA’s value showed that PT. Unilever Indonesia
Tbkalready successed to create Economic Value Added and give the prosperity for all
stakeholder.
MIICEMA 2019 - Malaysia Indonesia International Conference on Economics Management and Accounting
642

17. PT. Wijaya Karya Tbk
Table 1.17.shows the calculation result of EVA in PT. Wijaya Karya Tbk. In 2015
EVA’s value was 699.320, then in 2016 EVA’s value was increased to 805.030, and
in 2017 EVA’s value increased again to 1.259.521. This thing due to during 2015-2017
period,company produced positive value of EVA ,and increased every year.The
positive EVA’s value showed that PT. Wijaya Karya Tbk already successed to create
Economic Value Added and give the prosperity for all stakeholder.
Table 1. Hasil Perhitungan EVA PT. Astra Agro Lestari Tbk. (Dalam Jutaan Rupiah).
Tahun
NOPAT IC WACC CC EVA
Keter
angan
1. Astra Agro Lestari (AALI)
2015 810.112 17.990.238 3,55% 638.653 171.459 Positif
2016 2.262.453 20.283.155 9,29% 1.884.305 387.148 Positif
2017 2.198.272 18.536.438 8,72% 1.616.377 581.895 Positif
2. PT. AKR Corporindo Tbk
2015 1.180.874 10.331.728 7,60% 785.211 395.663 Positif
2016 1.119.584 10.015.033 7% 701.052 418.532 Positif
2017 1.393.880 11.393.718 8,23% 937.703 456.177 Positif
3. PT. Astra International Tbk
2015 16.331.000 169.193.000 6,59% 11.149.819 5.181.181 Positif
2016 20.344.000 172.776.000 7,63% 13.182.809 7.161.191 Positif
2017 21.336.000 196.924.000 8,33% 16.403.769 4.932.231 Positif
4. PT Bumi Serpong Damai
2015 2.991.949 29.875.745 8,3% 2.479.687 512.262 Positif
2016 2.865.670 32.845.986 7,41% 2.433.888 431.782 Positif
2017 5.731.823 38.382.371 12,47% 4.786.282 945.541 Positif
5. PT. Indoofood CBP Sukses Makmur
2015 3.177.020 20.558.280 11,71% 2.407.375 769.645 Positif
2016 3.808.145 22.432.163 13,01% 2.918.424 889.721 Positif
2017 3.666.905 24.791.926 11,47% 2.843.634 823.271 Positif
6. PT. Indoofood Sukses Makmur Tbk
2015 5.221.588 66.723.988 5,11% 3.409.595 1.811.993 Positif
2016 6.845.359 62.955.074 7,67% 4.828.654 2.016.705 Positif
2017 6.530.868 66.301.725 6,91% 4.581.449 1.949.419 Positif
7. PT. Kalbe Farma Tbk
2015 2.082.235 11.330.537 21,22% 2.404.339 (322.104)
N
e
g
atif
2016 2.383669 12.908.847 15,6% 2.013.780 369.889 Positif
2017 2.489.201 14.388.90 14,93% 2.148.263 340.938 Positif
8. PT. Lippo Karawaci
2015 1.888.081 36.469.674 4,14% 510.575 1.377.506 Positif
2016 2.485.859 38.737.374 4,87% 1.886.510 599.349 Positif
2017 2.009.724 48.026.930 3% 1.440.807 568.917 Positif
Analysis of Financial Performance Assessment using Economic Value Added (EVA) Method in Listed Company at Jakarta Islamic Index
643

Table 1. Hasil Perhitungan EVA PT. Astra Agro Lestari Tbk. (Dalam Jutaan Rupiah) (cont.).
Tahun NOPAT IC WACC CC EVA Keter
an
g
an
9. PT. London Sumatra Indonesia Tbk
2015 700.383 8.277.630 7,70% 637.378 63.005 Positif
2016 677.314 8.678.461 6,94% 602.285 75.029 Positif
2017 851.161 9.328.123 8,52% 794.756 56.405 Positif
10. PT. PP (Persero)
2015 1.211.141 8.388.500 8,79% 737.349 473.792 Positif
2016 1.557.575 15.350.287 4,97% 762.909 794.666 Positif
2017 2.377.106 21.082.966 5,63% 1.186.971 1.190.135 Positif
11. PT. Semen Indonesia (Persero)Tbk
2015 5.209.899 31.553.929 13,25% 4.180.896 1.209.003 Positif
2016 4.713.462 36.075.310 10,61% 3.827.590 885.872 Positif
2017 2.553.818 40.159.926 4,95% 1.987.916 565.902 Positif
12. PT. Summarecon Agung Tbk
2015 1.550.446 14.384.576 7,49% 1.077.404 473.042 Positif
2016 1.181.456 16.592.948 4,82% 799.780 381.676 Positif
2017 1.106.437 15.386.884 4,22% 649.327 457.110 Positif
13. PT. Sawit Sumbermas Sarana Tbk
2015 708.582 5.677.280 9,5% 539.342 162.240 Positif
2016 828.360 5.848.392 1,06% 61.993 766.367 Positif
2017 1.134.126 8.501.257 1,14% 96.914 1.037.212 Positif
14. PT. Telekomunikasi Indonesia (Persero)
2015 25.940.000 130.760.000 15,21% 19.888.596 6.051.404 Positif
2016 32.627.000 139.939.000 17,86% 24.993.105 7.633.895 Positif
2017 35.834.000 153.108.000 17,68% 27.069.494 8.764.506 Positif
15. PT. United Tractors Tbk
2015 2.862.982 43.435.114 4,60% 1.998.015 864.967 Positif
2016 5.192.467 45.635.281 8,08% 3.687.331 1.505.136 Positif
2017 7.837.307 53.885.531 9,47% 5.102.960 2.734.347 Positif
16. PT. Unilever Indonesia
2015 5.972.332 5.602.403 42,95% 2.406.232 3.566.100 Positif
2016 6.533.916 4.704.391 38,80% 1.825.304 4.708.612 Positif
2017 7.132.244 6.374.109 34,71% 2.212.453 4.919.791 Positif
17. PT. Wijaya Karya Tbk
2015 1.134.414 8.464.872 5,14% 435.094 699.320 Positif
2016 1.585.025 16.490.377 4,73% 779.995 805.030 Positif
2017 2.034.052 19.708.157 3,93% 774.531 1.259.521 Positif
Sumber: Data sekunder (diolah)
Keterangan:
NOPAT: Net Operatimg Profit After Tax
IC : Invested Capital
WACC: Weighted Average Cost of Capital
CC : Capital Charges
EVA: Economic Value Added
MIICEMA 2019 - Malaysia Indonesia International Conference on Economics Management and Accounting
644
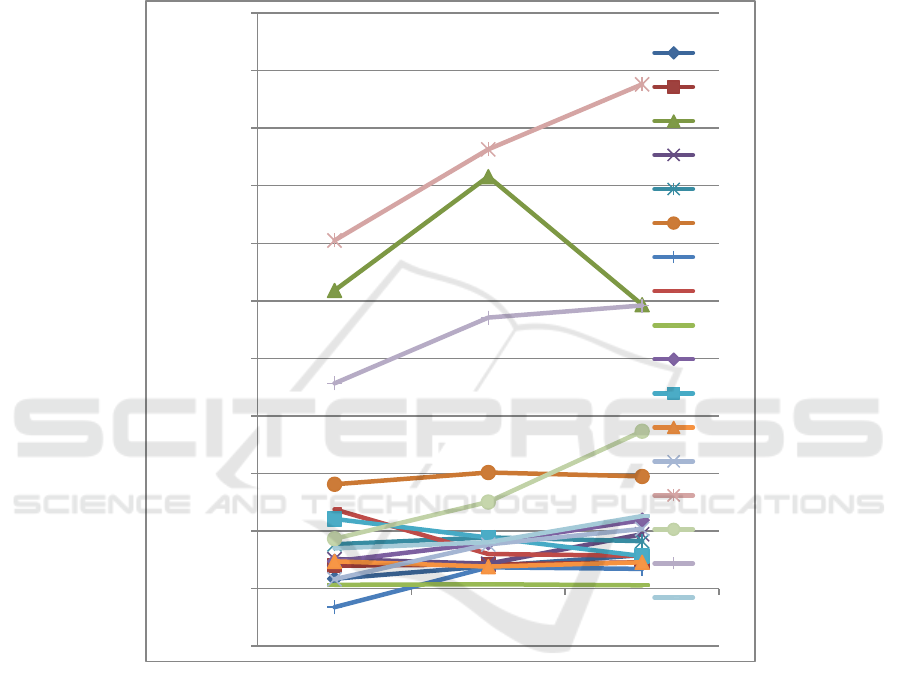
4.2 Disscussion
Based on the calculation of research and the previous analysis, generally can be known
that the EVA ‘s value in listed company at Jakarta Islamic Index (JII) period 2015 until
2017 were different and fluctuated every year. Below will be presented the chart of
EVA’s result comparison from each company.
Source: Secondary data (processed data)
Fig. 2. EVA’s value from each company that listed in JII period 2015-2017 (In million rupiahs).
Based on figure 2 is known that from 17 companies that was used as research data, 16
companies were fluctuated and always had positive value of EVA which means that
company had good financial performance, because they created Economic Value
Added for company and guarantee return rate to stakeholder. The 16 companies were
PT. AKR Corporindo Tbk, PT. Astra International Tbk, PT. Bumi Serpong Damai Tbk,
PT. Indofood CBP Sukses Makmur Tbk, PT. Indofood Sukses Makmur, PT. Lippo
Karawaci Tbk, PT. London Sumatra Indonesia Tbk, PT. PP (Persero) Tbk, PT. Semen
Indonesia Tbk, PT. Summarecon Agung Tbk, PT. Sawit Sumbermas Sarana Tbk, PT.
Telekomunikasi Indonesia (Persero) Tbk, PT. United Tractors Tbk, PT. Unilever
‐1000000
0
1000000
2000000
3000000
4000000
5000000
6000000
7000000
8000000
9000000
10000000
2015 2016 2017
AALI
AKRA
ASII
BSDE
ICBP
INDF
KLBF
LPKR
LSIP
PTPP
SMGR
SMRA
SSMS
TLKM
UNTR
UNVR
WIKA
Analysis of Financial Performance Assessment using Economic Value Added (EVA) Method in Listed Company at Jakarta Islamic Index
645

Indonesia Tbk, and PT. Wijaya Karya Tbk. Meanwhile only one company,PT. Kalbe
Farma Tbk that had negative value of EVA in one research year, in 2015. This result
showed in that year the company had bad financial performance, because didn’t able to
create Economic Value Added for company yet and guarantee the stakeholders.. EVA
had negative value due to the value of Capital Charges that was higher than NOPAT’s
company, so EVA’s value will be positive if the value of NOPAT is higher than the
value of Capital Charges.
The decreasing of NOPAT’s company is caused by the decreasing of profit before
interest and tax. This thing influenced through EVA’s value, where the high value of
NOPAT will can cover the cost of capital that already invested , so that able to create
Value Added for company.
After seeing chart of EVA’s value from each company, it will be presented the rank
table of EVA’s Value from 17 companies that listed in JII on 2015 until 2017 period.
Table 2. The Rank of EVA’s result from 17 companies.
Company Code
EVA (2015-2017 Period)
In million rupiahs
Rank
TLKM 7.487.268 1
ASII 5.578.201 2
UNVR 4.398.168 3
INDF 1.926.039 4
UNTR 1.701.486 5
WIKA 921.290 6
SMGR 886.926 7
LPKR 848.591 8
ICBP 827.546 9
PTPP 819.531 10
SSMS 655.276 11
BSDE 629.863 12
SMRA 437.276 13
AKRA 423.457 14
AALI 380.167 15
KLBF 129.574 16
LSIP 64.813 17
Source : Secondary Data (Proccessed Data)
Based on the table 2 shows that the company with best value of EVA was PT.
Telekomunikasi Indonesia (Persero) Tbk, with average of EVA’s value from three
years research was Rp 7.483.268.000.000,00, showed that PT. Telekomunikasi
Indonesia (Persero) Tbk as the company with the best financial performance. This thing
was in line with the research by Dwi Lestari Wuryaningsih and Rinda Safitri (2014)
entitled” Pengukuran Kinerja Keuangan Menggunakan Rasio Keuangan dan
Economic Value Added (EVA) Studi Kasus pada Perusahaan PT. Telkom Indonesia
Tbk yang Terdaftar di Bursa Efek Indonesia Periode 2008-2012”, showed that the
performance of PT. Telkom Indonesia Tbk was in well condition, because EVA had
MIICEMA 2019 - Malaysia Indonesia International Conference on Economics Management and Accounting
646

positive value. The positive value of EVA showed that the company was able to give
value added for company and also able to fulfill the expectation of stakeholder.
The second highest rank was PT. Astra Internasional Tbk with the average of
EVA’s value was Rp 5.578.201.000.000,00. the third rank by PT. Unilever Indonesia
Tbk with the average of EVA’s value was Rp 4.398.168.000.000,00. the fourth rank
was PT. Indofood Sukses Makmur Tbk with the average of EVA’s value was Rp
1.926.039.000.000,00. The fifth rank was PT. United Tractors Tbk with the average of
EVA’s value was Rp 1.701.486.000.000,00. The sixth rank was PT. Wijaya Karya Tbk
with the average of EVA’s value was Rp 921.290.000.000,00. The seventh rank was
PT. Semen Indonesia (Persero) Tbk with the average of EVA’s value was Rp
886.926.000.000,00. The eighth rank was PT. Lippo Karawaci Tbk with the average of
EVA’s value was Rp 848.591.000.000,00. The ninth rank was PT. Indofood CBP
Sukses Makmur Tbk with the average of EVA’s value was Rp 827.546.000.000,00.
The tenth rank was PT. PP (Persero) Tbk with the average of EVA’s value was
Rp 819.531.000.000,00. The eleventh rank was PT. Sawit Sumbermas Sarana Tbk with
the average of EVA’s value was Rp 655.276.000.000,00. The next rank was PT. Bumi
Serpong Damai Tbk with the average of EVA’s value was Rp 629.863.000.000,00. The
next rank was PT. Summarecon Agung Tbk with the average of EVA’s value was Rp
437.276.000.000,00. The next rank was PT. AKR Corporindo Tbk with the average of
EVA’s value was Rp 423.457.000.000,00. The next rank was PT. Astra Agro Lestari
Tbk with the average of EVA’s value was Rp 380.167.000.000,00. The next rank was
PT. Kalbe Farma Tbk with the average of EVA’s value was Rp 129.574.000.000,00.
Meanwhile, the company with the lowest rank of EVA’s Value was PT. London
Sumatra Indonesia Tbk, with the average of EVA’s value in three years research was
Rp 64.813.000.000,00.
4.3 Conclusion
1. The result of calculation and analysis that already performed showed that all of the
listed company in Jakarta Islamic Index (JII) had a good financial performance.
This thing can be seen from 17 companies that used as object of the research during
three research years, 2015 until 2017, 16 companies had EVA’s Value that always
positive although the value was upside down and only one company that had
negative value in one of research year was PT. Kalbe Farma Tbk ins 2015.
2. Based on the list rank of EVA ‘s value that had been made, it can be seen that PT.
Telekomunikasi Indonesia (Persero) Tbk had the best financial performance,
because had the highest average of EVA’s value for three research years.
Meanwhile, PT. London Sumatra Indonesia was the lowest rank of EVA’s value.
On the other side, from 17 companies that were used as the research object, all of
them had the positive EVA ‘s average value .That means although the amount were
different but all of the company already been able to create the Economic Value
Added.
Analysis of Financial Performance Assessment using Economic Value Added (EVA) Method in Listed Company at Jakarta Islamic Index
647

5 Research Limitation
3. Lack of deep discussion about the analysis of financial performance using EVA.
4. Period of research just only three years, 2015 until 2017.
5. The research only limited in JII’s index.
5.1 Suggestion
1. For company that already able to produce positive EVA’s value and always increase
every year, needs to keep the performance, and for the company that always
decrease EVA’s value even negative is expected to be able to increase the
performance through operating cost and (cost of capital) in order to achieve positive
EVA’s value every year.
2. For investor, based on the purpose of investing fund that is for getting the high
return rate, so it is expected that investors can filter which company will be chosen,
especially the company with positive EVA’s value. And always increase every year.
3. For the next researcher, it is expected to examine further this research by deeping
on theory in different study case.
5.2 The Implication of Research Result
1. The result of EVA can be used by investor as consideration in choosing company
that will give return rate, because this method is very accurate in measuring good
or bad the financial performance of company that listed in JII.
2. The rank list of EVA’s value had already made can be used by company as reference
for increasing the performance in producing the Economic Value Addes so that
become the best.
3. This research can give contribution for science that EVA’s method can be used to
assess the company performance that listed in JII.
References
Alimudin, Arasy. (2017). Analisis Pencapaian Strategi Menggunakan Balance Scorecard. Jurnal
Pendidikan Ekonomi dan Bisnis. Vol 5. No 2.
Damanik, Yessy Kartika, Nengah Sudjana, MG Wi Endang NP. (2016). Analisis Pengukuran
Kinerja Perusahaan dengan Metode Balance Scorecard untuk Menilai Tingkat Kesehatan
BUMN (Studi pada PT. PLN (Persero) Area Pelayanan dan Jaringan Malang Periode 2013-
2015). Jurnal Administrasi dan Bisnis. Vol 35. No 2.
Dewi, Meutia. (2017). Penilaian Kinerja Keuangan Perusahaan dengan Menggunakan Metode
EVA (Economic Value Added) (Studi Kasus pada PT Krakatau Steel Tbk Periode 2012-
2016). Jurnal Manajemen Keuangan. Vol 6. No 1.
Erwin, Hartiwi Prabowo. (2015). Analisis Pengukuran Kinerja Menggunakan Metode Balance
Scorecard pada PT Bahtera Utama. Binus Business Revier. Vol 6. No 1.
Eugene, B., dan Hauston J. 2001. Manajemen Keuangan Edisi Delapan. Jakarta: Erlangga.
Fahmi, Irham. 2017. Analisis Laporan Keuangan. Bandung: Alfabeta
MIICEMA 2019 - Malaysia Indonesia International Conference on Economics Management and Accounting
648

Hanafi, M., dan Halim A. 2009. Analisis Laporan Keuangan Edisi Keempat. Yogyakarta: UPP
STIM YKPN.
Hartono, Jogiyanto. 2014. Metode Penelitian Bisnis Edisi 6. Yogyakarta: Universitas Gadjah
Mada.
Hery, S.E.,M.Si. 2012. Analisis Laporan Keuangan. Jakarta: PT Bumi Aksara.
Hidayat, Rachmad. (2008). Perspektif Balance Score-Card dalam Pengukuran Produktivitas
Organisasi. Jurnal Ekuitas. Vol 12. No 2.
Hidayati, I.W., N.D. (2015). Analisis Economic Value Added (EVA) dan Financial Value Added
(FVA) Sebagai Salah Satu Alat Ukur Kinerja Keuangan Perusahaan. Jurnal Administrasi dan
Bisnis. Vol 25. No 2.
Inayati, T., Subroto, B., Fachan, A., Djazuli, A. (2014). Analyzing Islamic Micro Finance
Performance With Economic Value Added (EVA): Learning From Baitul Wat Tamwil
(BMT) Usaha Gabungan Terpadu Sidogiri Indonesia. Bussines Management Horizon. Vol 2.
No 29.
Iqbal, M., Hidayat R.R., dan Sulasmiyati S., (2015). Penilaian Kinerja Keuangan Perusahaan
dengan Analisis Rasio Keuangan dan Metode Economic Value Added (EVA) (Studi Pada
PT. Jasa Marga (Persero) Tbk. dan Anak Perusahaan yang Terdaftar di Bursa Efek Indonesia
Periode 2011-2014. Jurnal Admiistrasi dan Bisnis. Vol 25. No 1.
Iramani, R, Erie Febrian. (2005). Financial Value Added: Suatu Paradigma dalam Pengukuran
Kinerja dan Nilai Tambah Perusahaan. Jurnal Akuntansi dan Keuangan. Vol 1. No 1.
Jamkarani, R.G., dan Banafi M. (2017). Sticky of Selling, General and Administrative Expenses:
The Role in Market Value Added and Economic Value Added. International Journal Of
Economic Perspectives. Vol 11. Issue 3.
Karamoy, J., Dolina L Tampi, dan Danny DS Mukuan. (2016). Analisis Economic Value Added
(EVA) pada PT Bank Negara Indonesia Tbk. Jurnal Administrasi dan Bisnis. Vol 4. No 2.
Kasmir. 2014. Analisis Laporan Kuangan Edisi Pertama. Jakarta: PT Rajagrafindo Persada.
Khaddafi, M., dan Heikal M. (2014). Financial Performance Analysis Using Economic Value
Added in Consumption Industry in Indonesia Stock Exchange. American International
Journal of Social Science. Vol 3. No 4.
Murhadi, W.R. 2013. Analisis Laporan Keuangan, Proyeksi dan Valuasi Saham. Jakarta:
Salemba Empat.
Neolaka, A. 2014. Metode Penelitian Dan Statistik. Bandung: PT Remaja Rosdakarya.
Nursiyono, J.A. 2015. Kompas Teknik Pengambilan Sampel. Bogor: In Media.
Nurwahyuni, R., M. Saifi, dan Zahro ZA. (2017). Analisis Rasio Keuangan dan Metode
Economic Value Added (EVA) untuk Menilai Kinerja Keuangan Perusahaan (Studi Kasus
pada PT. Astra Otoparts, Tbk dan PT. Gajah Tunggal Tbk yang Terdaftar di Bursa Efek
Indonesia Periode 2013-2015. Jurnal Administrasi dan Bisnis. Vol 47. No 1.
Prabowo, S.C.B., dan Faculty of Economics and Business. (2017). Financial Performance
Analysis Using Economic Value Added and Market Value Added Method in PT Gudang
Garam Tbk, PT Hanjaya Mandala Sampoerna Tbk and PT Bentoel Internasional Investama
Tbk. Jurnal Aplikasi Manajemen. Vol 15.
Prastowo, D. 2015. Analisis Laporan Kuangan Konsep dan Aplikasi Edisi Ketiga. Yogyakarta:
UPP STIM YKPN.
Riswanto, Anang Yudi, Indupurnahayu, dan Akhmad Bakhtiar Amin. (2018). Implementasi
Konsep Balance Scorecard (BSC) Berbasis Syariah dalam Pengukuran Kinerja. Jurnal
Manajemen. Vol 9. No 1.
Sabol, A., dan Sverer F. (2017). A Review Of The Economic Value Added Literature And
Application. UMTS Journal of Economics. Vol 8. No 1.
Sholahuddin, Muhammad. 2005. Analisis Informasi Keuangan. Surakarta Fakultas Ekonomi
Universitas Muhammadiyah Surakarta.
Sidharta, I., Affandi A. (2016). The Empirical Study On Intellectual Capital Approach Toward
Financial Performance On Rural Banking Sectors in Indonesia. International Journal of
Economics and Financial Issues. Vol 6. No 3.
Analysis of Financial Performance Assessment using Economic Value Added (EVA) Method in Listed Company at Jakarta Islamic Index
649

Sirait, P. 2017. Analisis Laporan Keuangan. Yogyakarta: Ekuilibria.
Subagyo, J. 2015. Metode Penelitian Dalam Teori dan Praktik. Jakarta: PT Rineka Cipta.
Sugiyono. 2015. Metode Penelitian dan Pengembangan Research and Development. Bandung:
Alfabeta.
Sujarweni, W. 2017. Analisis Laporan Keuangan Teori, Aplikasi dan Hasil Penelitian.
Yogyakarta: Pustaka Baru Press.
Suryani, Hendryadi. 2018. Metode Riset Kuantitatif Edisi Kedua. Jakarta: Prenadamedia Group.
Tunggal, Amin Widjaja. 2001. Pengukuran Kinerja Keuangan dengan Balance Scorecard.
Jakarta: Harvarindo.
Wahyu, D.R. 2017. Economic Value Added and Financial Ratio Analysis Implementation On
Tobacco Company. European Journal Business Management. Vol 9. No 6.
Walsh, Ciaran. 2014. Key Management Ratios Edisi Keempat. Jakarta: Erlangga.
Wijaya, Harris Hansa, dan Lauw Tjun Tjun. (2009). Pengaruh Economic Value Added Terhadap
Tingkat Pengembalian Saham pada Perusahaan yang Tergabung dalam LQ-45. Jurnal
Akkuntansi. Vol 1. No 2.
Young, D., dan O’Byrne S. 2001. EVA dan Manajemen Berdasarkan Nilai. Jakarta: Salemba
Empat.
Yusbardini, Y. (2017). Economic Value Added vs Firm Performance. International Journal of
Economic Perspectives. Vol 11. Issue 1.
www.idx.co.id
www.sahamok.com
www.britama.com
MIICEMA 2019 - Malaysia Indonesia International Conference on Economics Management and Accounting
650
