
Analysis of Soil Retaining Wall from Geosynthetic for Sea
Reclamation to Become a New Land in the Beach
Liany Ayu Catherine
1
, Widi Agoes Pratikto
2
, Suntoyo
2
, Johnny Maruli Tua Simatupang
3
and Vivi Bachtiar
3
1
Garduate Student
,
Departement of Ocean Engineering, Sepuluh Nopember Institute of Technology, Surabaya, Indonesia
2
Department of Ocean Engineering, Sepuluh Nopember Institute of Technology, Surabaya, Indonesia
3
Department of Civil Engineering, Tanjungpura University, Pontianak, Indonesia
Keywords: Reclamation, Retaining Wall, Geosynthetic, Geobag.
Abstract: Reclamation is a business to get land that was covered by water into dry land and to be used as useful land in
accordance with its purpose. This reclamation can be carried out on lands that are on the coast, swamps, and
offshore. In this study, land reclamation is intended as a port development area so that land requirements are
in accordance with the port development plan on the coast. The location of this research is in the southern
area of Ketapang Regency, West Kalimantan, which is 18 km from the Ketapang City Center. This regency
does not yet have a coastal port, all of its ports are in the river, which certainly often occurs siltation due to
sedimentation. Land reclamation is carried out to pursue the depth of the waters in accordance with the
berthing of ships to be anchored so that no trestle construction is needed but by reclaiming it, it can save the
cost of building the structure. The research method used in this study, by analyzing wind data as a reference
for wave generation and calculating the wave deformation that occurs, bathymetry data as a reference for
water depth, tidal data is intended as one in the design of the retaining wall height, estimated loading above
the reclamation structure land, and the external forces that occur on the retaining wall. The design of the
retaining wall uses geobags in a stacked manner, has a total height of 6.3 m buildups from sea level to the
deepest seabed and forms a trapezoidal structure with a trapezoid peak width of 5.09 m (3 geobag lines) and
a trapezoid base width 26.47 m (11 lines/stack). The size of Geobag 2 x 1.5 x 0.6 m. Geobag size is obtained
from the calculation of the effect of waves on the geobag structure. So that the weight is determined by the
required volume size and then the size is further reviewed by the effect of soil pressure due to the embankment
for reclamation held by the geobag structure by analysis of overturning, sliding, and bearing capacity
permitted exceeded.
1 INTRODUCTION
1.1 Background
Ketapang Regency is one area that has abundant
natural resource potential, as a support in the
distribution of goods, this area needs a port for goods
and passengers loading and unloading facilities. This
Regency actually has a port on the Pawan River, but
as time goes by, the shipping lanes to and from the
port experience siltation due to sedimentation. This
area needs a new port that is no longer in a river but
on the coast.
Ketapang Regency itself in general has a fairly
long coastline, but to be used as a port with a specific
ship weight needs to be modified beach conditions.
Based on the results of a feasibility study in 2012 with
3 port locations, the selected ones were located in the
southern area of Ketapang Regency (KRTD, 2012)
but in those areas they have shallow water depths, to
obtain appropriate water depths, about ± 1 km from
the shoreline. So in this study, to solve the problem
we use the option to reclamation the portland because
the cost is more economical and materials will be
taken from nearby locations.
In this reclamation, geosynthetic is used as one of
the structural planning materials. Geosynthetic used
is the type of geobag. Geobag is used as a retaining
wall of land reclamation. The geobag material used is
from NAUE Germany whose geobag output material
is SECUTEX®H or SECUTEX® SOFT ROCK
Catherine, L., Pratikto, W., Suntoyo, ., Tua Simatupang, J. and Bachtiar, V.
Analysis of Soil Retaining Wall from Geosynthetic for Sea Reclamation to Become a New Land in the Beach.
DOI: 10.5220/0010287602710280
In Proceedings of the 7th International Seminar on Ocean and Coastal Engineering, Environmental and Natural Disaster Management (ISOCEEN 2019), pages 271-280
ISBN: 978-989-758-516-6
Copyright
c
2021 by SCITEPRESS – Science and Technology Publications, Lda. All rights reserved
271

which is a special fiber nonwoven geotextile for
hydraulic engineering.
1.2 Formulatiom of the Problem
1. How to determine the dimension of retaining
wall?
2. How to determine the dimension of geobag?
3. How does the influence of the stability of the
external forces of the geobag as a retaining wall
of land reclamation?
1.3 Restricting the Problem
1. Land area for land reclamation plan is 372.417,5 m
x 389.011 m
2. Land reclamation location in in the southern area
of Ketapang Regency, West Kalimantan, which is
18 km from the Ketapang City Center
3. Planning a retaining wall in the form of
geosynthetic geobag types using data:
a. Wind data was obtained from BMKG Ketapang
in the years 2004 - 2013
b. Bathymetry data of land reclamation area with
the direct survey to the field as a reference for
water depth
c. Tidal data was obtained from a 15-day field
survey as a reference for the reclamation land
retaining wall height
d. Soil type data were obtained from field samples
and examination tests at the Soil Mechanics
Laboratory, Faculty of Engineering,
Tanjungpura University, as a reference to soil
types in filling geobags
4. Does not calculate the strength of the external
geobag material used
2 THEORY
2.1 Reclamation
Reclamation is a job/business utilizing areas or land
that are relatively useless or still empty and watery
into useful land by draining. For example in coastal
areas, swampy areas, offshore / in the sea, in the
middle of a wide river, or in a lake. Reclamation is
carried out following the procedures since the
planning stages (pre), implementation and
development (process), and its use (post) both above
and or below the reclaimed land (PWD, 2008).
The reclamation of large amounts of land in the
future may be needed to meet the food and adequate
space requirements of the developing population.
Land reclamation for housing, industry, or recreation
requires ecological, hydrological, and geological data
in addition to technical analysis. Geologists can
contribute to the planning of reclamation of
floodplains, wetlands, landmines, and geologically
dangerous areas. Geological data can be used to
predict the environmental impacts deposited by a
reclamation project (McComas, 1972). From a
commercial perspective, reclamations have been used
for airport expansions and new airports as well as port
expansions and new ports. Residential and
recreational developments along waterfronts have
been successfully constructed on reclaimed land
(Duan et al, 2016).
2.2 Retaining Wall
Retaining walls are structures used to provide
stability for earth or other materials at their natural
slopes. In general, they are used to hold back or
support soil banks and water or to maintain a
difference in the elevation of the ground surface on
each of the wall sides. Also, retaining walls are often
used; in the construction of buildings having
basements, roads, or bridges when it is necessary to
retain embankments or earth in a relatively vertical
position. Retaining walls are commonly supported by
soil (or rock) underlying the base slab, or supported
on piles; as in case of bridge abutments and where
water may erode or undercut the base soil as in
waterfront structures.
The conventional retaining walls can be divided
into four types, gravity, semi-gravity, cantilever, and
counterfort retaining walls. Stability analysis of
retaining wall is influenced by loads which burden the
structures. This load in the mechanic analysis can be
known as force. This force mainly can be divided into
two kind, lateral pressure and vertical pressure.
Lateral pressure itself comprises of soil and water
pressure. There are two types of lateral soil pressure,
namely active and passive pressure. The active
pressure commonly located behind the retaining wall
as the slope which wants to retain. On the other hand,
the passive pressure in front of the retaining wall is an
additional force on the retaining wall to maintain the
slope from collapse. If there is no soil in front of the
retaining wall, there will not any passive pressure.
Moreover, the lateral pressure also includes water
pressure if there is water existence in slope.
Furthermore, the vertical pressure of retaining wall
structure is influenced by the load above the slope
(Sari et al, 2020). Design Considerations of Gravity
as follows ; Scope, Limit State Design, Partial
Loading and Material Factors, Load Combinations
ISOCEEN 2019 - The 7th International Seminar on Ocean and Coastal Engineering, Environmental and Natural Disaster Management
272

and Factors for Stability, Load Combinations and
Factors for Strength of Components, Live Loads,
Earthquake Loads, Wind Loads, Hydraulic Loads,
Drained v Undrained Parameters, Capacity Reduction
Factors, Soil Analysis Model, Active Pressure,
Pressure at Rest, Passive Pressure, Bearing Failure,
Sliding Failure, Overturning, Global slip, Foundation
Material, Lean Back (CMAA, 2013)
2.3 Geosynthetic
Geosynthetics can be defined as planar products
manufactured from polymeric material, which
areused with soil, rock, or other geotechnical
engineering-related material as an integral part of a
manmade project, structure, or system. Geosynthetics
are widely used in many geotechnical, environmental,
and hydraulic applications related to groundwater
quality and control. Geosynthetic types include ;
Geotextiles, Geomembranes, Geogirds, Geosynthetic
Clay Liners, Geocomposite Sheet Drains,
Geocomposite Strip (Wick) Drains, Geocells.
(Zornberg and Christopher, 2007).
NAUE geosynthetic is geosynthetic materials
from Germany (NAUE, 1967). The innovations of
NAUE are leading the geosynthetic industry into the
future. We offer project-specific product
development, geotechnical engineering support, and
provide solutions to complicated challenges,
simplifying your project. Geosynthetic types, among
others:
- Geosynthetic Clay Liner Bentofix® – the
“Bentonite liner”
- Secutex® multifunctional geotextile
- Geomembrane CARBOFOL® the HDPE liner
- Secugrid® geogrids for soil stabilisation and
reinforcement
- Combigrid® geogrids with integrated nonwoven
geotextile component
- Secumat® erosion control mat
- SECUDRAIN® WD
- SECUTEX® SOFT ROCK
2.4 Geobag
Geotextile bag or geobag, a geosynthetic product
made of polyester; polypropylene or polyethylene has
been used world wide for protecting riverbanks and
hydraulic structures from severe scouring and
erosion. The use of sand filled geobags underwater in
erosion protection work is being popular due to its
cost-effectiveness, availability, and easier
implementation. Some recent studies support that its
technical efficiency is similar or sometimes better
than the use of hard material (Wahed et. al, 2011).
A durable and effective alternative is a scour
protection system with sand-filled geotextile
containers Secutex® Soft Rock. The dynamic
interaction between waves and waterfront soils and
structures complicates hydraulic engineering.
Beachfront requires longterm protection, and the
solutions must be flexible, durable, and minimize the
impact on marine environments. Lightweight, robust
nonwoven geotextiles enable these engineered
installations to encapsulate sand (including local fill)
for the creation of long-term performing bags,
containers, and tubes. The impact of a sand container
solution made of Secutex® Soft Rock with respect to
the lifecycle consideration is only a fraction of the
impact of a conventional solution in an offshore
scours protection system. Secutex® nonwovens are
filter-stable and extremely robust. A special two-
layered nonwoven composite is available, which
features an integrated surface protection layer made
from rough fibers for exposed or covered designs.
The available sizes and mass per unit area of
Secutex® nonwoven geotextile containers enable
flexibility in infill selection and installation methods.
Bag size and arrangement depending on the
application and expected hydrodynamic conditions.
Secutex® Soft Rock standard design approaches are
available. Secutex® Soft Rock Applications:
- Sea walls, beach and dune revetments
- Groynes
- Submerged breakwaters and jetties
- Scour protection for waterfront structures, walls,
bridge piles andoffshore wind turbines
- Offshore cable protection
- Erosion control in flowing waters
- Filling of washed out material in dams
- Soil stabilisation in dams (NAUE, 1967)
3 METHOD
1. Analyze wind data on land from BMKG of
Ketapang Regency Airport:
a. Calculate wind speed at 10 m elevation
U
U
/
(1)
b. Calculate the wind factor
c. Calculates the percentage of wind direction
and is made into windrose
d. Calculating Wind Tension Factor
Analysis of Soil Retaining Wall from Geosynthetic for Sea Reclamation to Become a New Land in the Beach
273

The wind tension produces a wave
generator at sea with a comparative
approach to existing wind data on land
(converting wind on land to wind at sea):
U
0,71U
,
(2)
e. Calculating Effective Fetch (Feff)
F
∑
∑
(3)
where :
F
eff
= Fetch average effective
X
i
= the length of the fetch segment
measured from the wave observation
point to the final of the fetch
α = deviation on both sides of the wind
direction, using an increase of 6
0
to an
angle of 42
0
on both sides of the wind
direction
f. Calculate the wind reset period
g. Calculate periods and wave heights in the
deep sea
2. Analyze Wave Deformation
a. Calculate the value of H
0
Determine H
0
based on Hs obtained from
previous calculations.
b. Calculate wave period (T)
Determine the Period (T) also based on
previous calculations that have been
carried out a repeat period with the
approximating method
c. Calculate the length of a wave in the deep
sea (L
0
)
L
1,56T
(4)
d. Calculate the value of the coefficient of
refraction (Kr)
K
(5)
e. Calculate the value of the Shoaling
coefficient (Ks)
K
.
(6)
f. Calculate wave height (H’
0
)
H
K
.K
.H
(7)
The concept of sea wave height in this
equivalent is used in the analysis of
breaking waves which include the height
and depth of the breaking waves
g. Calculate the slope of the seafloor (m)
m
(8)
where :
s = distance from deep shoreline
d = deep sea
h. Calculate the breaking wave height and
depth on formula and graphs
H
,
(9)
3. Analyze the average high and low tide for 15 days
and plot it into the elongated figure, according to
the area of land and the depth of the waters from
the bathymetry survey results.
4. Analyzing load on land reclamation
5. Analyzing the dimensions of the geobag
a. The weight of the geobag content, using the
calculation of the stability of the protective
stone with the Hudson formula
b. The geobag dimension uses the volume
weight formula with a trial and error
process
Wall height is known from the depth of
the waters to be reclaimed to the height of the
original land. The slope of the retaining wall is
adjusted to the determination of the contents
of the geobag grains against waves. Geobag
heaps from the bottom of the waters to the
height of the plan. Can be the width of the top
(a) and bottom width (B), the retaining wall of
the soil. Apply to AutoCAD to make it easier
to adjust the installation/stacking of geobags.
6. Analyzing Soil Pressure around the site
a. Calculate the coefficient of active soil
pressure (Ka)
(Bachtiar, 2010) :
K
tan
45
ф
2
(10)
b. Calculate soil pressure due to load on the
structure
σq.K
(11)
c. Calculate soil pressure without ground
water level
σγ
.H.K
(12)
ISOCEEN 2019 - The 7th International Seminar on Ocean and Coastal Engineering, Environmental and Natural Disaster Management
274
d. Calculate soil pressure for ground water
level
σγ
.H.K
(13)
e. The active forces on retaining walls:
1. Due to the load on the structure
(distributed load)
P
H.σ (14)
2. Due to the presence and absence of
ground water level
P
H.σ (15)
f. The force center point:
1. Due to the load on the structure
(distributed load)
(17)
2. Due to the to the presence and absence
of ground water level
(18)
g. Calculate the height and distance at each
midpoint of each geobag layer from the
base to the top and determine the number
of geobags of each layer.
h. Calculate each force in each layer, in each
plane due to soil pressure. The force due to
the load on the structure (distributed load)
FP
(19)
7. Analyze the stability of external forces (Bachtiar,
2010) :
a. Overturning
FS
∑
∑
2 (20)
b. Sliding
FS
∑
∑
1,5 (21)
c. Bearing Capacity Failure
FS
3 (22)
4 RESULT AND DISCUSSION
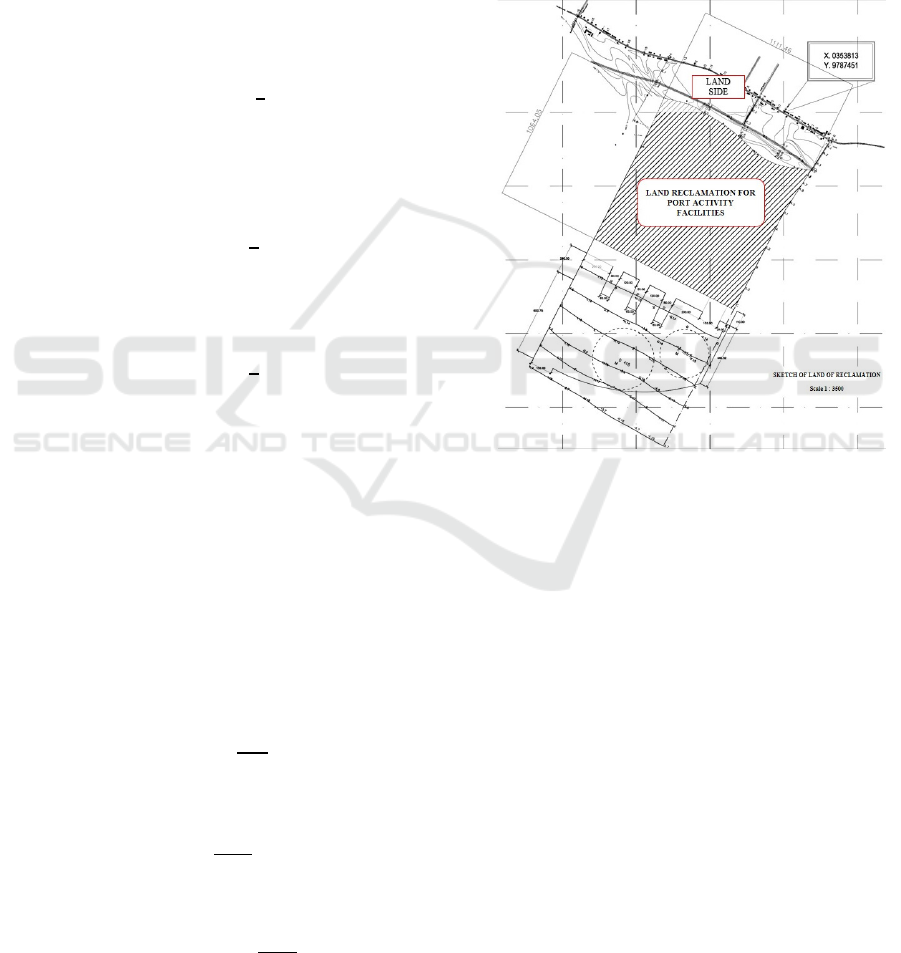
The results of the image as an area that will be
reclamation in the form of breadth and depth of water.
The area to be reclamation is adjusted to the land plan
for multipurpose buildings, warehouses, offices and
container land, which is 37,241, 75 m x 38,885 m. The
depth of the waters at the far end of the land area is
approximately 6 m below the highway elevation.
(Figure 1)
Figure 1: Land Reclamation Plan.
4.1 Wind Data
Analysis of wind data on land from BMKG Ketapang
Airport with a height of 9 m above sea level. In
planning structures at sea must use wind data above
the sea. Therefore, the data is reprocessed to get the
largest wind speed direction in the percentage scale,
effective fetch, period, and wave height from the deep
sea (Figure 2).
Analysis of Soil Retaining Wall from Geosynthetic for Sea Reclamation to Become a New Land in the Beach
275
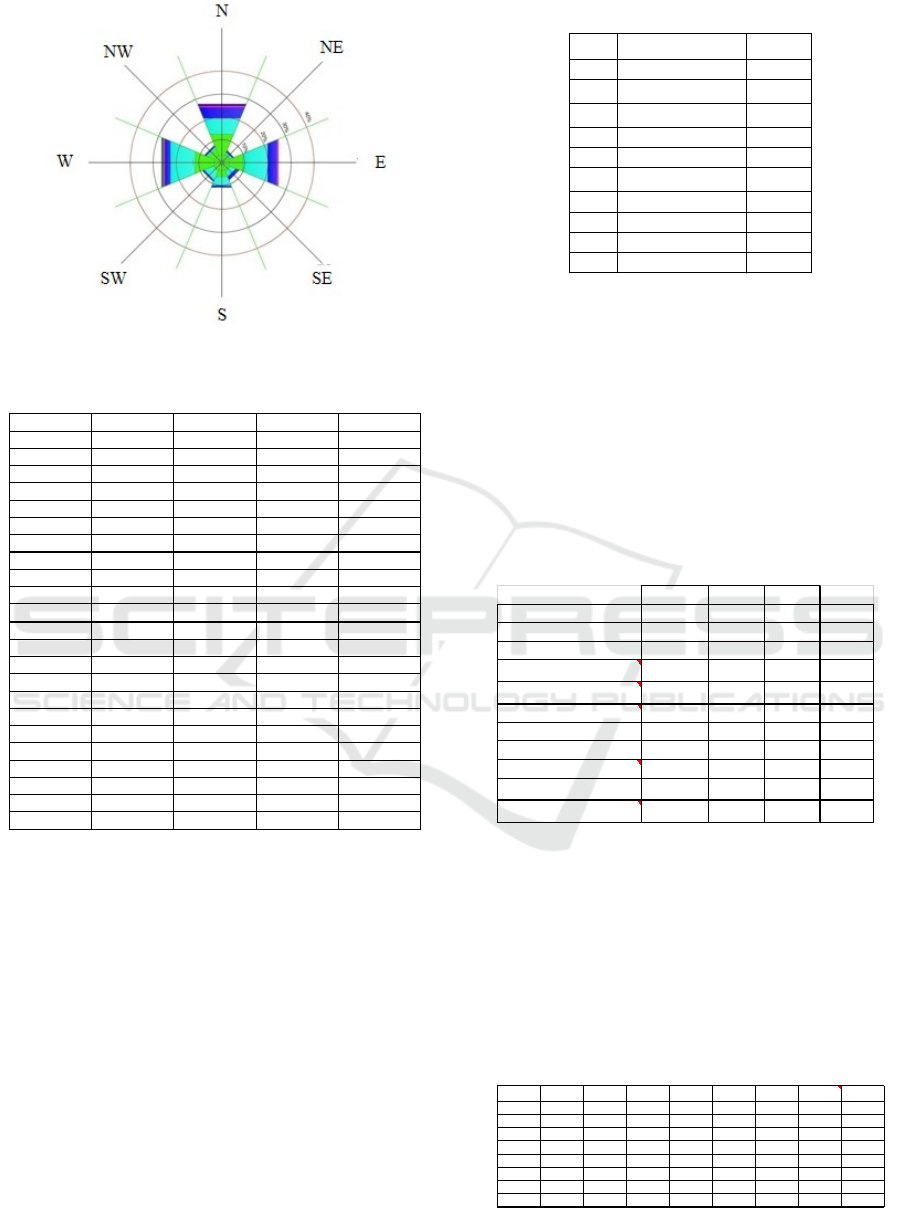
Figure 2: Windrose.
Table 1: Percentage of Speed and Direction of Wind.
So, the biggest wind direction comes from the West
by 25%, after that from the north and east by 24.17%
as given in Table 1 and Figure 2).
Measurement of wind data is carried out on land
at the airport. The measurement of the wind is not yet
suitable for wave forecasting, then the wind data
needs to be corrected. After that, it is converted into a
wind stress factor every year as given in Table 2.
Table 2: Wind Tension Factor Average (knots).
The determination of waves with certain return
periods requires wave data in a long enough
measurement period. Representative data for several
years of wind observation can be used to estimate the
expected wave is equaled or exceeded once in T years
and the wave is known as the return wave period, T
or annual wave period , T (Pratikto et al., 2014). There
are 3 methods used to calculate the wave return
period, namely Normal, Gumbell and Log Person
distribution as given in Table 3.
Table 3: Wave Return Period.
4.2 Wave Deformation
Calculation of wave deformation is done to get the
wave breaking from the deep waters towards to the
shoreline, the calculation results is given in Table 4,
Table 5 and Table 6 for the 2 years, 5 years and 10
years return periode prediction, respectively.
Table 4: Wave deformation calculation results for the 2
years wave return period.
Direction North North East East South East
0 - 10 0,00% 0,00% 0,00% 0,00%
10 - 20 10,00% 0,83% 6,67% 0,83%
20 - 30 7,50% 0,83% 11,67% 2,50%
30 - 40 5,00% 0,83% 4,17% 1,67%
40 - 50 0,83% 0,00% 0,83% 0,00%
50 - 60 0,00% 0,00% 0,00% 0,00%
60 - 70 0,00% 0,00% 0,00% 0,00%
70 - 80 0,00% 0,00% 0,00% 0,00%
80 - 90 0,00% 0,00% 0,00% 0,00%
90 - 100 0,83% 0,00% 0,83% 0,00%
Σ 24,17% 2,50% 24,17% 5,00%
South South West West North West Σ
0,00% 0,00% 0,00% 0,00% 0,00%
3,33% 0,83% 9,17% 3,33% 35,00%
4,17% 4,17% 11,67% 0,83% 43,33%
0,83% 0,83% 2,50% 0,83% 16,67%
0,00% 0,00% 0,83% 0,00% 2,50%
0,00% 0,00% 0,00% 0,00% 0,00%
0,00% 0,00% 0,00% 0,00% 0,00%
0,00% 0,00% 0,83% 0,00% 0,83%
0,00% 0,00% 0,00% 0,00% 0,00%
0,00% 0,00% 0,00% 0,00% 1,67%
8,33% 5,83% 25,00% 5,00% 100,00%
No Year X (U
A
)
1 2004 25,02
2 2005 23,32
3 2006 35,92
4 2007 20,32
5 2008 19,91
6 2009 23,87
7 2010 27,83
8 2011 22,00
9 2012 30,65
10 2013 27,28
2 year 5 year 10 year
Normal 25,61 29,78 31,96 Knots
Gumbell 4,27 9,99 13,78 Knots
Log Person Type III 16,04 3,04 1,72 Knots
Average (U
A
) 15,31 14,27 15,82 Knots
Average (U
A
) 7,87 7,33 8,13 m/d
Duration 4 4 4 jam
Wave Height (Hs) 0,65 0,59 0,68 m
Wave Period (T) 3,75 3,55 3,75 s
Fetch 27 26 27 km
Wave Length (L
0
) 21,97 19,69 21,97 m
d/L
0
0,8194 0,9143 0,8194 m
d(m) H
0
(m) T(s) L
0
(m) Kr Ks H
0
'(m) m(slope)
H
0
'/gT
2
20 0.65 3.75 21.98 1.00 1.00 1.54 0.001 0.011
18 0.65 3.75 21.95 1.00 1.00 0.65 0.093 0.005
16 0.65 3.75 21.91 1.00 1.00 0.65 0.074 0.005
14 0.65 3.75 21.86 1.00 1.00 0.65 0.056 0.005
12 0.65 3.75 21.78 1.00 0.99 0.65 0.186 0.005
10 0.64 3.75 21.61 1.00 0.98 0.65 0.048 0.005
8 0.62 3.75 21.24 0.99 0.95 0.65 0.053 0.005
6 0.59 3.75 20.39 0.98 0.90 0.65 0.085 0.005
ISOCEEN 2019 - The 7th International Seminar on Ocean and Coastal Engineering, Environmental and Natural Disaster Management
276
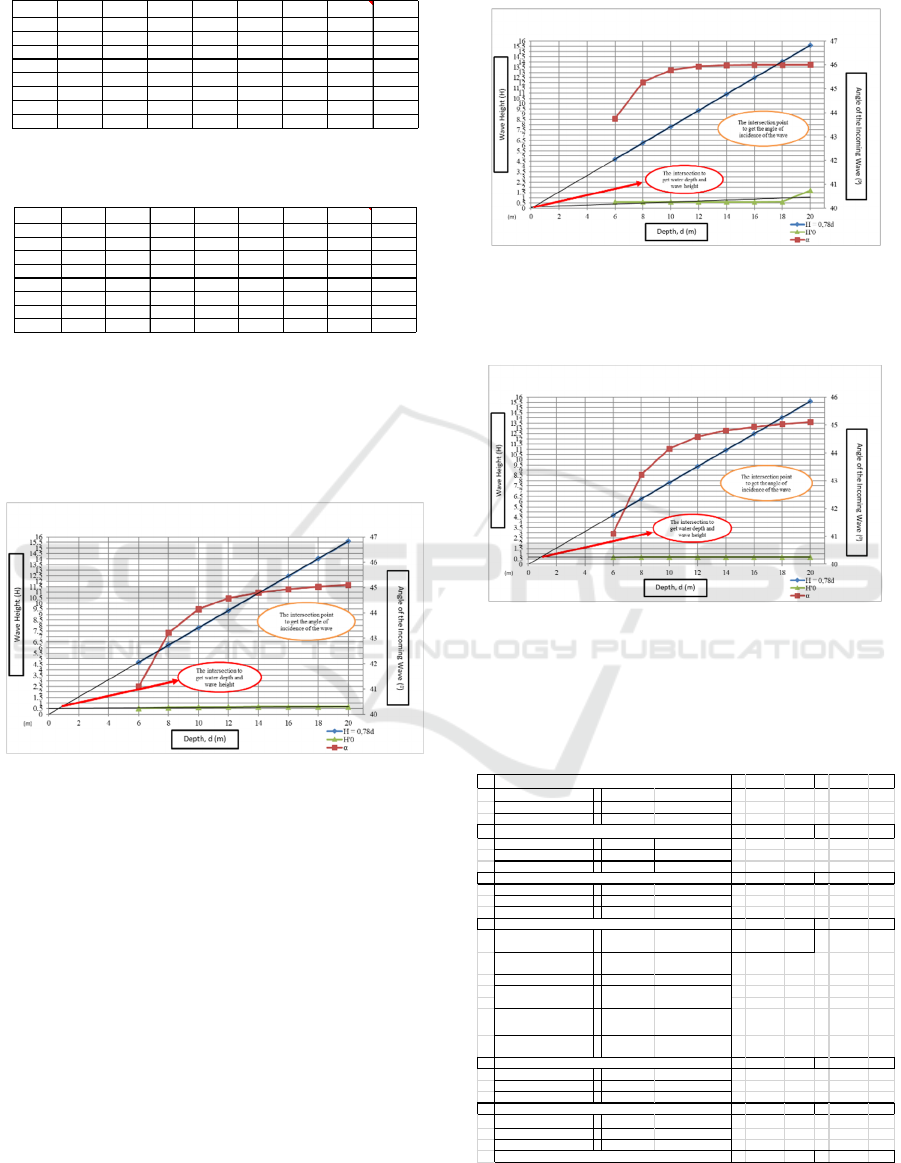
Table 5: Wave deformation calculation results for the 5
years wave return period.
Table 6: Wave deformation calculation results for the 10
years wave return period.
The wave deformation analysis involved the shoaling,
the refraction and the breaking waves. Then, the
relationship among the deep-sea wave height (H'
0
),
the incident angle of the wave (α), and the wave
height in the deep sea (H = 0.78d) is used to determine
the breaking wave.
Figure 3: The relationship among the deep-sea wave height
(H'0), the incident angle of the wave (α), and the wave
height in the deep sea (H = 0.78d) for the 2 years of wave
return period.
Figure 3 showed the results of the conditions in which
waves propagate from the deep sea and break with
wave height approaching the coastline, producing a
value; sea depth (d) = 0,7 m, wave height (H
0
') = 0,5
m and angle of the incident wave (α) = 42
0
for the 2
years of wave return period.
For the 5 years of wave return period prediction
condition, waves propagate from the deep sea and
break with wave height approaching the coastline
within the water depth (d) = 0,2 m, wave height (H
0
') = 0,2 m and angle of the incident wave (α) = 46
0
,
while within the water depth (d) = 0,9 m, wave height
(H
0
') = 0,6 m and angle of the incident wave (α) =
42,5
0
, for the 5 years of wave return period prediction
condition as given in Figure 4 and Figure 5,
respectively.
Figure 4: The relationship among the deep-sea wave height
(H'0), the incident angle of the wave (α), and the wave
height in the deep sea (H = 0.78d) for the 5 years of wave
return period.
Figure 5: The relationship among the deep-sea wave height
(H'0), the incident angle of the wave (α), and the wave
height in the deep sea (H = 0.78d) for the 10 years of wave
return period.
Table 7: The calculation results of the structural load on the
reclamation area.
Source of Value : (ILRB, 1983)
d(m) H
0
(m) T(s) L
0
(m) Kr Ks H
0
'(m) m(slope)
H
0
'/gT
2
20 0.59 3.55 20.00 1.01 1.01 1.71 0.001 0.014
18 0.60 3.55 20.00 1.00 1.00 0.60 0.093 0.005
16 0.60 3.55 20.00 1.00 1.00 0.60 0.074 0.005
14 0.60 3.55 19.99 1.00 1.00 0.60 0.056 0.005
12 0.60 3.55 19.98 1.00 1.00 0.60 0.186 0.005
10 0.60 3.55 19.93 1.00 0.99 0.60 0.048 0.005
8 0.59 3.55 19.76 1.00 0.97 0.61 0.053 0.005
6 0.57 3.55 19.22 0.99 0.92 0.62 0.085 0.005
d(m) H
0
(m) T(s) L
0
(m) Kr Ks H
0
'(m) m(slope)
H
0
'/gT
2
20 0.68 3.75 21.98 1.00 1.00 0.68 0.001 0.005
18 0.68 3.75 21.95 1.00 1.00 0.68 0.093 0.005
16 0.68 3.75 21.91 1.00 1.00 0.68 0.074 0.005
14 0.67 3.75 21.86 1.00 0.99 0.68 0.056 0.005
12 0.67 3.75 21.78 1.00 0.98 0.68 0.186 0.005
10 0.65 3.75 21.61 1.00 0.96 0.68 0.048 0.005
8 0.63 3.75 21.24 0.99 0.93 0.67 0.053 0.005
6 0.58 3.75 20.39 0.98 0.88 0.66 0.085 0.005
1
=6,58 kg/m2
=
2,70 kg/m
A
=
33,44 m2
W = 30,48 kg
Wide = 2,44 m
2 = 1.818,2 kg/m2 = 661,16 kg/m
A = 24,75 m2
W= 45.000 kg
Wide = 2,75 m
3 = 2.376 kg/m2 = 410,35 kg/m
A = 33,52 m2
W= 79.650 kg
Wide = 5,79 m
4 = 3.050 kg/m2 = 3.050 kg/m
Live Load of Office Floor
(@3 tingkat)
=
250
kg/m2
=750 kg/m2
Live Load of Floor and
Meeting Room
=
400 kg/m2
Live Load of Ladder = 300 kg/m2
Live Load Parking Floor
Building Lower
=
800 kg/m2
Live Load Parking Floor
Building Level Other
=
400 kg/m2
5 = 167,80 kg/m2 = 1.598,10 kg/m
A = 0,02 m2
W = 3,70 kg
Wide = 0,11 m
6 = 91,06 kg/m2 = 0,09 kg/m
γsand = 1.517,72 kg/m3
Thick of Heap = 0,06 m
Wide of Land Heap = 1.061,00 m
= 8.259,53 kg/m2 = 5.722,39 kg/m
TOTAL
Live Load of Container Truck 45 ( W=45000kg, A = 2,75 x 9,0 m2)
Live Load of Container 6 @30,480 kg (uk.13,716 x 2,438 m2)
Live Load off Mobile Crane (W=79560 kg, A=5,79 x 5,79 m2)
Live Load of Building S tructure
Dead Load of Paving Block (Rectangle 10x10,5x21, W =3,7kg)
Dead Load for Heap Sand Paving Block
Live Load of Warehouse,
Tools Room and Archive
=400 kg/m3
Analysis of Soil Retaining Wall from Geosynthetic for Sea Reclamation to Become a New Land in the Beach
277
4.3 Tidal
Based on the tidal observations data, it can be
obtained the characteristics of water level in the form
of a formzal value related to the highest tides and
lowest tides that occur. The elevation of the original
land in the form of a highway is used as a benchmark
for an elevation of 0.00 meters. From the tide
analysis, it is obtained that the higest water level is -
1.00 m and the lowest water level is -3.20 m. So that
the height of the reclamation pole can be planned to
be parallel to or higher than the elevation of the
highway because the highest tidal elevation is still 1
meter below the road elevation.
4.4 Load
This reclaimed land will be used as land for the
construction of containers, offices, warehouses and
passenger waiting rooms. In planning for the
construction of the structure, a total load on the soil is
required so that the structure does not collapse. The
structural load planning to be built on the reclamation
area is given in Table 7.
4.5 Geobag
The geobag material used is the German NAUE type
Secutex® Soft Rock (NAUE, 1967). To determine
the dimensions of the geobag, the type of soil used to
fill into the geobag should be known in advance. In
this paper, the type of soil is given in Table 8 obtained
from the laboratory analysis of Soil mechanics
laboratory belong to Engineering Faculty,
Tanjungpura University. After that, the grain weight
of the geobag is calculated using the stability of the
protective stone.
Table 8: Type of soil.
A classic formula for the stability of rocks/stones
under breaking waves at a sloping surface is given by
the Hudson formula. The weight of geobag grain
content calculation steps are given, as follows:
1. γ
r
, obtained from the density of geobag fillers,
namely the type of soil (sand) on the seabed. The
data was obtained from the laboratory, which is
1,517.72 kg / m
3
2. γ
a
, obtained from the specific gravity of seawater
1.025 kg/m
3
3. H, is the wave height of the plan
4. K
D
, is the Stability Coefficient depending on the
shape of the protective stone. Obtained from the
table and used the number is 1.1
5. S
S
1.517,72
1025
1,48
6. θ, is the angle of slope of the retaining wall. Enter
data according to the desired angle or with the
"trial and error" technique
7. cotθ
cotθ
3,223
8. W
.
.
(
Pratikto, et.a., 2014)
W
1.517,72 x 0,6
1,1.1,48 1
cot
38
2.674,5 kg
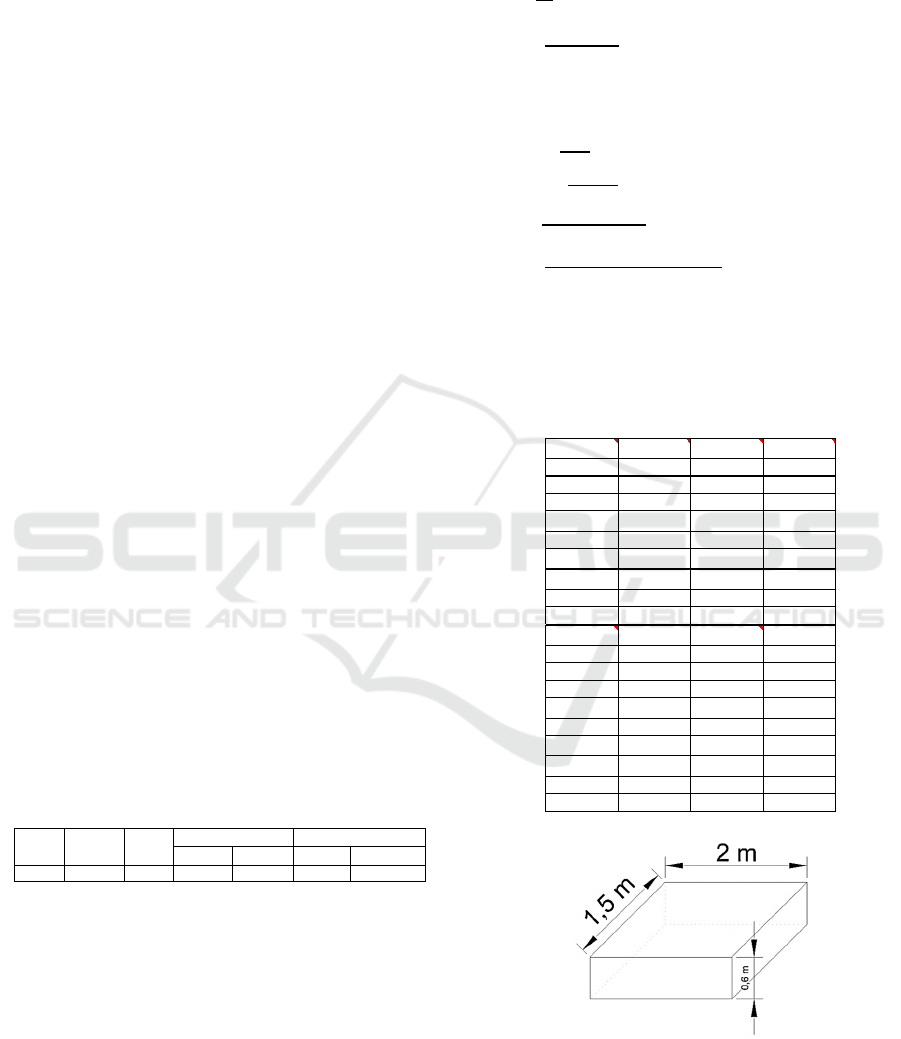
According to the results of the data above, the weight
of the contents of one geobag uses (W) = 2.674,5 kg
as given in Table 9 and the geobag dimension size is
shown in Figure 6.
Table 9: Weight of Geobag grain content.
Figure 6: Geobag dimension size.
The height, width and length of the geobag size are
determined from the height requirements of the
retaining wall that are planned for the geobag
(t/m
3
)(kg/m
3
)(t/m
3
)(kg/m
3
)
3 3 - 3,5 11,31 1,23 1.116 1,673 1.517,72
γ
sat
Subsoil Depth (m)
ф
0
γ
d
(vol.kering)
W(kg) γ
r
(kg/m3) γ
a
(kg/m3) H (m)
-2683,01 1.517,72 1.025 0,6
-2678,62 1.517,72 1.025 0,6
-415,50 1.517,72 1.025 0,6
-35,62 1.517,72 1.025 0,6
2605,36 1.517,72 1.025 0,6
2674,50 1.517,72 1.025 0,6
-1915,39 1.517,72 1.025 0,6
-1564,88 1.517,72 1.025 0,6
1473,76 1.517,72 1.025 0,6
K
D
Sr θ cot θ (1/tan θ)
1,1 1,48 25 -7,489
1,1 1,48 28 -3,553
1,1 1,48 30 -0,156
1,1 1,48 33 -0,013
1,1 1,48 35 2,111
1,1 1,48 38 3,223
1,1 1,48 40 -0,895
1,1 1,48 43 -0,667
1,1 1,48 45 0,617
ISOCEEN 2019 - The 7th International Seminar on Ocean and Coastal Engineering, Environmental and Natural Disaster Management
278
stacking or stacking place. Therefore, the size of this
geobag is determined using the "Volume Weight
Formula" with the "trial and error" technique until the
volume weight above is in accordance with or slightly
larger than the volume weight plan.
4.6 The Earth Pressure and Gravity
Retaining Walls
To obtain structural resistance, the active earth (soil)
pressure coefficient and the forces acting on each
layer of geobag that will be stacked can be obtained
so that the height and width of the structure are in
accordance with the dimensions planned. The
calculation results of the soil pressure and is given in
Table 10, while the working force on the geobag layer
is given in is given in Table 11. The diagram of soil
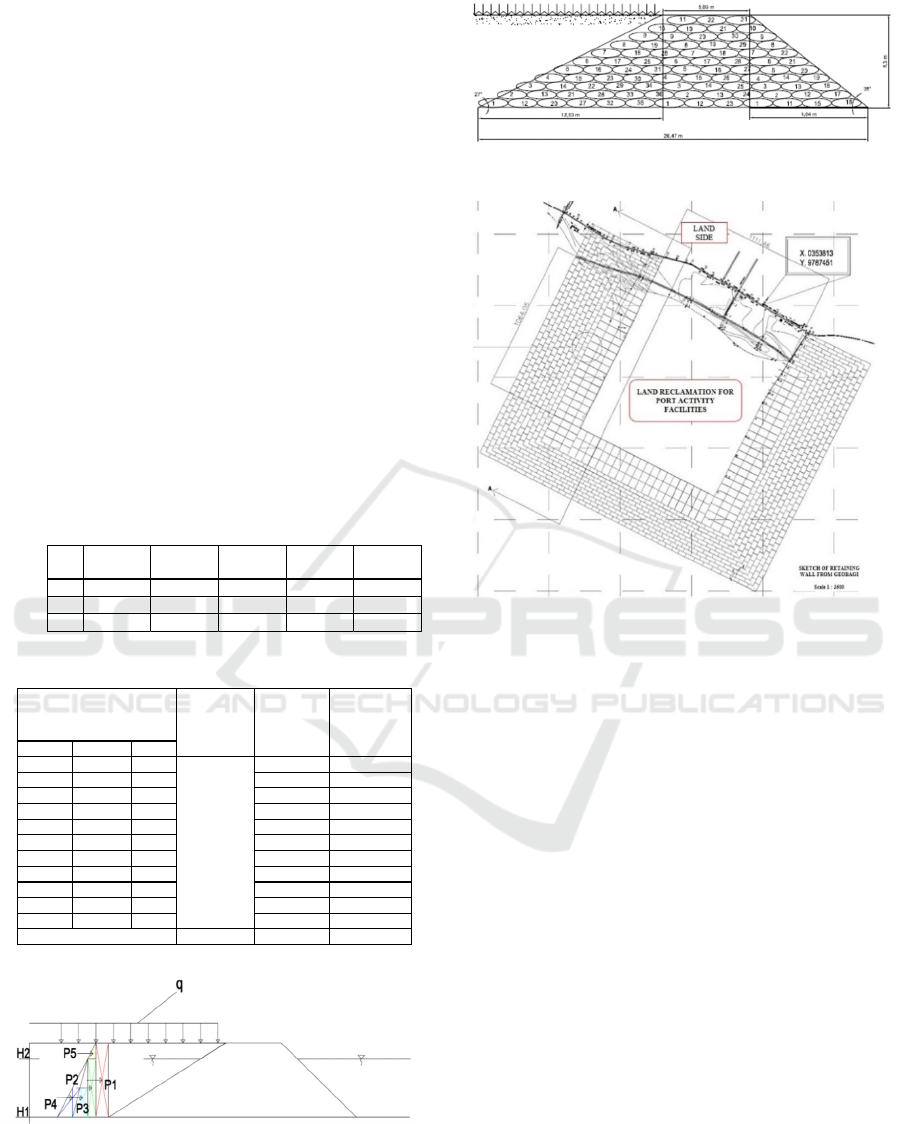
pressure and the cross-section of retaining wall are
given in Figure 7 and Figure 8, respectively. The top
view of geobag formation used to construct the
retaining wall is given in Figure 9.
Table 10: Soil pressure calculation results.
Table 11: The working force on the geobag layer.
Figure 7: Diagram of Soil Pressure.
Figure 8: Retaining Walls.
Figure 9: Top View of Geobag Formation.
The height of the retaining wall is determined by the
deepest point from the coastline to the length of the
reclaimed land and the width of the retaining wall
depending on the geobag stacking pattern adjusted to
the ground level.
4.7 Stability of External Forces
a. Overturning
Moment of prisoner due to own heavy
construction
∑
M
2.423.370 kg.m
Overturning moment due to active force
∑
M
589.210 kg.m.
𝐅𝐒
𝐨𝐯𝐞𝐫𝐭𝐮𝐫𝐧𝐢𝐧𝐠
𝟒,𝟏𝟏 𝟐 OK !
Retaining Wall Design is safe against collapse due
to overturning.
b. Sliding Failure
where :
ΣF
R
= 240,33
ΣF
D
= 128,825
𝐅𝐒
𝐬𝐥𝐢𝐝𝐢𝐧𝐠
𝟏,𝟖𝟕 𝟏,𝟓 OK !
Retaining Wall Design is safe against collapse due
to sliding.
No H (m) Ka
Pressure σ
(Kg/m2)
Pa (Kg/m)
Point of
Force (m)
1 6.3 0.67 3845.88 24229.07 3.15
2 6.3 0.67 4724.55 14882.33 2.10
3 5 0.67 5100.12 12750.31 1.67
Height (m) Distance (m) Total
0.3 0.3 13 15626.45 13564.16
0.9 0.6 12 17362.72 15549.16
1.5 0.6 11 19533.06 18214.73
2.1 0.6 10 22323.50 4207.60
2.7 0.6 9 10630.24 6502.66
3.3 0.6 8 12756.28 8797.71
3.9 0.6 7 14882.33 11092.77
4.5 0.6 6 17008.38 13387.83
5.1 0.6 5 19134.43 15682.88
5.7 0.6 4 21260.47 17977.94
6.3 0.3 3
24229.07 170517.86 124977.43
Geobag Layer
Total
The wor king
force of each
geobag layer due
to load is evenly
distributed (kg/m)
The wor king
force of each dry
soi l geobag layer
(kg/m)
The working force
of each wet soil
geobag layer
(kg/m)
24229.07
Analysis of Soil Retaining Wall from Geosynthetic for Sea Reclamation to Become a New Land in the Beach
279

c. Bearing Capacity Failure
Where :
q
ult
= 34.774 kg
e = 5,61 < 4,4
q
maks
= 9.084 kg
𝐅𝐒
𝐛𝐞𝐚𝐫𝐢𝐧𝐠𝐜𝐚𝐩𝐚𝐜𝐢𝐭𝐲
𝟒,𝟒𝟏𝟑 OK !
Retaining Wall Design is safe against collapse due
to bearing capacity failure.
5 CONCLUSION
The dimensions of the retaining wall are determined
based on the water depth from the results of the
bathymetry and tide surveys. Meanwhile, the material
of filled geobag can be obtained from the results of
the type of soil that will be filled as geobag filling
material dan dimension use trial and error technique
until the volume weight above corresponds to or is
slightly greater than the volume weight plan. From
the results of the calculation of the strength of the
geobag retaining wall, the following points can be
concluded:
1. The height of the retaining wall is taken from the
deepest point of bathymetry, which is 6.3 m and
the break wave height per 10 year return period is
0.6 m. It’s width is adjusted by the geobag
stacking to the height of the retaining wall until it
forms a trapezoidal shape of 26.47 m. This
retaining wall has 11 geobag layers with the most
bottom layer are 13 geobags and the top layer are
3 geobags. The slope of the angles on the left and
right sides are different, on the left side which
attaches to the land which is 27
0
and the right side
on the seafront is 38
0
.
2. Geobag dimensions are 2 x 1.5 x 0.6 m using trial
and error until the weight is in accordance with the
grain weight of the protective stone.
3. Geobag retaining walls are strong against external
force stability due to overturning, sliding, and
bearing capacity. The result exceeds the standard
threshold value.
REFERENCES
Bachtiar, V., 2010. Foundation Engineering 1. Pontianak,
Tanjungpura University
CMAA (Concrete Mansory Association of Australia).
(2003) Concrete Masonry Gravity Retaining Walls.-
edn. Australia: Adbri Masonry
Duan, H., Zhang, H., Huang, Q., Zhang, Y., Hu, M., Niu,
Y., Zhu, J. 2016. ‘Charateristic and Enviromental
Impact Analysis of Sea Land Reclamation Activites in
China’, Journal of Ocean and Coastal Management 130,
p128-137
ILRB (Indonesian Loading Regulations for Buildings),
1983. Bandung. Directorate of Inquiry into Building
Problems.
Ketapang Regency Transportation Department (KRTD).
2012. Regional Port Feasibility Study in Ketapang
Regency, West Kalimantan Province. Ketapang.
McComas, M.R. 1972. ‘Geology and Land Reclamation’,
The Ohio Jurnal of Science, 72(2), p65-75.
Sarfaraz, M.D., Wahed, M.D., Sadik, S., Muhit, S.M.,
2011. ‘Enviromental Impacts of using Sand Filled Geo-
bag Technology Under Water in River Erosion
Protection of Major Rivers in Bangladesh’, Proceeding
of International Conference on Enviromental
Technology Construction Engineering for Sustainable
Development, ISBN: 978-984-33-3054-3
NAUE Germany. 1967. NAUE Geosynthetic [Online].
Available at: https://www.naue.com/naue-
geosynthetics/ (Accessed: 10 Juni 2020)
Public Works Department (PWD). 2008. Minister of Public
Works Regulation No.40 / PRT / M / 2007 concerning
the Applied Modules for Spatial Planning Guidelines
for Coastal Reclamation Areas. Jakarta.
Pratikto, W.A., Suntoyo, Solihin, Sambodho, K., 2014.
Struktur Pelindung Pantai, PT. Mediatama Saptakarya
(PT. Medisa), Yayasan Badan Penerbit Pekerjaan
Umum, Jakarta.
Sari, U.C., Sholeh, M.N., Hermanto, I., 2020. Stability
Analyisis Study of Conventional Retaining Walls
Variation Design in Vertical Slope’, Journal of Phyiscs
: Conference Series, 1444 (2020) 012053.
Zornberg, J.G. and Christopher, B.R. 2007 ‘Geosynthetic’
in Deller, Jacques W. (2nd ed.) The Handbook of
Groundwater Engineering.2nd edn. Florida : CRS
Press, Taylor & Francis Group, pp. 1-34.
ISOCEEN 2019 - The 7th International Seminar on Ocean and Coastal Engineering, Environmental and Natural Disaster Management
280
